Migration from Latin America to Europe
Latin American migration to Europe is the diaspora of Latin Americans to the continent of Europe, dating back to the first decades of the Spanish and Portuguese empires in the Americas. Latin Americans in Europe are now a rapidly growing group consisting of immigrants from Argentina, Bolivia, Brazil, Chile, Colombia, Costa Rica, Cuba, Dominican Republic, Ecuador, El Salvador, Guatemala, Honduras, Mexico, Nicaragua, Panama, Paraguay, Peru, Puerto Rico, Uruguay and Venezuela. A large majority of these are residents in Spain or have been naturalized as Spanish citizens, and in the case of Brazilians, residents of Portugal or naturalized Portuguese citizens. The main reasons of their migration to Spain and Portugal are the common language, family ties and cultural proximity to Spain and Portugal. Italy also has a sizable Latin American community, many of whom are descendants of the Italian diaspora in Latin America.
Spain
Spain is the second destination of choice after the United States for Latin American migrants and the vast majority of Latin Americans in Europe are residents or nationals of this country.[1][2]
After several years of decline since a peak in 2010, the population of Spain born in Latin American has grown again since 2016. In 2019, 3,114,076 Spanish people born in South, Central America or the Caribbean (excluding Puerto Rico) had been legally residing in Spain for the last 12 months, compared to 2,340,247 in 2016 and 2,459,098 in 2010. A majority hold Spanish citizenship.[3][4]
Following the "Law of historic memory" Latin Americans with a Spanish parent or grandparent (and their descendants) have automatic right to Spanish citizenship, even without residing in the country. This potentially applies to millions of Latin Americans. In addition, all Latin Americans from Spanish speaking countries qualify for Spanish citizens after two years' residence, regardless of recent ancestry. This compares very favorably to the requirement of ten years' residence for immigrants from other countries.
As a result a significant and ever growing portion of Latin American immigrants have acquired Spanish citizenship due to naturalization laws and the falling number of Latin Americans residing in Spain is primarily due to them acquiring Spanish nationality and no longer being classed as immigrants. In the period between 2011 and 2013, over one million immigrants acquired Spanish citizenship and over 75% of these were Latin American.[5] As an example, by 2014 the majority of Spain's 408,944 Ecuatorian-born residents had already acquired Spanish citizenship and were no longer included national statistics tracking immigration.[6] As a result, Latin Americans with Spanish citizenship living in other European countries such as the UK, France or Germany benefiting from European freedom of movement and establishment for all EU citizens will be categorized as Spaniards when using nationality as a criterion to determine the country of origin (rather than country of birth) of a particular EU country's immigrant population.[7][8] Despite Spain's prolonged 2008-2015 economic crisis during which the country suffered years of massive unemployment and went from having the second highest immigration rate in the world to becoming a net-emigrant country, less than 30% of Spain's Latin American immigrants have left the country during this period.[9] As a result of the combined effect of nationalization and net emigration during the economic crisis, the Latin American resident population yet to acquire Spanish nationality fell steadily to around 900,000 in 2015.[10]
| Country of birth | Population (2019)[11] | Corresponding article |
|---|---|---|
| 408,083 | Ecuadorians in Spain | |
| 440,197 | Colombians in Spain | |
| 267,994 | Argentines in Spain | |
| 323,575 | Venezuelans in Spain | |
| 218,129 | Peruvians in Spain | |
| 173,531 | Dominicans in Spain | |
| 174,672 | ||
| 151,327 | ||
| 143,228 | ||
| 97,528 | Paraguayans in Spain | |
| 105,943 | ||
| 75,770 | Uruguayans in Spain |
Germany
| Country of birth | Population (2015)[12] | Corresponding article |
|---|---|---|
| 38,650 | Brazilians in Germany | |
| 14,204 | Mexicans in Germany | |
| 13,992 | ||
| 9,179 | ||
| 8,493 | ||
| 6,976 | ||
| 6,426 | ||
| 4,993 | ||
| 4,791 | ||
| 4,527 | ||
| 1,818 | ||
| 1,320 |
France
The most numerous are the Brazilians (120,550),[13] followed by Colombians (40,000)[14] and Venezuelans (30,000),[15] Peruvians (22,002)[16] Argentinians (11,899)[17] and Chileans (15,782).[18]
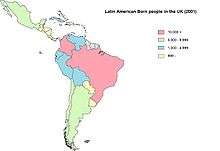
United Kingdom
According to the 2001 UK Census, 62,735 Latin Americans in the United Kingdom were born in their respective nations of origin.[19] There were also a further 1,338 people who stated their birthplace as 'South or Central America' (note this would also include Guyana, French Guiana, and Suriname, which are not part of Latin America.).[19] In 2009, the Office for National Statistics estimated that the number of Brazilian-born people in the UK alone had risen to around 60,000 and the number of Colombian-born to around 22,000. Estimates for other Latin American countries were not made because the sample size did not allow for estimation of the size of smaller groups with sufficient degree of accuracy.[20]
| Country of birth | Population (2011 census)[21][22][23] | Corresponding article |
|---|---|---|
| 52,148 | Brazilians in the United Kingdom | |
| 25,761 | Colombians in the United Kingdom | |
| 10,550 | ||
| 9,771 | Mexicans in the United Kingdom | |
| 9,150 | ||
| 8,767 | Ecuadorians in the United Kingdom | |
| 7,246 | Peruvians in the United Kingdom | |
| 7,130 | Chileans in the United Kingdom | |
| 3,765 | Bolivians in the United Kingdom | |
| 2,481 | ||
| 1,377 | ||
| 1,364 |
Norway
From 1977 to 2012, the number of non-Norwegian citizens living in Norway of European descent has increased from around 46,000 to around 280,000. In the same period the number of citizens of nations on other continents increased from about 25,000 to about 127,000, of which 112,230 belong to Asia, Africa and South America.[25]
Immigrants and Norwegian-born to immigrant parents, by country of origin
| Rank | Country of origin[26] | Population (2001)[27] | Population (2014)[28] |
|---|---|---|---|
| 1. | 6,491 | 7,904 | |
| 2. | 824 | 4,017 | |
| 3. | 604 | 3,841 | |
| 4. | 492 | 1,295 | |
| 5. | 286 | 959 | |
| 6. | 378 | 890 | |
| 7. | 276 | 844 | |
| 8. | 174 | 492 | |
| 9. | 134 | 308 | |
| 11. | 134 | 235 | |
| 12. | 167 | 234 | |
| 13. | 81 | 191 | |
| 15. | 78 | 159 | |
| 16. | 52 | 133 | |
| 17. | 64 | 117 |
The Netherlands
Immigrants and Dutch-born to immigrant parents
Iberian America
| Country of origin[29] | Population (1996)[30] | Population (2000) | Population (2005) | Population (2010) | Population (2015) | Population (2019) |
|---|---|---|---|---|---|---|
| 2,952 | 3,239 | 4,167 | 4,522 | 4,245 | 6,508 | |
| 408 | 547 | 744 | 954 | 1,170 | 1,415 | |
| 6,589 | 8,913 | 12,289 | 17,022 | 22,041 | 30,104 | |
| 3,566 | 3,937 | 4,564 | 4,936 | 5,488 | 6,207 | |
| 4,937 | 7,025 | 9,885 | 12,292 | 15,346 | 18,351 | |
| 274 | 444 | 623 | 741 | 970 | 1,242 | |
| 361 | 781 | 1,361 | 1,748 | 2,052 | 2,333 | |
| 5,321 | 7,341 | 9,843 | 11,600 | 13,651 | 15,206 | |
| 559 | 1,121 | 1,883 | 2,466 | 3,200 | 3,943 | |
| 304 | 350 | 453 | 544 | 626 | 752 | |
| 229 | 339 | 471 | 604 | 815 | 1,034 | |
| 203 | 269 | 387 | 505 | 670 | 816 | |
| 1,251 | 1,802 | 2,894 | 4,054 | 5,548 | 7,618 | |
| 273 | 314 | 403 | 535 | 693 | 843 | |
| 244 | 278 | 353 | 393 | 470 | 561 | |
| 215 | 238 | 270 | 281 | 328 | 371 | |
| 1,849 | 2,418 | 3,662 | 4,925 | 6,100 | 7,324 | |
| 91 | 101 | 132 | 153 | 199 | 241 | |
| 805 | 886 | 997 | 1,069 | 1,135 | 1,234 | |
| 2,257 | 2,948 | 4,090 | 4,936 | 6,002 | 7,420 |
| Country of origin[31] | Population (1996)[32] | Population (2000) | Population (2005) | Population (2010) | Population (2015) | Population (2019) |
|---|---|---|---|---|---|---|
| 274 | 592 | 1,204 | 2,250 | 4,130 | 5,610 | |
| 203 | 982 | |||||
| 15 | 64 | |||||
| 86,550 | 106,605 | 129,334 | 136,170 | 144,565[36] | 154,510[37] | |
- includes Saba, Sint Maarten and Sint Eustatius which are not considered a part of Latin America because of the lack of Papiamentu language
| Country of origin[38] | Population (1996)[39] | Population (2000) | Population (2005) | Population (2010) | Population (2015) | Population (2019) |
|---|---|---|---|---|---|---|
| 85 | 94 | 105 | 106 | 121 | 123 | |
| 401 | 477 | 707 | 716 | 767 | 836 | |
| 194 | 219 | 306 | 301 | 327 | 397 | |
| 223 | 331 | 540 | 619 | 703 | 865 |
Portugal
In 2008, Portugal's foreign population grew 1% from 435,736 in 2007 to 440,277. One in four immigrants is Brazilian,[40] and Portugal was a country for an increasing amount of Venezuelans. There are also other communities from Argentina, the latter can have Portuguese ancestry due to the historical ties between both nations.[41]
| Country of birth | Population (2011)[42] | Corresponding article |
|---|---|---|
| 139,703 | Brazilians in Portugal | |
| 25,157 |
Switzerland
In 2013 there were a total of 1,937,447 permanent foreign residents (23.8% of the total population of 8.14 million) in Switzerland. Of these, 51,761 were from Latin America and the Caribbean.[43]
Italy
The list is not complete, as it does not include some Latin Americans that have gotten citizenship via jus sanguinis.
| Rank | Country of origin | Population (2017)[44] |
|---|---|---|
| 1. | 99,110 | |
| 2. | 83,120 | |
| 3. | 45,410 | |
| 4. | 28,002 | |
| 5. | 20,986 | |
| 6. | 17,968 | |
| 7. | 14,076 | |
| 8. | 13,492 | |
| 9. | 8,009 | |
| 10. | 6,327 | |
| 11. | 4,211 | |
| 12. | 3,167 | |
| 13. | 2,015 | |
| 14. | 1,781 | |
| 15. | 1,248 |
European Union (in general)
| HORIZONTALLY: Country of Residence VERTICALLY: Country of Origin[47] | Belgium | Bulgaria | Czechia | Denmark | Germany | Estonia | Ireland | Greece | Spain | France | Croatia | Italy | Cyprus | Latvia | Lithuania | Luxembourg | Hungary | Malta | Netherlands (2019) | Austria | Poland [48] | Portugal | Romania | Slovenia | Slovakia | Finland | Sweden | Iceland | Liechtenstein | Norway | Switzerland | United Kingdom |
|---|---|---|---|---|---|---|---|---|---|---|---|---|---|---|---|---|---|---|---|---|---|---|---|---|---|---|---|---|---|---|---|---|
| Argentina | 2036 | 118 | 367 | 1081 | 14400 | 13 | 756 | 663 | 281115 | 12519 | 202 | 65136 | 140 | 18 | - | 213 | 222 | 11 | 6508 | 1360 | 303 | 1375 | 94 | 425 | 73 | 290 | 2919 | 30 | - | 928 | 7755 | 10550 |
| Bolivia | 1031 | 22 | 92 | 429 | 3820 | 1 | 108 | 24 | 187885 | 3058 | 33 | 12891 | 10 | 0 | - | 24 | 34 | 2 | 1415 | 438 | 54 | 195 | 12 | 12 | 12 | 128 | 4050 | 13 | - | 487 | 2784 | 3765 |
| Brazil | 10441 | 91 | 509 | 3012 | 47590 | 56 | 9298 | 2293 | 101640 | 56712 | 195 | 83615 | 110 | 25 | - | 1795 | 426 | 94 | 30104 | 4550 | 358 | 139703 | 129 | 81 | 46 | 980 | 6381 | 113 | - | 4099 | 28779 | 52150 |
| Chile | 4085 | 21 | 127 | 1455 | 11380 | 7 | 311 | 380 | 68075 | 13730 | 127 | 11129 | 31 | 4 | - | 165 | 118 | 8 | 6207 | 1105 | 94 | 276 | 42 | 28 | 16 | 367 | 28712 | 70 | - | 6449 | 5966 | 7140 |
| Colombia | 5270 | 23 | 236 | 2947 | 17630 | 12 | 330 | 413 | 379400 | 26679 | 46 | 32256 | 69 | 7 | - | 247 | 158 | 11 | 18351 | 1413 | 137 | 767 | 42 | 30 | 31 | 854 | 10929 | 159 | - | 5138 | 9340 | 25760 |
| Costa Rica | 256 | 5 | 64 | 146 | 1.400 | 2 | 24 | 39 | 3390 | 693 | 6 | 1267 | 5 | 0 | - | 10 | 22 | 7 | 1242 | 152 | 40 | 42 | 12 | 2 | 5 | 52 | 354 | 4 | - | 247 | 778 | 725 |
| Cuba | 1496 | 258 | 687 | 437 | 11110 | 17 | 196 | 365 | 110120 | 4637 | 13 | 26346 | 42 | 51 | - | 98 | 406 | 4 | 2.333 | 786 | 261 | 978 | 55 | 53 | 96 | 343 | 2416 | 38 | - | 818 | 2748 | 2480 |
| Dominican Republic | 2125 | 21 | 41 | 134 | 9.240 | 1 | 37 | 585 | 119490 | 3334 | 0 | 33163 | 25 | 1 | 0 | 328 | 17 | 10 | 15206 | 2809 | 38 | 142 | 17 | 166 | 11 | 121 | 566 | 27 | - | 667 | 7288 | 1385 |
| Ecuador | 5180 | 13 | 109 | 550 | 7480 | 6 | 103 | 87 | 412380 | 4178 | 12 | 75288 | 16 | 3 | - | 109 | 98 | 7 | 3943 | 592 | 70 | 440 | 28 | 7 | 22 | 153 | 2.101 | 27 | - | 611 | 4099 | 8765 |
| El Salvador | 417 | 7 | 19 | 77 | 960 | 2 | 54 | 52 | 8650 | 1093 | 0 | 9689 | 13 | 0 | - | 20 | 7 | 3 | 752 | 74 | 5 | 37 | 4 | 0 | 0 | 48 | 2725 | 12 | - | 167 | 568 | 885 |
| Guatemala | 775 | 6 | 36 | 224 | 1760 | 6 | 272 | 31 | 6595 | 2956 | 0 | 1856 | 11 | 1 | 0 | 85 | 11 | 7 | 1034 | 333 | 8 | 60 | 10 | 1 | 3 | 63 | 735 | 28 | - | 413 | 554 | 975 |
| Honduras | 195 | 0 | 21 | 115 | 1010 | 1 | 29 | 52 | 30675 | 575 | 0 | 1672 | 8 | 0 | 0 | 6 | 11 | 3 | 816 | 86 | 8 | 43 | 8 | 2 | 2 | 38 | 318 | 28 | - | 85 | 348 | 640 |
| Mexico | 1994 | 25 | 442 | 968 | 13020 | 25 | 889 | 410 | 44000 | 12609 | 40 | 6927 | 54 | 18 | - | 200 | 342 | 9 | 7618 | 1452 | 302 | 371 | 65 | 43 | 62 | 518 | 2107 | 74 | - | 960 | 4858 | 9770 |
| Nicaragua | 268 | 29 | 19 | 178 | 920 | 1 | 34 | 166 | 12645 | 639 | 0 | 971 | 8 | 0 | 0 | 10 | 10 | 1 | 843 | 198 | 10 | 26 | : | 2 | 9 | 86 | 672 | 6 | - | 151 | 383 | 380 |
| Panama | 158 | 6 | 40 | 70 | 730 | 0 | 33 | 162 | 3765 | 470 | 13 | 920 | 9 | 0 | 0 | 15 | 28 | 4 | 561 | 62 | 38 | 118 | 4 | 3 | 12 | 21 | 234 | 4 | - | 40 | 279 | 715 |
| Paraguay | 397 | 0 | 58 | 74 | 3940 | 0 | 54 | 82 | 71905 | 1114 | 12 | 2014 | 4 | 2 | - | 27 | 15 | 0 | 371 | 199 | 3 | 97 | 10 | 6 | 3 | 13 | 143 | 6 | - | 133 | 966 | 760 |
| Peru | 3272 | 21 | 240 | 989 | 14520 | 14 | 330 | 301 | 184840 | 11466 | 86 | 96675 | 32 | 7 | - | 363 | 159 | 28 | 7324 | 1485 | 97 | 403 | 72 | 36 | 39 | 406 | 7006 | 70 | - | 1254 | 7878 | 7245 |
| Uruguay | 447 | 17 | 41 | 208 | 2900 | 4 | 142 | 116 | 91715 | 2246 | 14 | 6573 | 7 | 3 | - | 69 | 49 | 1 | 1234 | 211 | 106 | 221 | 7 | 5 | 13 | 80 | 2226 | 7 | - | 206 | 1411 | 1370 |
| Venezuela | 1206 | 26 | 117 | 616 | 6490 | 7 | 482 | 1062 | 143670 | 6385 | 56 | 44469 | 39 | 30 | - | 221 | 136 | 13 | 7420 | 841 | 83 | 25157 | 34 | 40 | 13 | 126 | 897 | 33 | - | 786 | 3086 | 9150 |
| Total amount of latinos by country of residence | 41049 | 709 | 3265 | 13710 | 170300 | 175 | 13482 | 7283 | 2261955 | 165093 | 855 | 512857 | 633 | 170 | 0 | 4005 | 2269 | 223 | 113282 | 18146 | 2015 | 170451 | 645 | 942 | 468 | 4687 | 75491 | 749 | 0 | 23639 | 89868 | 144.610 |
Total amount of latinos residing in the European Union (as of 2011); ~3.843.026
References
- http://repositorio.cepal.org/bitstream/handle/11362/37218/S1420586_es.pdf?sequence=1
- "La Cepal cifra en 28,5 millones el número de emigrantes latinoamericanos - La Celosía". Lacelosia.com. 2013-12-17. Retrieved 2018-04-25.
- "Población (españoles/extranjeros) por País de Nacimiento, sexo y año". Instituto Nacional de Estadística. Retrieved 4 February 2019.
- https://www.ine.es/jaxi/Datos.htm?path=/t20/e245/p04/provi/l0/&file=0ccaa005.px
- "Inicio - Elcano" (in Spanish). Realinstitutoelcano.org. 2013-06-14. Retrieved 2018-04-25.
- "El número de ecuatorianos en España baja un 8,83% debido a las nacionalizaciones | Internacional | Noticias" (in Spanish). El Universo. 2016-06-30. Retrieved 2018-04-25.
- Rainer Münz (2006-06-01). "Europe: Population and Migration in 2005". migrationpolicy.org. Retrieved 2018-04-25.
- "Population data - Eurostat". Ec.europa.eu. Retrieved 2018-04-25.
- "Informe OCDE: El 30% de los inmigrantes latinoamericanos se fueron de España durante la crisis". Elconfidencial.com. 2015-08-29. Retrieved 2018-04-25.
- "La población latinoamericana en España se reduce en 151.010 personas". Ociolatino.com. Retrieved 2018-04-25.
- "Población (españoles/extranjeros) por País de Nacimiento, sexo y año" (in Spanish). Instituto Nacional de Estadística. Retrieved 2019-07-30.
- "Pressemitteilungen - Ausländische Bevölkerung - Statistisches Bundesamt (Destatis)" (in German). Destatis.de. Retrieved 2018-04-25.
- "Brasileiros no Mundo - Estimativas" [Brazilians Around The World - Estimations] (PDF) (in Portuguese). Ministry of External Relations. 2015-03-28. Retrieved 2016-03-24.
- "The French connection in Colombia". Retrieved 27 November 2018.
- "Venezolanos en el exterior". Últimas Noticias. Archived from the original on 2014-12-05.
- "PERÚ Instituto Nacional de Estadística e Informática". inei.gob.pe.
- "Perfil Migratorio de Argentina 2012" (PDF). iom.int (in Spanish). Organización Internacional para las Migraciones (OIM). Retrieved 26 June 2015.
- "CHILENOS EN EL EXTERIOR" (PDF). aerchipro.com (in Spanish). Archived from the original (PDF) on 26 June 2015. Retrieved 26 June 2015.
- "Country-of-birth database". Organisation for Economic Co-operation and Development. Archived from the original on 25 April 2007. Retrieved 29 July 2010.
- "Estimated population resident in the United Kingdom, by foreign country of birth (Table 1.3)". Office for National Statistics. Archived from the original on 22 January 2011. Retrieved 29 July 2010. Figure given is the central estimate. See the source for 95 per cent confidence intervals.
- "Table QS213EW: 2011 Census: Country of birth (expanded), regions in England and Wales". Office for National Statistics. 26 March 2013. Retrieved 18 July 2015.
- "Country of birth (detailed)" (PDF). National Records of Scotland. Retrieved 18 July 2015.
- "Country of Birth – Full Detail: QS206NI". Northern Ireland Statistics and Research Agency. Archived from the original on 4 March 2016. Retrieved 18 July 2015.
- "Archived copy" (PDF). Archived from the original (PDF) on 2017-03-15. Retrieved 2016-12-14.CS1 maint: archived copy as title (link)
- "Tabell:05196: Folkemengde, etter kjønn, alder og statsborgerskap" [Table:05196: Population by gender, age and citizenship] (in Norwegian). Statistics Norway. Retrieved July 18, 2012.
- Immigrants and Norwegian-born to immigrant parents
- "Innvandrarbefolkninga og personar med annan innvandringsbakgrunn, etter innvandringskategori, kjønn og landbakgrunn. 1. januar 2001". Statistics Norway (in Norwegian).
- "Immigrants and Norwegian-born to immigrant parents, 1 January 2015". Statistics Norway. Accessed 21 May 2015.
- Immigrants and Dutch-born to immigrant parents
- "Bevolking; geslacht, leeftijd, generatie en migratieachtergrond, 1 januari 2019". Centraal Bureau voor de Statistiek (in Dutch).
- Immigrants and Dutch-born to immigrant parents
- "Bevolking; geslacht, leeftijd, generatie en migratieachtergrond, 1 januari 2019". Centraal Bureau voor de Statistiek (in Dutch).
- Immigration after Dissolution of the Netherlands Antilles
- Immigration after Dissolution of the Netherlands Antilles
- Includes Saba and Sint-Eustatius which are not part of Latin America, Bonaire does
- 8395 of the 144,565 Netherlands Antilleans born to immigrant parents from the Netherlands Antilles after the Dissolution of the Netherlands Antilles
- 18340 of the 154,510 Netherlands Antilleans born to immigrant parents from the Netherlands Antilles after the Dissolution of the Netherlands Antilles
- Immigrants and Dutch-born to immigrant parents
- "Bevolking; geslacht, leeftijd, generatie en migratieachtergrond, 1 januari 2019". Centraal Bureau voor de Statistiek (in Dutch).
- Um em cada quatro imigrantes é de nacionalidade brasileira Archived 2009-07-16 at the Wayback Machine – Diário de Notícias
- Argentina e Portugal, uma longa amizade – Diário de Notícias
- "Estrangeiros e nascidos no estrangeiro residentes em Portugal, CPLP em destaque" (in Portuguese). Instituto Nacional de Estatística. Retrieved 2019-07-30.
- Bevölkerung – Die wichtigsten Zahlen Swiss Federal Statistical Office, accessed 6 October 2014
- "Statistiche demografiche ISTAT". demo.istat.it. Retrieved 2019-02-12.
- "Immigration to Sweden", Wikipedia, 2019-09-22, retrieved 2019-10-03
- Gonçalves, Ana Marta. "Brazilian student: Coming to Dublin was a dream come true but sharing a house with 14 others was a nightmare". TheJournal.ie. Retrieved 2019-10-03.
- Eurostat Database (Data -> Population Consensus) https://ec.europa.eu/CensusHub2/query.do?step=selectHyperCube&qhc=false
- (Unreliable statistics, stated by Eurostat)
See also
- List of countries by immigrant population
- Latin American migration to the United Kingdom
- Hispanic and Latino Americans
- Latino diaspora