List of sovereign states in Europe by Human Development Index
The table below presents the latest Human Development Index (HDI)[1] for countries in Europe as included in a United Nations Development Programme's Human Development Report (released in 2019).[2] Previous HDI values and rankings are retroactively recalculated using the same updated data sets and current methodologies, as presented in Table 2 of the Statistical Annex of the Human Development Report.[3]
| List of Countries in Europe by Human Development Index | |||||
|---|---|---|---|---|---|
| Rank | Country | Human Development Index (HDI) | |||
| in region | HDI rank | HDI 2018 | HDI 2017 | Change in HDI value 2017–18 | |
| 1 | 1 | 0.954 | 0.953 | ||
| 2 | 2 | 0.946 | 0.943 | ||
| 3 | 3 | 0.942 | 0.939 | ||
| 4 | 4 | 0.939 | 0.938 | ||
| 5 | 6 | 0.938 | 0.935 | ||
| 6 | 8 | 0.937 | 0.936 | ||
| 7 | 10 | 0.933 | 0.932 | ||
| 8 | 11 | 0.930 | 0.929 | ||
| 9 | 12 | 0.925 | 0.924 | ||
| 10 | 15 | 0.920 | 0.919 | ||
| 11 | 17 | 0.919 | 0.917 | ||
| 12 | 18 | 0.917 | 0.916 | ||
| 13 | 20 | 0.914 | 0.912 | ||
| 14 | 21 | 0.909 | 0.908 | ||
| 16 | 24 | 0.902 | 0.899 | ||
| 17 | 25 | 0.893 | 0.891 | ||
| 18 | 26 | 0.891 | 0.888 | ||
| 18 | 26 | 0.891 | 0.890 | ||
| 19 | 28 | 0.885 | 0.883 | ||
| 20 | 29 | 0.883 | 0.881 | ||
| 21 | 30 | 0.882 | 0.879 | ||
| 22 | 31 | 0.873 | 0.871 | ||
| 23 | 32 | 0.872 | 0.868 | ||
| 23 | 32 | 0.872 | 0.871 | ||
| 24 | 34 | 0.869 | 0.866 | ||
| 25 | 36 | 0.857 | 0.852 | ||
| 25 | 36 | 0.857 | 0.854 | ||
| 26 | 39 | 0.854 | 0.850 | ||
| 27 | 40 | 0.850 | 0.848 | ||
| 28 | 43 | 0.845 | 0.841 | ||
| 29 | 46 | 0.837 | 0.835 | ||
| 30 | 49 | 0.824 | 0.822 | ||
| 31 | 50 | 0.817 | 0.815 | ||
| 31 | 50 | 0.817 | 0.813 | ||
| 32 | 52 | 0.816 | 0.813 | ||
| 32 | 52 | 0.816 | 0.814 | ||
| 32 | 52 | 0.816 | 0.813 | ||
| 33 | 59 | 0.806 | 0.805 | ||
| 34 | 63 | 0.799 | 0.794 | ||
| 35 | 69 | 0.791 | 0.789 | ||
| 36 | 70 | 0.786 | 0.783 | ||
| 37 | 75 | 0.769 | 0.767 | ||
| 38 | 81 | 0.760 | 0.758 | ||
| 39 | 82 | 0.759 | 0.758 | ||
| 40 | 87 | 0.754 | 0.752 | ||
| 41 | 88 | 0.750 | 0.747 | ||
| 42 | 107 | 0.711 | 0.709 | ||
| * Change in HDI value rounded to three decimals | |||||
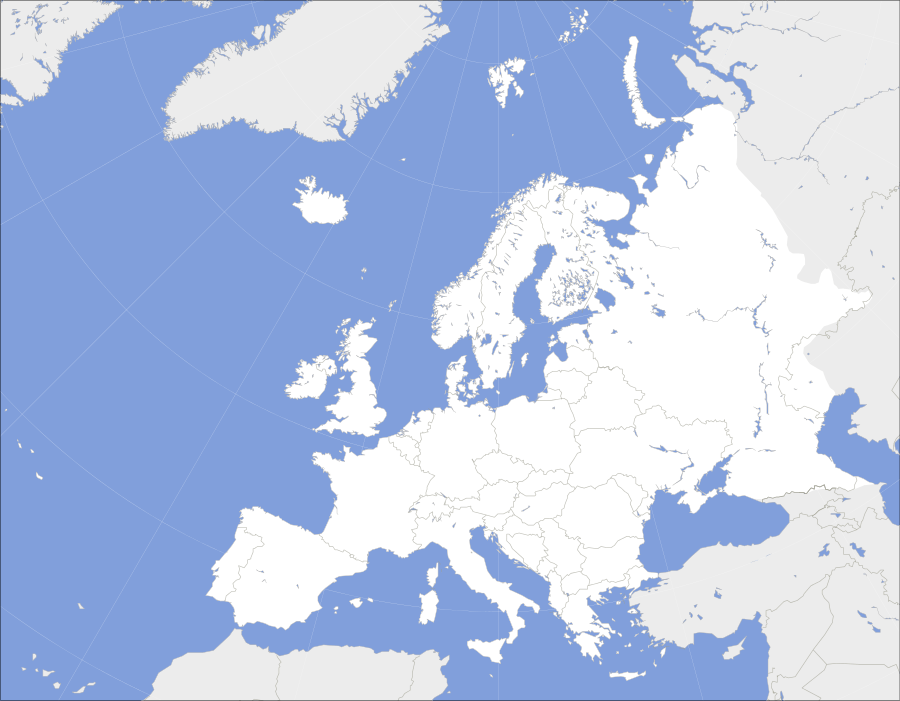
This is map and list of European countries by Human Development Index for the year 2018.[2] The color indicators are as follows: High Human Development and Very High Human Development.
0.759
Gulf of
Cadiz
Cadiz
North
Atlantic
Ocean
Atlantic
Ocean
See also
- International organisations in Europe
- List of countries by Human Development Index
- List of European countries by budget revenues
- List of European countries by budget revenues per capita
- List of European countries by GDP (nominal) per capita
- List of European countries by GNI (nominal) per capita
- List of European countries by GNI (PPP) per capita
- List of countries by GDP (nominal) per capita
- List of countries by GDP (PPP) per capita
- List of countries by GDP (nominal)
- List of countries by GDP (PPP)
References
- "Table 1: Human Development Index (HDI) and its components".
- "Human Development Report 2019 – "Human Development Indices and Indicators"" (PDF). HDRO (Human Development Report Office) United Nations Development Programme. pp. 22–25. Retrieved 9 December 2019.
- "Table 2: Trends in the Human Development Index, 1990-2015".
This article is issued from Wikipedia. The text is licensed under Creative Commons - Attribution - Sharealike. Additional terms may apply for the media files.