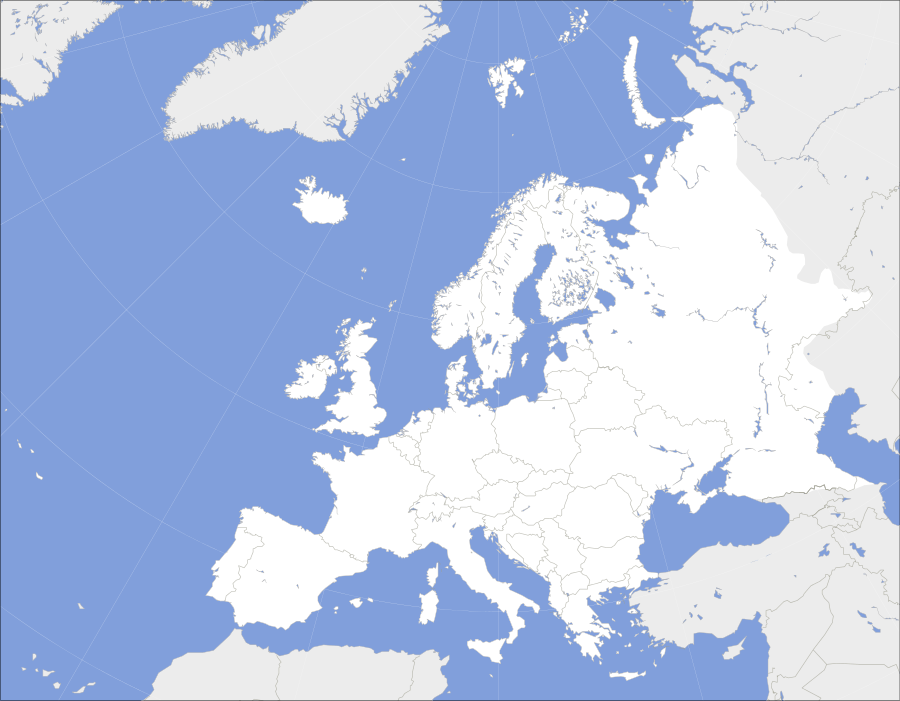
European countries by percent of population aged 0-14
Map
The map data are for the year 2014 from the World Bank.[1] Numbers are in percentage.
Table
The table data are for the year 2017 from the World Bank.[2] Numbers are in percentage.
| Country | 2017 |
|---|---|
| 17.4 | |
| 14.1 | |
| 16.7 | |
| 17.1 | |
| 14.2 | |
| 14.7 | |
| 16.8 | |
| 15.4 | |
| 16.5 | |
| 16.4 | |
| 16.4 | |
| 18.1 | |
| 13.1 | |
| 14.2 | |
| 14.3 | |
| 20.1 | |
| 21.6 | |
| 13.5 | |
| 15.4 | |
| 14.8 | |
| 16.4 | |
| 16.7 | |
| 14.4 | |
| 18.1 | |
| 16.4 | |
| 17.8 | |
| 14.8 | |
| 13.6 | |
| 15.3 | |
| 17.6 | |
| 16.5 | |
| 15.0 | |
| 14.7 | |
| 17.5 | |
| 14.9 | |
| 25.0 | |
| 15.5 | |
| 17.7 | |
See also
Plotted maps
- European countries by electricity consumption per person
- European countries by employment in agriculture (% of employed)
- European countries by fossil fuel use (% of total energy)
- European countries by health expense per person
- European countries by military expenditure as a percentage of government expenditure
- European countries by percentage of urban population
- European countries by percentage of women in national parliaments
- List of sovereign states in Europe by life expectancy
- List of sovereign states in Europe by number of Internet users
References
- "Population ages 0-14 (% of total)". The World Bank. Retrieved 11 August 2015.
- "Population ages 0-14 (% of total)". The World Bank. Retrieved 11 August 2015.
External links
This article is issued from Wikipedia. The text is licensed under Creative Commons - Attribution - Sharealike. Additional terms may apply for the media files.
