Logan County, West Virginia
| Logan County, West Virginia | |
|---|---|
 Logan County Courthouse in Logan | |
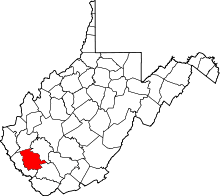 Location in the U.S. state of West Virginia | |
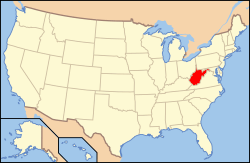 West Virginia's location in the U.S. | |
| Founded | January 12, 1824 |
| Named for | Chief Logan |
| Seat | Logan |
| Largest city | Logan |
| Area | |
| • Total | 456 sq mi (1,181 km2) |
| • Land | 454 sq mi (1,176 km2) |
| • Water | 1.9 sq mi (5 km2), 0.4% |
| Population (est.) | |
| • (2015) | 34,707 |
| • Density | 78/sq mi (30/km2) |
| Congressional district | 3rd |
| Time zone | Eastern: UTC−5/−4 |
| Website |
www |
Logan County is a county in the U.S. state of West Virginia. As of the 2010 census, the population was 36,743.[1] Its county seat is Logan.[2] The county was formed in 1824 from parts of Giles, Tazewell, Cabell, and Kanawha counties.[3] It is named for Chief Logan, famous Native American chief of the Mingo tribe.
Logan County comprises the Logan, WV Micropolitan Statistical Area, which is also included in the Charleston–Huntington–Ashland, WV–OH–KY Combined Statistical Area.
In 1921 it was the location of the Battle of Blair Mountain, one of the largest armed uprisings in U.S. history. More recently, the Buffalo Creek Flood of February 26, 1972, killed 125 people when a coal slurry dam burst under the pressure of heavy rains, releasing over 100,000,000 US gallons (380,000,000 L) of waste and water in a 30-foot (9.1 m) wave onto the valley below. The communities of Lorado and Lundale were destroyed and 14 other communities heavily damaged, including Saunders, Amherstdale, Crites, and Latrobe.
Geography
According to the U.S. Census Bureau, the county has a total area of 456 square miles (1,180 km2), of which 454 square miles (1,180 km2) is land and 1.9 square miles (4.9 km2) (0.4%) is water.[4]
Major highways
Adjacent counties
- Lincoln County (north)
- Boone County (northeast)
- Wyoming County (southeast)
- Mingo County (southwest)
Demographics
| Historical population | |||
|---|---|---|---|
| Census | Pop. | %± | |
| 1830 | 3,680 | — | |
| 1840 | 4,309 | 17.1% | |
| 1850 | 3,620 | −16.0% | |
| 1860 | 4,938 | 36.4% | |
| 1870 | 5,124 | 3.8% | |
| 1880 | 7,329 | 43.0% | |
| 1890 | 11,101 | 51.5% | |
| 1900 | 6,955 | −37.3% | |
| 1910 | 14,476 | 108.1% | |
| 1920 | 41,006 | 183.3% | |
| 1930 | 58,534 | 42.7% | |
| 1940 | 67,768 | 15.8% | |
| 1950 | 77,391 | 14.2% | |
| 1960 | 61,570 | −20.4% | |
| 1970 | 46,269 | −24.9% | |
| 1980 | 50,679 | 9.5% | |
| 1990 | 43,032 | −15.1% | |
| 2000 | 37,710 | −12.4% | |
| 2010 | 36,743 | −2.6% | |
| Est. 2016 | 33,700 | [5] | −8.3% |
| U.S. Decennial Census[6] 1790–1960[7] 1900–1990[8] 1990–2000[9] 2010–2015[1] | |||
2000 census
As of the census[10] of 2000, there were 37,710 people, 14,880 households, and 10,936 families residing in the county. The population density was 83 people per square mile (32/km²). There were 16,807 housing units at an average density of 37 per square mile (14/km²). The racial makeup of the county was 96.33% White, 2.59% Black or African American, 0.12% Native American, 0.30% Asian, 0.02% Pacific Islander, 0.06% from other races, and 0.59% from two or more races. 0.54% of the population were Hispanic or Latino of any race.
There were 14,880 households out of which 30.50% had children under the age of 18 living with them, 57.00% were married couples living together, 12.60% had a female householder with no husband present, and 26.50% were non-families. 24.00% of all households were made up of individuals and 11.40% had someone living alone who was 65 years of age or older. The average household size was 2.50 and the average family size was 2.95.
In the county, the population was spread out with 22.10% under the age of 18, 9.30% from 18 to 24, 28.00% from 25 to 44, 26.10% from 45 to 64, and 14.50% who were 65 years of age or older. The median age was 39 years. For every 100 females there were 94.20 males. For every 100 females age 18 and over, there were 91.00 males.
The median income for a household in the county was $24,603, and the median income for a family was $29,072. Males had a median income of $31,515 versus $20,212 for females. The per capita income for the county was $14,102. About 20.80% of families and 24.10% of the population were below the poverty line, including 34.60% of those under age 18 and 14.40% of those age 65 or over.
2010 census
As of the 2010 United States Census, there were 36,743 people, 14,907 households, and 10,512 families residing in the county.[11] The population density was 81.0 inhabitants per square mile (31.3/km2). There were 16,743 housing units at an average density of 36.9 per square mile (14.2/km2).[12] The racial makeup of the county was 96.5% white, 2.1% black or African American, 0.3% Asian, 0.1% American Indian, 0.1% from other races, and 0.8% from two or more races. Those of Hispanic or Latino origin made up 0.7% of the population.[11] In terms of ancestry, 16.6% were Irish, 13.3% were German, 7.8% were English, and 6.9% were American.[13]
Of the 14,907 households, 30.1% had children under the age of 18 living with them, 52.7% were married couples living together, 12.5% had a female householder with no husband present, 29.5% were non-families, and 26.1% of all households were made up of individuals. The average household size was 2.43 and the average family size was 2.90. The median age was 42.4 years.[11]
The median income for a household in the county was $35,465 and the median income for a family was $43,475. Males had a median income of $39,462 versus $26,571 for females. The per capita income for the county was $18,614. About 17.6% of families and 21.8% of the population were below the poverty line, including 32.8% of those under age 18 and 7.4% of those age 65 or over.[14]
Politics
Logan County, being historically secessionist[15] and between the New Deal and the 1980s heavily unionized, was once powerfully Democratic. Before the 2008 election, the only Republican to carry the county had been Herbert Hoover in 1928, due to strong anti-Catholicism against Al Smith in this "Bible Belt" region. Logan was the only county in West Virginia to be carried by George McGovern in his disastrous 1972 campaign, and between 1976 and 2000 no Republican reached 40 percent of the county’s vote. Over the past three presidential elections swings to the Republican Party have averaged thirty percentage points and Democratic vote percentages have plummeted to levels historically more typical of unionist, traditionally Republican counties like Grant.
| Year | Republican | Democratic | Third parties |
|---|---|---|---|
| 2016 | 79.6% 9,897 | 16.8% 2,092 | 3.6% 451 |
| 2012 | 68.7% 8,222 | 29.0% 3,469 | 2.4% 281 |
| 2008 | 54.2% 7,326 | 43.4% 5,873 | 2.4% 325 |
| 2004 | 47.0% 7,047 | 52.6% 7,877 | 0.4% 63 |
| 2000 | 36.9% 5,334 | 61.8% 8,927 | 1.2% 178 |
| 1996 | 17.5% 2,627 | 72.0% 10,840 | 10.6% 1,589 |
| 1992 | 20.5% 3,336 | 68.1% 11,095 | 11.5% 1,866 |
| 1988 | 27.2% 4,244 | 72.5% 11,317 | 0.3% 47 |
| 1984 | 37.0% 6,425 | 62.7% 10,892 | 0.4% 65 |
| 1980 | 28.4% 4,945 | 69.0% 12,024 | 2.6% 459 |
| 1976 | 23.5% 4,021 | 76.5% 13,122 | |
| 1972 | 48.7% 9,533 | 51.3% 10,045 | |
| 1968 | 23.4% 4,754 | 67.4% 13,686 | 9.2% 1,861 |
| 1964 | 18.2% 3,776 | 81.8% 16,999 | |
| 1960 | 32.4% 7,836 | 67.6% 16,360 | |
| 1956 | 41.7% 10,588 | 58.3% 14,794 | |
| 1952 | 32.2% 9,148 | 67.9% 19,302 | |
| 1948 | 31.3% 7,362 | 68.4% 16,121 | 0.3% 76 |
| 1944 | 35.3% 8,000 | 64.8% 14,692 | |
| 1940 | 36.7% 9,860 | 63.3% 17,010 | |
| 1936 | 27.7% 7,069 | 72.1% 18,424 | 0.2% 49 |
| 1932 | 45.9% 10,683 | 53.8% 12,529 | 0.3% 71 |
| 1928 | 53.3% 11,404 | 46.5% 9,944 | 0.2% 41 |
| 1924 | 46.9% 7,062 | 49.0% 7,377 | 4.1% 612 |
| 1920 | 43.3% 4,304 | 56.2% 5,588 | 0.4% 44 |
| 1916 | 38.7% 2,107 | 60.1% 3,270 | 1.1% 62 |
| 1912 | 18.4% 518 | 50.0% 1,404 | 31.6% 889 |
Communities
Incorporated communities
- Logan (county seat)
- Chapmanville
- Man
- Mitchell Heights
- West Logan
Unincorporated communities
- Argyle
- Baber
- Baisden
- Banco
- Barnabus
- Becco
- Beebe
- Black Bottom
- Blair
- Bradshaw
- Braeholm
- Chambers
- Christian
- Claypool
- Coal Valley
- Cora
- Craneco
- Crites
- Crooked Creek
- Crown
- Crystal Block
- Dabney
- Daisy
- Davin
- Davis
- Dehue
- Diamond
- Dobra
- Dog Patch
- Don
- Earling
- Emmett
- Ethel
- Fanco
- Five Block
- Fort Branch
- Freeze Fork
- Frogtown
- Gillman Bottom
- Godby Heights
- Greenville
- Guyan Terrace
- Halcyon
- Hedgeview
- Hensley Heights
- Hetzel
- Huff Junction
- Hutchinson
- Isom
- Justice Addition
- Kelly
- Kitchen
- Lake
- Landville
- Latrobe
- Lintz Addition
- Logan Heights
- Lorado
- Lundale
- Lyburn
- Melville
- Micco
- Mifflin
- Mineral City
- Monclo
- Monitor
- Mountain View
- Oilville
- Orville
- Pardee
- Peach Creek
- Pecks Mill
- Phico
- Pine Creek
- Ralumco
- Red Campbell
- Ridgeview
- Rita
- Rum Junction
- Saunders
- Sharples
- Shegon
- Shively
- Slagle
- Sodom
- Sovereign
- Spruce Valley
- Stirrat
- Stone Branch
- Stowe
- Sulphur Springs
- Sunbeam
- Sunset Court
- Superior Bottom
- Sycamore
- Taplin
- Thompson Town
- Trace Junction
- Troy Town
- Upper Whitman
- Verner
- Walnut Hill
- Wanda
- Whirlwind
- Whites Addition
- Whitman
- Whitman Junction
- Wilkinson
- Wylo
- Yolyn
Other designated places
Census-designated places
School Districts
- Logan County Schools (consolidated, county-wide)
Postal Districts
(by Zip Code, in numerical order):
- 25022
- 25047
- 25076
- 25121
- 25183
- 25505
- 25508
- 25547
- 25601
- 25606
- 25607
- 25611
- 25612
- 25614
- 25617
- 25624
- 25625
- 25628
- 25630
- 25632
- 25634
- 25635
- 25637
- 25638
- 25639
- 25644
- 25646
- 25647
- 25649
- 25652
- 25653
- 25654
See also
References
- 1 2 "State & County QuickFacts". United States Census Bureau. Archived from the original on July 14, 2011. Retrieved January 10, 2014.
- ↑ "Find a County". National Association of Counties. Retrieved 2011-06-07.
- ↑ "Archived copy". Archived from the original on 2001-09-23. Retrieved 2013-02-04.
- ↑ "2010 Census Gazetteer Files". United States Census Bureau. August 22, 2012. Retrieved July 24, 2015.
- ↑ "Population and Housing Unit Estimates". Retrieved June 9, 2017.
- ↑ "U.S. Decennial Census". United States Census Bureau. Retrieved January 10, 2014.
- ↑ "Historical Census Browser". University of Virginia Library. Retrieved January 10, 2014.
- ↑ "Population of Counties by Decennial Census: 1900 to 1990". United States Census Bureau. Retrieved January 10, 2014.
- ↑ "Census 2000 PHC-T-4. Ranking Tables for Counties: 1990 and 2000" (PDF). United States Census Bureau. Retrieved January 10, 2014.
- ↑ "American FactFinder". United States Census Bureau. Retrieved 2011-05-14.
- 1 2 3 "DP-1 Profile of General Population and Housing Characteristics: 2010 Demographic Profile Data". United States Census Bureau. Retrieved 2016-04-03.
- ↑ "Population, Housing Units, Area, and Density: 2010 - County". United States Census Bureau. Retrieved 2016-04-03.
- ↑ "DP02 SELECTED SOCIAL CHARACTERISTICS IN THE UNITED STATES – 2006-2010 American Community Survey 5-Year Estimates". United States Census Bureau. Retrieved 2016-04-03.
- ↑ "DP03 SELECTED ECONOMIC CHARACTERISTICS – 2006-2010 American Community Survey 5-Year Estimates". United States Census Bureau. Retrieved 2016-04-03.
- ↑ Hinkle, Harlan H.; Grayback Mountaineers: The Confederate Face of Western Virginia, pp. 189–190 ISBN 0595268404
- ↑ Leip, David. "Dave Leip's Atlas of U.S. Presidential Elections". uselectionatlas.org. Retrieved 2018-03-27.
External links
- Earl Dotter, "Coalfield Generations: Health, Mining, and the Environment," Southern Spaces 16 July 2008. http://southernspaces.org/2008/coalfield-generations-health-mining-and-environment
- Logan County Chamber of Commerce
- Logan County Schools
- Logan County WVGenWeb
- Logan Coalfield
- The Logan Banner - daily newspaper.
- Blair Community Center and Museum to visit a museum focused on the largest labor battle in the United States as well as the heritage of local coal-mining communities.
Places adjacent to Logan County, West Virginia | ||||||||||
|---|---|---|---|---|---|---|---|---|---|---|
| ||||||||||