Demographics of Egypt
| This article is part of a series on |
| Life in Egypt |
|---|
| Culture |
|
| Society |
| Politics |
| Economy |
|
Egypt portal |
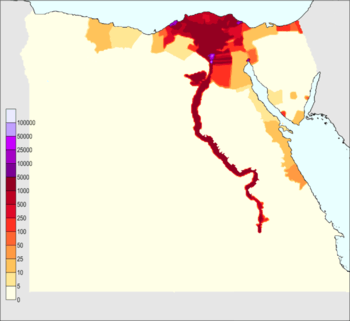
Egypt is the most populous country in the Arabic speaking world and the third-most populous on the African continent (after Nigeria and Ethiopia). About 95%[1] of the country's 97 million people (2017)[2] live along the banks of the Nile and in the Nile Delta, which fans out north of Cairo; and along the Suez Canal. These regions are among the world's most densely populated, containing an average of over 1,540 per km², as compared to 96 persons per km² for the country as a whole.
Small communities spread throughout the desert regions of Egypt are clustered around historic trade and transportation routes. The government has tried with mixed success to encourage migration to newly irrigated land reclaimed from the desert. However, the proportion of the population living in rural areas has continued to decrease as people move to the megacities in search of employment and a higher standard of living.
According to the Peterson Institute for International Economics and other proponents of demographic structural approach (cliodynamics), the basic problem Egypt has an unemployment rate driven by a demographic youth bulge: with the number of new people entering the job force at about 4% a year, unemployment in Egypt is almost 10 times as high for college graduates as it is for people who have gone through elementary school, particularly educated urban youth, who comprised most of the people that were seen out in the streets during the Egyptian Revolution of 2011. An estimated 75% of Egyptians are under the age of 25 with just 3% over the age of 65, making it one of the most youthful populations in the world.[3][4]
Population
Egypt has a population of 92,000,000.1 (2016, rounded to 1 d.p.).[5][6] According to the OECD/World Bank statistics population growth in Egypt from 1990 to 2008 was 23.7 million and 41%.[7] In 2020 the population is expected to grow by 20%.
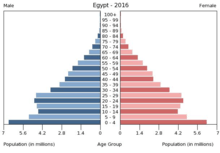
Age distribution
Data taken from Central Agency for Public Mobilization and Statistics.[8]
Percentage Distribution of Population in Censuses by Age Group
| Age group | 2006 | 1996 | 1986 | 1976 |
|---|---|---|---|---|
| 0-4 | 10.6 | 11.6 | 15.3 | 13.9 |
| 5-9 | 10.5 | 12.9 | 13.2 | 12.8 |
| 10-14 | 10.6 | 13.3 | 11.6 | 13.4 |
| 15-19 | 11.8 | 11.6 | 10.6 | 10.9 |
| 20-24 | 10.8 | 8.6 | 8.9 | 8.4 |
| 25-29 | 8.8 | 7.4 | 7.7 | 7.3 |
| 30-34 | 6.5 | 6.7 | 6.4 | 5.8 |
| 35-39 | 6.4 | 6.5 | 6.1 | 5.6 |
| 40-44 | 5.6 | 5.3 | 4.4 | 5.1 |
| 45-49 | 5.1 | 4.5 | 4.0 | 4.2 |
| 50-54 | 4.2 | 3.4 | 3.5 | 4.0 |
| 55-59 | 3.1 | 2.5 | 2.6 | 2.4 |
| 60-64 | 2.3 | 2.4 | 2.4 | 2.7 |
| 65-69 | 1.6 | 1.6 | 1.4 | 1.4 |
| 70-74 | 1.1 | 1.0 | 1.1 | 1.2 |
| 75+ | 1.0 | 0.8 | 0.8 | 1.0 |
Population Estimates by Sex and Age Group (1 July 2010) :
| Age group | Male | Female | % | Total |
|---|---|---|---|---|
| 0-4 | 4,282 | 4,072 | 10.6 | 8,354 |
| 5-9 | 4,265 | 4,007 | 10.5 | 8,272 |
| 10-14 | 4,330 | 4,023 | 10.6 | 8,353 |
| 15-19 | 4,738 | 4,501 | 11.7 | 9,239 |
| 20-24 | 4,358 | 4,155 | 10.8 | 8,513 |
| 25-29 | 3,412 | 3,498 | 8.8 | 6,910 |
| 30-34 | 2,614 | 2,503 | 6.5 | 5,117 |
| 35-39 | 2,498 | 2,536 | 6.4 | 5,034 |
| 40-44 | 2,237 | 2,186 | 5.6 | 4,423 |
| 45-49 | 2,029 | 1,942 | 5.0 | 3,971 |
| 50-54 | 1,668 | 1,640 | 4.2 | 3,308 |
| 55-59 | 1,312 | 1,136 | 3.1 | 2,448 |
| 60-64 | 971 | 871 | 2.3 | 1 842 |
| 65-69 | 693 | 597 | 1.6 | 1 290 |
| 70-74 | 435 | 419 | 1.1 | 854 |
| 75+ | 408 | 392 | 1.0 | 800 |
| Total | 40,250 | 38,478 | 100 | 78,728 |
Population Estimates by Sex and Age Group (1 July 2012) :
| Age group | Male | Female | % | Total |
|---|---|---|---|---|
| 0-4 | 4,780 | 4,410 | 11.17 | 9,190 |
| 5-9 | 4,534 | 4,192 | 10.60 | 8,726 |
| 10-14 | 3,970 | 3,706 | 9.33 | 7,676 |
| 15-19 | 3,970 | 3,746 | 9.37 | 7,710 |
| 20-24 | 4,236 | 4,024 | 10.04 | 8,260 |
| 25-29 | 4,084 | 3,924 | 9.73 | 8,008 |
| 30-34 | 3,346 | 3,249 | 8.01 | 6,595 |
| 35-39 | 2,589 | 2,524 | 6.21 | 5,113 |
| 40-44 | 2,262 | 2,206 | 5.43 | 4,468 |
| 45-49 | 2,077 | 2,037 | 5.00 | 4,114 |
| 50-54 | 1,821 | 1,798 | 4.40 | 3,619 |
| 55-59 | 1,494 | 1,480 | 3.61 | 2,974 |
| 60-64 | 1,105 | 1,113 | 2.69 | 2,218 |
| 65-69 | 767 | 785 | 1.89 | 1,552 |
| 70-74 | 501 | 517 | 1.24 | 1,018 |
| 75+ | 522 | 536 | 1.29 | 1,058 |
| Total | 42,058 | 40,247 | 100 | 82,305 |
Population Estimates by Sex and Age Group (1 January 2013) :
| Age group | Male | Female | % | Total |
|---|---|---|---|---|
| 0-4 | 4,861 | 4,481 | 11.17 | 9,342 |
| 5-9 | 4,610 | 4,259 | 10.60 | 8,869 |
| 10-14 | 4,038 | 3,765 | 9.33 | 7,803 |
| 15-19 | 4,038 | 3,805 | 9.37 | 7,843 |
| 20-24 | 4,309 | 4,089 | 10.04 | 8,398 |
| 25-29 | 4,152 | 3,987 | 9.73 | 8,139 |
| 30-34 | 3,403 | 3,300 | 8.01 | 6,703 |
| 35-39 | 2,633 | 2,564 | 6.21 | 5,197 |
| 40-44 | 2,300 | 2,241 | 5.43 | 4,541 |
| 45-49 | 2,113 | 2,069 | 5.00 | 4,182 |
| 50-54 | 1,852 | 1,827 | 4.40 | 3,679 |
| 55-59 | 1,519 | 1,504 | 3.61 | 3,023 |
| 60-64 | 1,124 | 1,130 | 2.69 | 2,254 |
| 65-69 | 781 | 797 | 1.89 | 1,578 |
| 70-74 | 510 | 525 | 1.24 | 1,035 |
| 75-79 | 291 | 303 | 0.71 | 594 |
| 80+ | 239 | 242 | 0.57 | 481 |
| Total | 42,773 | 40,888 | 100 | 83,661 |
Population Estimates by Sex and Age Group (1 July 2013):
| Age Group | Male | Female | Total | % |
|---|---|---|---|---|
| 0-4 | 4 910 594 | 4 538 740 | 9 449 334 | 11,17 |
| 5-9 | 4 657 900 | 4 313 848 | 8 971 748 | 10,60 |
| 10-14 | 4 079 894 | 3 812 951 | 7 892 845 | 9,33 |
| 15-19 | 4 079 894 | 3 853 840 | 7 933 634 | 9,37 |
| 20-24 | 4 353 289 | 4 140 279 | 8 493 568 | 10,04 |
| 25-29 | 4 195 561 | 4 037 843 | 8 233 404 | 9,73 |
| 30-34 | 3 438 467 | 3 342 721 | 6 781 188 | 8,01 |
| 35-39 | 2 660 343 | 2 596 487 | 5 256 830 | 6,21 |
| 40-44 | 2 323 857 | 2 269 370 | 4 593 227 | 5,43 |
| 45-49 | 2 134 584 | 2 095 590 | 4 230 173 | 5,00 |
| 50-54 | 1 871 704 | 1 850 252 | 3 721 956 | 4,40 |
| 55-59 | 1 535 218 | 1 523 136 | 3 058 354 | 3,61 |
| 60-64 | 1 135 641 | 1 144 907 | 2 280 548 | 2,69 |
| 65-69 | 788 639 | 807 569 | 1 596 208 | 1,89 |
| 70-74 | 515 244 | 531 564 | 1 046 809 | 1,24 |
| 75-79 | 294 425 | 306 672 | 601 097 | 0,71 |
| 80+ | 241 849 | 246 108 | 487 957 | 0,58 |
| Total | 43 217 105 | 41 411 877 | 84 628 982 | 100 |
| Age group | Male | Female | Total | Percent |
|---|---|---|---|---|
| 0-14 | 13 648 388 | 12 665 539 | 26 313 927 | 31,09 |
| 15-64 | 27 728 560 | 26 854 425 | 54 582 985 | 64,50 |
| 65+ | 1 840 157 | 1 891 913 | 3 732 070 | 4,41 |
Population Estimates by Sex and Age Group (1 July 2014) in thousands:
| Age Group | Male | Female | Total | % |
|---|---|---|---|---|
| 0-4 | 5 102 | 4 728 | 9 830 | 11,3 |
| 5-9 | 4 729 | 4 398 | 9 127 | 10,5 |
| 10-14 | 4 225 | 3 959 | 8 184 | 9,4 |
| 15-19 | 4 312 | 4 077 | 8 389 | 9,7 |
| 20-24 | 4 565 | 4 365 | 8 930 | 10,4 |
| 25-29 | 4 280 | 4 119 | 8 399 | 9,7 |
| 30-34 | 3 413 | 3 319 | 6 732 | 7,8 |
| 35-39 | 2 678 | 2 604 | 5 282 | 6,1 |
| 40-44 | 2 391 | 2 349 | 4 740 | 5,5 |
| 45-49 | 2 194 | 2 156 | 4 350 | 5,0 |
| 50-54 | 1 898 | 1 877 | 3 775 | 4,3 |
| 55-59 | 1 547 | 1 536 | 3 083 | 3,6 |
| 60-64 | 1 130 | 1 131 | 2 261 | 2,6 |
| 65-69 | 789 | 801 | 1 590 | 1,8 |
| 70-74 | 515 | 535 | 1 050 | 1,2 |
| 75+ | 537 | 555 | 1 092 | 1,3 |
| Total | 44 305 | 42 509 | 86 814 | 100 |
| Age group | Sex ratio | Male | Female | Total | Percent |
|---|---|---|---|---|---|
| 0-14 | 107.4 | 14 056 | 13 085 | 27 141 | 31,26 |
| 15-39 | 104.1 | 19 248 | 18 484 | 37 732 | 43,46 |
| 40-64 | 101.2 | 9 160 | 9 049 | 18 209 | 20,97 |
| 65+ | 97.4 | 1 841 | 1 891 | 3 732 | 4,30 |
Household population by age and sex (DHS 2014).[9]
Total Population in thousands: 114 428 (Males 56 926, Females 57 501)
| Age Group | Male (%) | Female (%) | Total (%) |
|---|---|---|---|
| 0-4 | 14,1 | 12,6 | 13,4 |
| 5-9 | 12,1 | 11,1 | 11,6 |
| 10-14 | 10,7 | 9,9 | 10,3 |
| 15-19 | 9,1 | 9,0 | 9,1 |
| 20-24 | 7,8 | 8,6 | 8,2 |
| 25-29 | 8,2 | 9,4 | 8,8 |
| 30-34 | 7,0 | 7,7 | 7,3 |
| 35-39 | 5,9 | 6,2 | 6,0 |
| 40-44 | 4,8 | 5,1 | 4,9 |
| 45-49 | 4,7 | 4,7 | 4,7 |
| 50-54 | 4,2 | 4,5 | 4,4 |
| 55-59 | 3,4 | 3,7 | 3,5 |
| 60-64 | 3,4 | 3,3 | 3,4 |
| 65-69 | 2,0 | 1,9 | 1,9 |
| 70-74 | 1,4 | 1,3 | 1,3 |
| 75-79 | 0,6 | 0,5 | 0,5 |
| 80+ | 0,5 | 0,6 | 0,6 |
| Age group | Male (%) | Female (%) | Total (%) |
|---|---|---|---|
| 0-14 | 36,9 | 33,6 | 35,3 |
| 15-64 | 58,6 | 62,1 | 60,4 |
| 65+ | 4,5 | 4,3 | 4,3 |

| Historical Population Over Time | ||
|---|---|---|
| Year | Pop. | ±% p.a. |
| 1 | 4,000,000 | — |
| 1000 | 8,000,000 | +0.07% |
| 1500 | 7,300,000 | −0.02% |
| 1805 | 4,000,000 | −0.20% |
| 1882 | 6,712,000 | +0.67% |
| 1897 | 9,669,000 | +2.46% |
| 1907 | 11,190,000 | +1.47% |
| 1917 | 12,718,000 | +1.29% |
| 1927 | 14,178,000 | +1.09% |
| 1937 | 15,921,000 | +1.17% |
| 1947 | 18,967,000 | +1.77% |
| 1960 | 26,085,000 | +2.48% |
| 1966 | 30,076,000 | +2.40% |
| 1976 | 36,626,000 | +1.99% |
| 1986 | 48,254,000 | +2.80% |
| 1996 | 59,312,000 | +2.08% |
| 2006 | 72,798,000 | +2.07% |
| 2017 | 93,287,000 | +2.28% |
| Source: Population in Egypt[10] | ||
Population Estimates by Sex and Age Group (1 January 2015):
| Age Group | Male | Female | Total | % |
|---|---|---|---|---|
| 0-4 | 5 168 230 | 4 791 812 | 9 960 042 | 11,3 |
| 5-9 | 4 790 338 | 4 456 493 | 9 246 831 | 10,5 |
| 10-14 | 4 279 072 | 4 013 008 | 8 292 080 | 9,4 |
| 15-19 | 4 367 988 | 4 131 991 | 8 499 979 | 9,7 |
| 20-24 | 4 623 621 | 4 424 043 | 9 047 664 | 10,3 |
| 25-29 | 4 334 645 | 4 175 258 | 8 509 903 | 9,7 |
| 30-34 | 3 456 601 | 3 364 004 | 6 820 605 | 7,8 |
| 35-39 | 2 711 932 | 2 639 282 | 5 351 214 | 6,1 |
| 40-44 | 2 422 954 | 2 379 682 | 4 802 636 | 5,5 |
| 45-49 | 2 222 893 | 2 184 980 | 4 407 873 | 5,0 |
| 50-54 | 1 922 803 | 1 903 745 | 3 826 548 | 4,4 |
| 55-59 | 1 567 139 | 1 557 610 | 3 124 749 | 3,6 |
| 60-64 | 1 144 789 | 1 146 574 | 2 291 363 | 2,6 |
| 65-69 | 800 241 | 811 254 | 1 611 495 | 1,8 |
| 70-74 | 522 379 | 540 837 | 1 063 216 | 1,2 |
| 75+ | 544 608 | 562 470 | 1 107 078 | 1,3 |
| Total | 44 880 233 | 43 083 043 | 87 963 276 | 100 |
| Age group | Male | Female | Total | Percent |
|---|---|---|---|---|
| 0-14 | 14 237 640 | 13 261 313 | 27 498 953 | 31,26 |
| 15-64 | 28 775 365 | 27 907 169 | 56 682 534 | 64,44 |
| 65+ | 1 867 228 | 1 914 561 | 3 781 789 | 4,30 |
Historical and Present Population Distribution:
| Age group | 2015/01/01 | 2013/07/01 | 2013/01/01 | 2012/07/01 | 2010/07/01 | 2006 | 1996 | 1986 | 1976 |
|---|---|---|---|---|---|---|---|---|---|
| 0-14 | 31.26 (27,498,953) | 31.09 (26,313,927) | 31.1 (26,014,000) | 31.1 (25,592,000) | 31.7 (24,979,000) | 31.7 | 37.8 | 40.1 | 40 |
| 15-64 | 64.44 (56,682,534) | 64.50 (54,582,985) | 64.49 (53,959,000) | 64.48 (53,085,000) | 64.6 (50,805,000) | 64.6 | 58.7 | 56.6 | 56.4 |
| 65+ | 4.30 (3,781,789) | 4.41 (3,732,070) | 4.41 (3,688,000) | 4.42 (3,628,000) | 3.7 (2,944,000) | 3.7 | 3.5 | 3.3 | 3.6 |
Egyptians abroad
According to the International Organization for Migration, an estimated 2.7 million Egyptians live abroad and contribute actively to the development of their country through remittances (US$7.8 billion in 2009), circulation of human and social capital, as well as investment. Approximately 70% of Egyptian migrants live in Arab countries (923,600 in Saudi Arabia, 332,600 in Libya, 226,850 in Jordan, 190,550 in Kuwait with the rest elsewhere in the region) and the remaining 30% are living mostly North America (318,000 in the United States, 110,000 in Canada) and Europe (90,000 in Italy).[11]
Urban and Rural Population
Figures from CAPMAS:[12]
| Midyear
Population |
Urban Population (in thousands) | Urban Population (per cent) | Rural Population (in thousands) | Rural Population (per cent) | |
|---|---|---|---|---|---|
| 1990 | 51 911 | 22 519 | 43.4 | 29 392 | 56.6 |
| 1991 | 52 985 | 22 908 | 43.2 | 30 077 | 56.8 |
| 1992 | 54 082 | 23 366 | 43.2 | 30 716 | 56.8 |
| 1993 | 55 201 | 23 804 | 43.1 | 31 397 | 56.9 |
| 1994 | 56 344 | 24 276 | 43.1 | 32 068 | 56.9 |
| 1995 | 57 642 | 24 709 | 42.9 | 32 933 | 57.1 |
| 1996 | 58 835 | 25 053 | 42.6 | 33 782 | 57.4 |
| 1997 | 60 053 | 25 578 | 42.6 | 34 475 | 57.4 |
| 1998 | 61 296 | 26 104 | 42.6 | 35 192 | 57.4 |
| 1999 | 62 565 | 26 559 | 42.5 | 36 006 | 57.5 |
| 2000 | 63 860 | 27 132 | 42.5 | 36 728 | 57.5 |
| 2001 | 65 182 | 28 118 | 43.1 | 37 064 | 56.9 |
| 2002 | 66 628 | 28 554 | 42.9 | 38 074 | 57.1 |
| 2003 | 67 965 | 29 130 | 42.9 | 38 835 | 57.1 |
| 2004 | 69 304 | 29 653 | 42.8 | 39 651 | 57.2 |
| 2005 | 70 653 | 30 187 | 42.7 | 40 466 | 57.3 |
| 2006 | 72 009 | 30 585 | 42.5 | 41 424 | 57.5 |
| 2007 | 73 644 | 31 720 | 43.1 | 41 924 | 56.9 |
| 2008 | 75 194 | 32 249 | 42.9 | 42 945 | 57.1 |
| 2009 | 76 925 | 33 083 | 43.0 | 43 842 | 57.0 |
| 2010 | 78 685 | 33 804 | 43.0 | 44 881 | 57.0 |
| 2011 | 80 530 | 34 489 | 42.8 | 46 041 | 57.2 |
| 2012 | 82 550 | 35 373 | 42.9 | 47 177 | 57.1 |
| 2013 | 84 629 | 36 213 | 42.8 | 48 416 | 57.2 |
| 2014 | 86 814 | 37 095 | 42.7 | 49 719 | 57.3 |
Future Population Projections
The Central Agency for Public Mobilization and Statistics (CAPMAS) had released high/medium/low population projections for 2011-2031 based on Final Results of 2006 Population Census.[12] The 2020 high variant was 92.6 million, the medium - 91.0 million, the low - 90.0 million. The 2030 high variant is 104.4 million, the medium - 101.7 million, the low - 99.8 million. However the information could be misleading as the 2013 population figure of 84.6 million is higher than the projected high of 83 million. In fact, due to an unexpected rise in the fertility rate (from 3.0 to 3.5), the population already surpassed 91 million on 5 June 2016 while reaching 92 million on 30 November, average population age remaining stable despite a rising life expectancy.
Vital statistics
| Midyear population (x 1000) | Live births | Deaths | Natural change | Crude birth rate (per 1000) | Crude death rate (per 1000) | Natural change (per 1000) | Total fertility rate | |
|---|---|---|---|---|---|---|---|---|
| 1934 | 15,449 | 651,663 | 429,851 | 221,812 | 42.2 | 27.8 | 14.4 | |
| 1935 | 15,624 | 645,760 | 412,197 | 233,563 | 41.3 | 26.4 | 14.9 | |
| 1936 | 15,801 | 698,186 | 455,832 | 242,354 | 44.2 | 28.8 | 15.3 | |
| 1937 | 16,009 | 694,086 | 434,208 | 259,878 | 43.4 | 27.1 | 16.2 | |
| 1938 | 16,300 | 704,376 | 429,248 | 275,128 | 43.2 | 26.3 | 16.9 | |
| 1939 | 16,598 | 696,746 | 429,033 | 267,713 | 42.0 | 25.8 | 16.1 | |
| 1940 | 16,900 | 697,700 | 444,448 | 253,252 | 41.3 | 26.3 | 15.0 | |
| 1941 | 17,208 | 695,016 | 440,981 | 254,035 | 40.4 | 25.6 | 14.8 | |
| 1942 | 17,522 | 658,324 | 494,358 | 163,966 | 37.6 | 28.2 | 9.4 | |
| 1943 | 17,842 | 689,771 | 492,644 | 197,127 | 38.7 | 27.6 | 11.0 | |
| 1944 | 18,167 | 722,166 | 472,234 | 249,932 | 39.8 | 26.0 | 13.8 | |
| 1945 | 18,498 | 787,502 | 512,003 | 275,499 | 42.6 | 27.7 | 14.9 | |
| 1946 | 18,835 | 776,000 | 484,000 | 292,000 | 41.2 | 25.7 | 15.5 | |
| 1947 | 19,197 | 834,557 | 408,577 | 425,980 | 43.5 | 21.3 | 22.2 | |
| 1948 | 19,529 | 832,728 | 397,976 | 434,752 | 42.6 | 20.4 | 22.3 | |
| 1949 | 19 989 | 831,310 | 410,524 | 420,786 | 41.6 | 20.5 | 21.1 | |
| 1950 | 21,514 | 904,941 | 388,944 | 515,997 | 44.2 | 19.0 | 25.2 | |
| 1951 | 22,020 | 934,584 | 402,158 | 532,426 | 44.6 | 19.2 | 25.4 | |
| 1952 | 22,562 | 969,443 | 380,633 | 588,810 | 45.2 | 17.8 | 27.5 | |
| 1953 | 23,138 | 934,830 | 429,097 | 505,733 | 42.6 | 19.6 | 23.0 | |
| 1954 | 23,747 | 957,158 | 401,306 | 555,852 | 42.6 | 17.9 | 24.7 | |
| 1955 | 24,387 | 926,500 | 405,663 | 520,837 | 40.3 | 17.6 | 22.7 | |
| 1956 | 25,057 | 958,880 | 384,974 | 573,906 | 40.7 | 16.4 | 24.4 | |
| 1957 | 25,756 | 914,494 | 429,512 | 484,982 | 38.0 | 17.8 | 20.1 | |
| 1958 | 26,480 | 1,013,743 | 409,197 | 604,546 | 41.1 | 16.6 | 24.5 | |
| 1959 | 27,228 | 1,078,947 | 411,188 | 667,759 | 42.8 | 16.3 | 26.5 | |
| 1960 | 27,998 | 1,113,888 | 437,822 | 676,066 | 43.0 | 16.9 | 26.1 | |
| 1961 | 28,786 | 1,166,620 | 420,158 | 746,462 | 43.9 | 15.8 | 28.1 | |
| 1962 | 29,591 | 1,125,798 | 486,699 | 639,099 | 41.3 | 17.9 | 23.4 | |
| 1963 | 30,410 | 1,196,388 | 431,673 | 764,715 | 42.8 | 15.4 | 27.4 | |
| 1964 | 31,242 | 1,205,785 | 449,375 | 756,410 | 42.1 | 15.7 | 26.4 | |
| 1965 | 32,084 | 1,220,658 | 411,636 | 809,022 | 41.5 | 14.0 | 27.5 | |
| 1966 | 32,937 | 1,234,976 | 477,021 | 757,955 | 41.0 | 15.8 | 25.1 | |
| 1967 | 33,799 | 1,210,214 | 440,161 | 770,053 | 39.2 | 14.2 | 24.9 | |
| 1968 | 34,660 | 1,206,585 | 509,430 | 697,155 | 38.1 | 16.1 | 22.0 | |
| 1969 | 35,511 | 1,197,245 | 468,017 | 729,228 | 36.8 | 14.4 | 22.4 | |
| 1970 | 36,342 | 1,161,539 | 500,626 | 660,913 | 34.9 | 15.0 | 19.8 | |
| 1971 | 37,152 | 1,186,350 | 445,192 | 741,158 | 34.8 | 13.1 | 21.8 | |
| 1972 | 37,945 | 1,187,286 | 499,628 | 687,658 | 34.1 | 14.3 | 19.7 | |
| 1973 | 38,734 | 1,259,004 | 459,816 | 799,188 | 35.3 | 12.9 | 22.4 | |
| 1974 | 39,534 | 1,287,614 | 457,620 | 829,994 | 35.4 | 12.6 | 22.8 | |
| 1975 | 40,359 | 1,331,799 | 456,041 | 875,758 | 36.0 | 12.3 | 23.7 | |
| 1976 | 41,213 | 1,378,917 | 444,228 | 934,689 | 36.4 | 11.7 | 24.7 | |
| 1977 | 42,094 | 1,447,402 | 457,558 | 989,844 | 37.3 | 11.8 | 25.5 | |
| 1978 | 43,006 | 1,479,698 | 415,605 | 1,064,093 | 37.2 | 10.5 | 26.8 | |
| 1979 | 43 951 | 1,633,674 | 444,753 | 1,188,921 | 40.0 | 10.9 | 29.1 | |
| 1980 | 44,932 | 1,569,247 | 421,227 | 1,148,020 | 37.3 | 10.0 | 27.3 | 5.3 |
| 1981 | 45 946 | 1,593,698 | 432,264 | 1,161,434 | 36.8 | 10.0 | 26.8 | |
| 1982 | 46,991 | 1,601,265 | 441,621 | 1,159,644 | 34.1 | 9.4 | 24.7 | |
| 1983 | 48,072 | 1,666,915 | 412,700 | 1,254,215 | 34.7 | 8.6 | 26.1 | |
| 1984 | 49,190 | 1,797,206 | 400,600 | 1,396,606 | 36.5 | 8.1 | 28.4 | 4.9 |
| 1985 | 50,347 | 1,903,022 | 442,258 | 1,460,764 | 37.8 | 8.8 | 29.0 | |
| 1986 | 51 545 | 1,907,975 | 455,888 | 1,452,087 | 37.0 | 8.8 | 28.2 | |
| 1987 | 52 777 | 1,902,604 | 466,161 | 1,436,443 | 36.0 | 8.8 | 27.2 | |
| 1988 | 54,011 | 1,912,765 | 427,018 | 1,485,747 | 35.4 | 7.9 | 27.5 | 4.4 |
| 1989 | 55,207 | 1,722,934 | 414,214 | 1,308,720 | 31.2 | 7.5 | 23.7 | |
| 1990 | 51,911 | 1,687,000 | 393,250 | 1,293,750 | 32.5 | 7.6 | 24.9 | |
| 1991 | 52,985 | 1,636,551 | 391,588 | 1,244,963 | 30.9 | 7.4 | 23.5 | 4.1 |
| 1992 | 54,082 | 1,496,866 | 382,465 | 1,114,401 | 27.7 | 7.1 | 20.6 | |
| 1993 | 55,201 | 1,600,549 | 380,000 | 1,220,549 | 29.0 | 6.9 | 22.1 | |
| 1994 | 56 344 | 1,610,652 | 385,296 | 1,225,356 | 28.6 | 6.8 | 21.7 | |
| 1995 | 57,642 | 1,604,835 | 384,548 | 1,220,287 | 27.8 | 6.7 | 21.2 | 3.6 |
| 1996 | 58 835 | 1,662,065 | 379,983 | 1,282,082 | 28.2 | 6.5 | 21.8 | |
| 1997 | 60,053 | 1,654,695 | 389,301 | 1,265,394 | 27.6 | 6.5 | 21.1 | 3.3 |
| 1998 | 61,296 | 1,687,252 | 399,772 | 1,287,480 | 27.5 | 6.5 | 21.0 | 3.4 |
| 1999 | 62,565 | 1,693,025 | 401,433 | 1,291,592 | 27.1 | 6.4 | 20.6 | |
| 2000 | 63,860 | 1,751,854 | 404,699 | 1,347,155 | 27.4 | 6.3 | 21.1 | 3.5 |
| 2001 | 65,182 | 1,741,308 | 404,531 | 1,336,777 | 26.7 | 6.2 | 20.5 | |
| 2002 | 66,628 | 1,766,589 | 424,034 | 1,342,555 | 26.5 | 6.4 | 20.2 | |
| 2003 | 67,965 | 1,777,418 | 440,149 | 1,337,269 | 26.2 | 6.5 | 19.7 | 3.2 |
| 2004 | 69,304 | 1,779,500 | 440,790 | 1,338,710 | 25.7 | 6.4 | 19.3 | |
| 2005 | 70,653 | 1,800,972 | 450,646 | 1,350,326 | 25.5 | 6.4 | 19.1 | 3.1 |
| 2006 | 72,009 | 1,853,746 | 451,863 | 1,401,883 | 25.7 | 6.3 | 19.5 | |
| 2007 | 73,644 | 1,949,569 | 450,596 | 1,498,973 | 26.5 | 6.1 | 20.4 | |
| 2008 | 75 194 | 2,050,704 | 461,934 | 1,588,770 | 27.4 | 5.9 | 21.5 | 3.0 |
| 2009 | 76,925 | 2,217,409 | 476,592 | 1,740,817 | 28.8 | 6.2 | 22.6 | |
| 2010 | 78,685 | 2,261,409 | 483,385 | 1,778,024 | 28.7 | 6.1 | 22.6 | |
| 2011 | 80,530 | 2,442,094 | 493,086 | 1,949,008 | 30.3 | 6.1 | 24.2 | |
| 2012 | 82,550 | 2,629,769 | 529,247 | 2,100,522 | 31.9 | 6.4 | 25.5 | |
| 2013 | 84,629 | 2,621,902 | 511,000 | 2,110,719 | 31.0 | 6.0 | 25.0 | |
| 2014 | 86,814 | 2,720,495 | 531,864 | 2,188,631 | 31.3 | 6.1 | 25.2 | 3.5 |
| 2015 | 89,279 | 2,685,276 | 573,129 | 2,123,102 | 30.2 | 6.5 | 23.7 | |
| 2016 | 92,216 | 2,600,173 | 556,148 | 2,044,025 | 28.6 | 6.1 | 22.5 | |
| 2017 | 94,190 | 2,501,150 | 528,150 | 1,971,115 | 26.6 | 5.6 | 21.0 | 3.1 |
Source: Central Agency for Public Mobilization and Statistics (CAPMAS)[16]
Fertility Rate (The Demographic Health Survey)
Fertility Rate (TFR) (Wanted Fertility Rate) and CBR (Crude Birth Rate):[17]
| Year | CBR (Total) | TFR (Total) | CBR (Urban) | TFR (Urban) | CBR (Rural) | TFR (Rural) |
|---|---|---|---|---|---|---|
| 1992 | 29,7 | 3,93 (2,7) | 23,3 | 2,92 (2,0) | 35,0 | 4,91 (3,4) |
| 1995 | 28,0 | 3,63 (2,6) | 23,9 | 3,01 (2,2) | 31,4 | 4,19 (2,9) |
| 1997 | 3,3 | 2,7 | 3,7 | |||
| 1998 | 27 | 3,4 | 23 | 2,8 | 31 | 3,9 |
| 2000 | 27,8 | 3,53 (2,9) | 24,8 | 3,09 (2,6) | 30,1 | 3,88 (3,1) |
| 2003 | 26,3 | 3,2 (2,5) | 21,7 | 2,6 (2,1) | 29,8 | 3,6 (2,9) |
| 2005 | 27,1 | 3,1 (2,3) | 23,6 | 2,7 (2,1) | 29,6 | 3,4 (2,5) |
| 2008 | 26,6 | 3,0 (2,4) | 23,3 | 2,7 (2,2) | 29,1 | 3,2 (2,5) |
| 2014 | 29,1 | 3,5 (2,8) | 23,3 | 2,9 (2,4) | 32,7 | 3,8 (3,0) |
Life expectancy at birth
Average Life expectancy at age 0 of the total population.[18]
| Period | Life expectancy in Years |
Period | Life expectancy in Years |
|---|---|---|---|
| 1950–1955 | 41.1 | 1985–1990 | 63.5 |
| 1955–1960 | 46.4 | 1990–1995 | 65.4 |
| 1960–1965 | 49.3 | 1995–2000 | 68.0 |
| 1965–1970 | 51.6 | 2000–2005 | 69.0 |
| 1970–1975 | 53.0 | 2005–2010 | 69.9 |
| 1975–1980 | 56.8 | 2010–2015 | 70.8 |
| 1980–1985 | 59.9 |
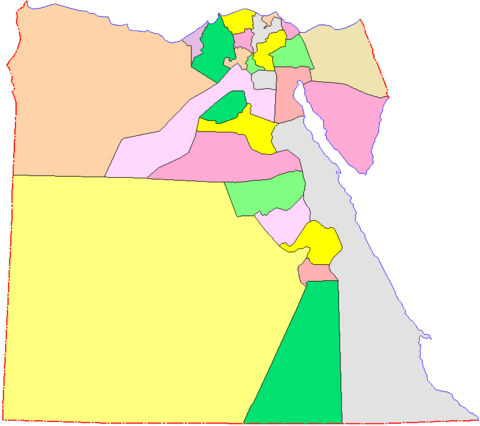
Demographics by Governorate
Urban and Rural Population of Governorates
Data taken from CAPMAS:[19]
| Governorate | % Urban | Population (2015) | Rural | Urban |
|---|---|---|---|---|
| Alexandria | 98.8 | 4,812,186 | 56,698 | 4,755,488 |
| Aswan | 42.3 | 1,431,488 | 826,543 | 604,945 |
| Asyut | 26.5 | 4,245,215 | 3,119,112 | 1,126,103 |
| Beheira | 19.5 | 5,804,262 | 4,674,346 | 1,129,916 |
| Beni Suef | 23.2 | 2,856,812 | 2,193,871 | 662,941 |
| Cairo | 100.0 | 9,278,441 | 0 | 9,278,441 |
| Dakahlia | 28.2 | 5,949,001 | 4,271,428 | 1,677,573 |
| Damietta | 38.7 | 1,330,843 | 815,244 | 515,599 |
| Faiyum | 22.5 | 3,170,150 | 2,456,368 | 713,782 |
| Gharbia | 30.0 | 4,751,865 | 3,324,630 | 1,427,235 |
| Giza | 58.6 | 7,585,115 | 3,138,310 | 4,446,805 |
| Ismailia | 45.4 | 1,178,641 | 643,778 | 534,863 |
| Kafr el-Sheikh | 23.1 | 3,172,753 | 2,441,246 | 731,507 |
| Luxor | 37.8 | 1,147,058 | 713,422 | 433,636 |
| Matruh | 70.6 | 447,846 | 131,841 | 316,005 |
| Minya | 18.9 | 5,156,702 | 4,183,284 | 973,418 |
| Monufia | 20.6 | 3,941,293 | 3,128,460 | 812,833 |
| New Valley | 48.0 | 225,416 | 117,180 | 108,236 |
| North Sinai | 60.2 | 434,781 | 173,095 | 261,686 |
| Port Said | 100.0 | 666,599 | 0 | 666,599 |
| Qalyubia | 44.7 | 5,105,972 | 2,825,045 | 2,280,927 |
| Qena | 19.7 | 3,045,504 | 2,445,051 | 600,453 |
| Red Sea | 95.1 | 345,775 | 17,062 | 328,713 |
| Sharqia | 23.1 | 6,485,412 | 4,987,707 | 1,497,705 |
| Sohag | 21.4 | 4,603,861 | 3,618,543 | 985,318 |
| South Sinai | 51.1 | 167,426 | 81,924 | 85,502 |
| Suez | 100.0 | 622,859 | 0 | 622,859 |
| Total | 42.7 | 87,963,276 | 50,384,188 | 37,579,088 |
Population Density by Governorate
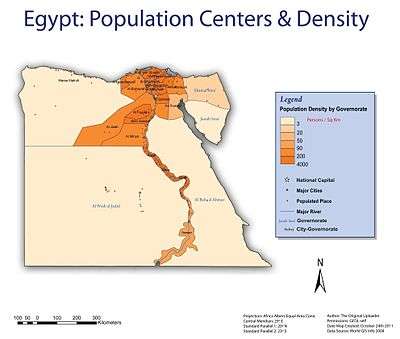
Data taken from CAPMAS:.[19] Information for population is in thousands, pop density - persons/km2 and area is in km2.
| Governorate | Population in thousands (2014-07-01) | Pop. Density (Inhabited Area) | Pop. Density (Total Area) | % Inhabited to Total | Inhabited Area | Total Area |
|---|---|---|---|---|---|---|
| Alexandria | 4,761 | 2,841.5 | 2,070.0 | 72.8 | 1,675.50 | 2,300.00 |
| Aswan | 1,412 | 13,477.1 | 22.5 | 0.2 | 104.77 | 62,726.00 |
| Asyut | 4,181 | 2,656.3 | 161.3 | 6.1 | 1,574.00 | 25,926.00 |
| Beheira | 5,720 | 806.3 | 582.1 | 72.2 | 7,093.84 | 9,826.00 |
| Beni Suef | 2,812 | 2,053.4 | 256.7 | 12.5 | 1,369.41 | 10,954.00 |
| Cairo | 9,184 | 48,235.3 | 2,976.8 | 6.2 | 190.40 | 3,085.12 |
| Dakahlia | 5,881 | 1,662.1 | 1,662.1 | 100.0 | 3,538.23 | 3,538.23 |
| Damietta | 1,316 | 1,968.7 | 1,445.7 | 73.4 | 668.47 | 910.26 |
| Faiyum | 3,118 | 1,680.0 | 513.8 | 30.6 | 1,856.00 | 6,068.00 |
| Gharbia | 4,698 | 2,418.7 | 2,418.7 | 100.0 | 1,942.34 | 1,942.34 |
| Giza | 7,487 | 6,286.3 | 567.9 | 9.0 | 1,191.00 | 13,184.00 |
| Ismailia | 1,162 | 229.3 | 229.3 | 100.0 | 5,066.97 | 5,066.97 |
| Kafr el-Sheikh | 3,132 | 903.5 | 903.5 | 100.0 | 3,466.69 | 3,466.69 |
| Luxor | 1,132 | 4,992.7 | 469.8 | 9.4 | 226.73 | 2,409.68 |
| Matruh | 437 | 111.4 | 2.6 | 2.4 | 3,921.40 | 166,563.00 |
| Minya | 5,076 | 2,104.8 | 157.3 | 7.5 | 2,411.65 | 32,279.00 |
| Monufia | 3,890 | 1,596.9 | 1,556.6 | 97.5 | 2,435.93 | 2,499.00 |
| New Valley | 222 | 205.1 | 0.5 | 0.2 | 1,082.24 | 440,098.00 |
| North Sinai | 428 | 203.7 | 14.8 | 7.2 | 2,100.84 | 28,992.00 |
| Port Said | 660 | 499.7 | 490.7 | 98.2 | 1,320.68 | 1,344.96 |
| Qalyubia | 5,044 | 4,702.1 | 4,486.4 | 95.4 | 1,072.72 | 1,124.28 |
| Qena | 3,001 | 1,724.1 | 277.9 | 16.1 | 1,740.63 | 10,798.00 |
| Red Sea | 341 | 4,794.0 | 2.9 | 0.1 | 71.13 | 119,099.13 |
| Sharqia | 6,402 | 1,343.7 | 1,303.6 | 97.0 | 4,764.28 | 4,911.00 |
| Sohag | 4,536 | 2,845.8 | 411.5 | 14.5 | 1,593.92 | 11,022.00 |
| South Sinai | 166 | 9.9 | 5.3 | 53.7 | 16,791.00 | 31,272.00 |
| Suez | 615 | 68.3 | 68.3 | 100.0 | 9,002.21 | 9,002.21 |
| Total | 86,814 | 1109.1 | 85.9 | 7.8 | 78272.98 | 1010407.87 |
Ethnic groups
The CIA World Factbook lists "Egyptians" as 88.6%, and "other" as 11.4% (2006 census). "Other" refers to people who are not citizens of Egypt, who come to Egypt to work for international companies, diplomats, etc.
The vast majority of the population of Egypt consists of Egyptians including Copts, Egyptians make up 95% of the population.[21] The vast majority of Egyptians are native speakers of modern Egyptian Arabic.
Minorities in Egypt include the Copts who represent around 10% of the entire population and live all over the country, the Berber-speaking community of the Siwa Oasis (Siwis) and the Nubian people clustered along the Nile in the southernmost part of Egypt. There are also sizable minorities of Beja and Dom.
The country was host to many different communities during the colonial period, including Greeks, Italians, Lebanese, Syro-Lebanese, Jews, Armenians, Turks and Albanians, though most either left or were compelled to leave after political developments in the 1950s. The country still hosts some 90,000 refugees and asylum seekers, mostly Palestinians and Sudanese.
Other sources give more detailed statistics, including the Beja (ca. 1 million), the Nubians (ca. 300,000 in 1996), Dom (ca. 230,000 in 1996), Berbers (Siwis) (ca. 5,000).
Languages
Arabic is the official language of Egypt, with the vast majority of Egyptians speaking Egyptian Arabic. In The Upper Nile valley, Sa'idi Arabic is prevalent. The Coptic language is used in the Coptic church for the majority of prayers, hymns, masses, and meditations. English widely understood as well as French. Siwa language used in ethnic Berber tribal areas in the western desert (Siwa), and Nubian language is widely used among the ethnic Nubians in the southern areas.
Religions
According to the CIA World Factbook, approximately 90% of the population is Muslim and 10% is Christian (9% Coptic Orthodox Church of Alexandria, 1% other Christian). Estimates of the Christian population in Egypt range from 6% to 20%.
Education
The literacy rate in modern Egyptian society is highly debated. Education is free through university and compulsory from ages six through 15, though enforcement may be lax. Rates for primary and secondary education have strengthened in recent years. The vast majority of children enter primary school though a significant number drop out. There are approx. 200,000 primary and secondary schools with some 10 million students, 13 major universities with more than 500,000 students, and 67 teacher colleges. Major universities include Cairo University (100,000 students), Ain Shams University, Alexandria University, the 1,000-year-old Al-Azhar University, one of the world's major centers of Islamic learning and the AUC (American University in Cairo), . The former first lady has created many project towards the advancement of Egyptian education and the efforts to force education to the remaining 7-9% of students who drop out illegally. Child labor is a contributing factor to these dropouts but it is considered a serious crime to work children under the legal age and charges are taken very seriously at this time.
CIA World Factbook demographic statistics
The following demographic statistics are from the CIA World Factbook, unless otherwise indicated.
Infant mortality rate
- 22.41 deaths/1,000 live births (2014 est.)
Life expectancy at birth
- total population: 72.7 years
- male: 71.4 years
- female: 74.2 years (2016 est.)
Nationality
- noun: Egyptian(s)
- adjective: Egyptian
Literacy
Genetics
Y-Chromosome
Listed here are the human Y-chromosome DNA haplogroups in Egypt.[26]
| Haplogroup | n | A | B | E1a | E1b1a | E1b1b1 | E1b1b1a | E1b1b1a1 | E1b1b1a1b | E1b1b1a2 | E1b1b1a3 | E1b1b1a4 | E1b1b1b | E1b1b1c | F | G | I | J1 | J2 | K | L | O | P,R | Q | R1a | R1b1a | R1b1b | R2 | T |
| Marker | M33 | M2 | M35 | M78 | V12 | V32 | V13 | V22 | V65 | M81 | M34 | M89 | M201 | V88 | M269 | M70 | |||||||||||||
| Egypt | 370 | 1.35 | - | 0.54 | 2.43 | 3.24 | 0.81 | 7.03 | 1.62 | 0.81 | 9.19 | 2.43 | 11.89 | 6.76 | 1.08 | 5.68 | 0.54 | 20.81 | 6.75 | 0.27 | 0.81 | 0.27 | 0.54 | 0.27 | 2.16 | 2.97 | 2.97 | 0.54 | 6.22 |
See also
References

- ↑ "Egypt Facts". National Geographic.
- ↑ "population clock". Egypt Central Agency for Public Mobilization And Statistics.
- ↑ Korotayev A., Zinkina J. Egyptian Revolution: A Demographic Structural Analysis. Entelequia. Revista Interdisciplinar 13 (2011): 139-169.
- ↑ "The long-term economic challenges Egypt must overcome". Marketplace. 1 February 2011. Archived from the original on 4 February 2011. Retrieved 1 February 2011.
- ↑ "Egypt's Population Increases 1 Million in Six Months to Reach 92 Million".
- ↑ "Official Population Clock". Retrieved 2015-05-20.
- ↑ CO2 Emissions from Fuel Combustion Population 1971-2008 (pdf pages 83-85) IEA (OECD/ World Bank) original population ref e.g. in IEA Key World Energy Statistics 2010 page 57)
- ↑ "Archived copy". Archived from the original on 25 May 2013. Retrieved 2014-01-26.
- ↑ "Demographic and Health Survey 2014" (PDF). DHS. Retrieved 2015-08-01.
- ↑ "Population in Censuses by Sex & Sex Ratio (1882–2006)" (PDF). Egypt State Information Service.
- ↑ IOM Migration and Development in Egypt Facts and Figures
- 1 2 "Statistical Yearbook - Population". 2015-05-20.
- ↑ United nations. Demographic Yearbooks
- ↑ Central Agency for Public Mobilization and Statistics
- ↑ http://www.dhsprogram.com/publications/publication-PR54-Preliminary-Reports-Key-Indicator-Reports.cfm
- ↑ CAPMAS - Vital Statistics
- ↑ http://www.dhsprogram.com/What-We-Do/Survey-Search.cfm
- ↑ "World Population Prospects - Population Division - United Nations". esa.un.org. Retrieved 2018-08-26.
- 1 2 "Egypt in Figures 2015" (PDF). CAPMAS. Retrieved 2015-08-01.
- ↑ "Africa :: EGYPT". CIA The World Factbook.
- 1 2 3 https://www.cia.gov/library/publications/the-world-factbook/geos/eg.html
- ↑ International Religious Freedom Report for 2014 US Department of State
- ↑ International Religious Freedom Report 2006 - Egypt
- 1 2 International Religious Freedom Report 2007 - Egypt
- ↑ CIA World Factbook - Egypt
- ↑ Bekada A, Fregel R, Cabrera VM, Larruga JM, Pestano J, et al. (2013) Introducing the Algerian Mitochondrial DNA and Y-Chromosome Profiles into the North African Landscape. PLoS ONE 8(2): e56775. doi:10.1371/journal.pone.0056775
External links
| Wikimedia Commons has media related to Demographics of Egypt. |
| Sovereign states |
|
|---|---|
| States with limited recognition | |
| Dependencies and other territories | |
| |
| Religions | |
|---|---|
| Ethnic groups | |
| Foreign nationals | |