Life expectancy
Life expectancy is a statistical measure of the average time an organism is expected to live, based on the year of its birth, its current age and other demographic factors including gender. The most commonly used measure of life expectancy is at birth (LEB), which can be defined in two ways. Cohort LEB is the mean length of life of an actual birth cohort (all individuals born a given year) and can be computed only for cohorts born many decades ago, so that all their members have died. Period LEB is the mean length of life of a hypothetical cohort assumed to be exposed, from birth through death, to the mortality rates observed at a given year.[1]
National LEB figures reported by statistical national agencies and international organizations are indeed estimates of period LEB. In the Bronze Age and the Iron Age, LEB was 26 years; the 2010 world LEB was 67.2 years. For recent years, in Swaziland LEB is about 49, and in Japan, it is about 83. The combination of high infant mortality and deaths in young adulthood from accidents, epidemics, plagues, wars, and childbirth, particularly before modern medicine was widely available, significantly lowers LEB. But for those who survive early hazards, a life expectancy of 70 would not be uncommon. For example, a society with a LEB of 40 may have few people dying at precisely 40: most will die before 30 or after 55. In populations with high infant mortality rates, LEB is highly sensitive to the rate of death in the first few years of life. Because of this sensitivity to infant mortality, LEB can be subjected to gross misinterpretation, leading one to believe that a population with a low LEB will necessarily have a small proportion of older people.[2] For example, in a hypothetical stationary population in which half the population dies before the age of five but everybody else dies at exactly 70 years old, LEB will be about 36, but about 25% of the population will be between the ages of 50 and 70. Another measure, such as life expectancy at age 5 (e5), can be used to exclude the effect of infant mortality to provide a simple measure of overall mortality rates other than in early childhood; in the hypothetical population above, life expectancy at 5 would be another 65. Aggregate population measures, such as the proportion of the population in various age groups, should also be used along individual-based measures like formal life expectancy when analyzing population structure and dynamics.
Mathematically, life expectancy is the mean number of years of life remaining at a given age, assuming age-specific mortality rates remain at their most recently measured levels.[3] It is denoted by ,[a] which means the mean number of subsequent years of life for someone now aged , according to a particular mortality experience. Longevity, maximum lifespan, and life expectancy are not synonyms. Life expectancy is defined statistically as the mean number of years remaining for an individual or a group of people at a given age. Longevity refers to the characteristics of the relatively long life span of some members of a population. Maximum lifespan is the age at death for the longest-lived individual of a species. Moreover, because life expectancy is an average, a particular person may die many years before or many years after the "expected" survival. The term "maximum life span" has a quite different meaning and is more related to longevity.


Life expectancy is also used in plant or animal ecology;[4] life tables (also known as actuarial tables). The term life expectancy may also be used in the context of manufactured objects,[5] but the related term shelf life is used for consumer products, and the terms "mean time to breakdown" (MTTB) and "mean time between failures" (MTBF) are used in engineering.
Human patterns
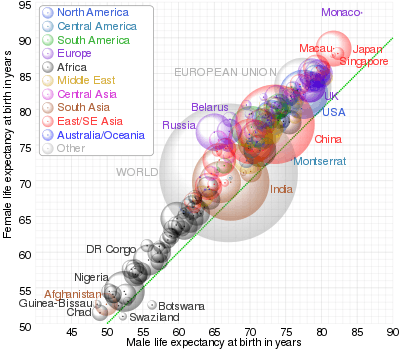
Human beings are expected to live on average 30–40 years in Swaziland[6] and 82.6 years in Japan, but the latter's recorded life expectancy may have been very slightly increased by counting many infant deaths as stillborn.[7] An analysis published in 2011 in The Lancet attributes Japanese life expectancy to equal opportunities and public health as well as diet.[8][9]
The oldest confirmed recorded age for any human is 122 years, reached by Jeanne Calment who lived between 1875-1997. This is referred to as the "maximum life span", which is the upper boundary of life, the maximum number of years any human is known to have lived.[10] Theoretical study shows that the maximum life expectancy at birth is limited by the human life characteristic value δ, which is around 104 years.[11] According to a study by biologists Bryan G. Hughes and Siegfried Hekimi, there is no evidence for limit on human lifespan.[12][13]
Variation over time
The following information is derived from the 1961 Encyclopædia Britannica and other sources, some with questionable accuracy. Unless otherwise stated, it represents estimates of the life expectancies of the world population as a whole. In many instances, life expectancy varied considerably according to class and gender.
Life expectancy at birth takes account of infant mortality but not prenatal mortality.
| Era | Life expectancy at birth in years | Life expectancy at older age |
|---|---|---|
| Paleolithic | 33 | Based on Neolithic and Bronze Age data, the total life expectancy at 15 would not exceed 34 years.[14] Based on the data from modern hunter-gatherer populations, it is estimated that at 15, life expectancy was an additional 39 years (total 54), with a 0.60 probability of reaching 15.[15] |
| Neolithic | 20[16] to 33[17] | Based on Early Neolithic data, total life expectancy at 15 would be 28–33 years[14] |
| Bronze Age and Iron Age[18] | 26 | Based on Early and Middle Bronze Age data, total life expectancy at 15 would be 28–36 years[14] |
| Classical Greece | 25[19] to 28[20] | Based on Athens Agora and Corinth data, total life expectancy at 15 would be 37–41 years[14] |
| Classical Rome | 25 | If a child survived to age 25, life expectancy was an additional 28.6 years (total age 53.6 years).[21] |
| Medieval Islamic world[22] | 35+ | Average lifespan of scholars was 59–84.3 years.[23][24][25][26] |
| Pre-Columbian Southern United States[27] | 25–30 | |
| Late medieval English peerage[28][29] | 30 | At age 21, life expectancy was an additional 43 years (total age 64).[30] |
| Early modern England[18] | 33–40 | 34 years for males in the 18th century.[31] |
| Pre-Champlain Canadian Maritimes[32] | 60 | Samuel de Champlain wrote that in his visits to Mi'kmaq and Huron communities, he met people over 100 years old. Daniel Paul attributes the incredible lifespan in the region to low stress and a healthy diet of lean meats, diverse vegetables and legumes.[33] |
| 18th-century Prussia[31] | 24.7 | For males.[31] |
| 18th-century France[31] | 27.5–30 | For males.[31] |
| 18th-century Qing China[31] | 39.6 | For males.[31] |
| 18th-century Edo Japan[31] | 41.1 | For males.[31] |
| Early 19th-century England[18] | 40 | |
| 1900 world average[34] | 31 | |
| 1950 world average[34] | 48 | |
| 2014 world average[35] | 71.5 |
Life expectancy increases with age as the individual survives the higher mortality rates associated with childhood. For instance, the table above listed the life expectancy at birth among 13th-century English nobles at 30. Having survived until the age of 21, a male member of the English aristocracy in this period could expect to live:[30]
- 1200–1300: to age 64
- 1300–1400: to age 45 (because of the bubonic plague)
- 1400–1500: to age 69
- 1500–1550: to age 71
In a similar way, the life expectancy of scholars in the Medieval Islamic world was 59–84.3 years.[23][24][25][26]
17th-century English life expectancy was only about 35 years, largely because infant and child mortality remained high. Life expectancy was under 25 years in the early Colony of Virginia,[36] and in seventeenth-century New England, about 40 per cent died before reaching adulthood.[37] During the Industrial Revolution, the life expectancy of children increased dramatically.[38] The under-5 mortality rate in London decreased from 745 in 1730–1749 to 318 in 1810–1829.[39][40]
Public health measures are credited with much of the recent increase in life expectancy. During the 20th century, despite a brief drop due to the 1918 flu pandemic[41] starting around that time the average lifespan in the United States increased by more than 30 years, of which 25 years can be attributed to advances in public health.[42]
Regional variations
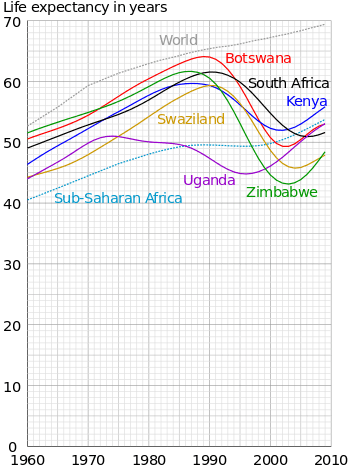
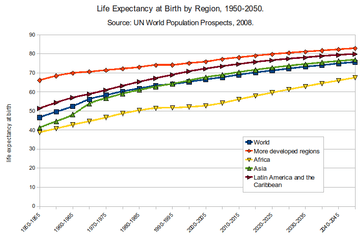
There are great variations in life expectancy between different parts of the world, mostly caused by differences in public health, medical care, and diet. The impact of AIDS on life expectancy is particularly notable in many African countries. According to projections made by the United Nations (UN) in 2002, the life expectancy at birth for 2010–2015 (if HIV/AIDS did not exist) would have been:[44]
- 70.7 years instead of 31.6 years

- 69.9 years instead of 41.5 years

- 70.5 years instead of 31.8 years

Actual life expectancy in Botswana declined from 65 in 1990 to 49 in 2000 before increasing to 66 in 2011. In South Africa, life expectancy was 63 in 1990, 57 in 2000, and 58 in 2011. And in Zimbabwe, life expectancy was 60 in 1990, 43 in 2000, and 54 in 2011.[45]
During the last 200 years, African countries have generally not had the same improvements in mortality rates that have been enjoyed by countries in Asia, Latin America, and Europe.[46][47]
In the United States, African-American people have shorter life expectancies than their European-American counterparts. For example, white Americans born in 2010 are expected to live until age 78.9, but black Americans only until age 75.1. This 3.8-year gap, however, is the lowest it has been since 1975 at the latest. The greatest difference was 7.1 years in 1993.[48] In contrast, Asian-American women live the longest of all ethnic groups in the United States, with a life expectancy of 85.8 years.[49] The life expectancy of Hispanic Americans is 81.2 years.[48]
Cities also experience a wide range of life expectancy based on neighborhood breakdowns. This is largely due to economic clustering and poverty conditions that tend to associate based on geographic location. Multi-generational poverty found in struggling neighborhoods also contributes. In United States cities such as Cincinnati, the life expectancy gap between low income and high income neighborhoods touches 20 years.[50]
Economic circumstances
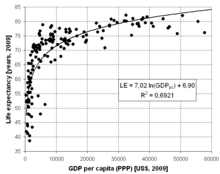
Economic circumstances also affect life expectancy. For example, in the United Kingdom, life expectancy in the wealthiest and richest areas is several years higher than in the poorest areas. This may reflect factors such as diet and lifestyle, as well as access to medical care. It may also reflect a selective effect: people with chronic life-threatening illnesses are less likely to become wealthy or to reside in affluent areas.[51] In Glasgow, the disparity is amongst the highest in the world: life expectancy for males in the heavily deprived Calton area stands at 54, which is 28 years less than in the affluent area of Lenzie, which is only 8 km away.[52][53]
A 2013 study found a pronounced relationship between economic inequality and life expectancy.[54] However, a study by José A. Tapia Granados and Ana Diez Roux at the University of Michigan found that life expectancy actually increased during the Great Depression, and during recessions and depressions in general.[55] The authors suggest that when people are working extra hard during good economic times, they undergo more stress, exposure to pollution, and likelihood of injury among other longevity-limiting factors.
Life expectancy is also likely to be affected by exposure to high levels of highway air pollution or industrial air pollution. This is one way that occupation can have a major effect on life expectancy. Coal miners (and in prior generations, asbestos cutters) often have lower life expediencies than average life expediencies. Other factors affecting an individual's life expectancy are genetic disorders, drug use, tobacco smoking, excessive alcohol consumption, obesity, access to health care, diet and exercise.
Sex differences
In the uterus, male fetuses have a higher mortality rate (babies are conceived in a ratio estimated to be from 107 to 170 males to 100 females, but the ratio at birth in the United States is only 105 males to 100 females).[59] Among the smallest premature babies (those under 2 pounds or 900 g), females again have a higher survival rate. At the other extreme, about 90% of individuals aged 110 are female. The difference in life expectancy between men and women in the United States dropped from 7.8 years in 1979 to 5.3 years in 2005, with women expected to live to age 80.1 in 2005.[60] Also, data from the UK shows the gap in life expectancy between men and women decreasing in later life. This may be attributable to the effects of infant mortality and young adult death rates.[61]
In the past, mortality rates for females in child-bearing age groups were higher than for males at the same age. This is no longer the case, and female human life expectancy is considerably higher than that of males. The reasons for this are not entirely certain. Traditional arguments tend to favor sociology-environmental factors: historically, men have generally consumed more tobacco, alcohol and drugs than women in most societies, and are more likely to die from many associated diseases such as lung cancer, tuberculosis and cirrhosis of the liver.[62] Men are also more likely to die from injuries, whether unintentional (such as occupational, war or car accidents) or intentional (suicide).[62] Men are also more likely to die from most of the leading causes of death (some already stated above) than women. Some of these in the United States include: cancer of the respiratory system, motor vehicle accidents, suicide, cirrhosis of the liver, emphysema, prostate cancer, and coronary heart disease.[10] These far outweigh the female mortality rate from breast cancer and cervical cancer.
Some argue that shorter male life expectancy is merely another manifestation of the general rule, seen in all mammal species, that larger (size) individuals (within a species) tend, on average, to have shorter lives.[63][64] This biological difference occurs because women have more resistance to infections and degenerative diseases.[10]
In her extensive review of the existing literature, Kalben concluded that the fact that women live longer than men was observed at least as far back as 1750 and that, with relatively equal treatment, today males in all parts of the world experience greater mortality than females. Kalben's study, however, was restricted to data in Western Europe alone, where demographic transition occurred relatively early. In countries such as Hungary, Bulgaria, India and China, males continued to outlive females into the twentieth century.[65] Of 72 selected causes of death, only 6 yielded greater female than male age-adjusted death rates in 1998 in the United States. With the exception of birds, for almost all of the animal species studied, males have higher mortality than females. Evidence suggests that the sex mortality differential in people is due to both biological/genetic and environmental/behavioral risk and protective factors.[66]
There is a recent suggestion that mitochondrial mutations that shorten lifespan continue to be expressed in males (but less so in females) because mitochondria are inherited only through the mother. By contrast, natural selection weeds out mitochondria that reduce female survival; therefore such mitochondria are less likely to be passed on to the next generation. This thus suggests that females tend to live longer than males. The authors claim that this is a partial explanation.[67][68]
In developed countries, starting around 1880, death rates decreased faster among women, leading to differences in mortality rates between males and females. Before 1880 death rates were the same. In people born after 1900, the death rate of 50- to 70-year-old men was double that of women of the same age. Cardiovascular disease was the main cause of the higher death rates among men. Men may be more vulnerable to cardiovascular disease than women, but this susceptibility was evident only after deaths from other causes, such as infections, started to decline.[69]
Centenarians
In developed countries, the number of centenarians is increasing at approximately 5.5% per year, which means doubling the centenarian population every 13 years, pushing it from some 455,000 in 2009 to 4.1 million in 2050.[70] Japan is the country with the highest ratio of centenarians (347 for every 1 million inhabitants in September 2010). Shimane prefecture had an estimated 743 centenarians per million inhabitants.[71]
In the United States, the number of centenarians grew from 32,194 in 1980 to 71,944 in November 2010 (232 centenarians per million inhabitants).[72]
Mental illness
Mental illness is reported to occur in approximately 18% of the average American population.[73][74]

The seriously mentally ill have a 10- to 25-year reduction in life expectancy.[76] The reduction of lifespan has been studied and documented.[77][78][79][80][81][82][83]
The greater mortality of people with mental disorders may be due to death from injury, from co-morbid conditions, or from medication side effects.[84] Psychiatric medicines can increase the chance of developing diabetes.[85][86][87][88] Psychiatric medicine can also cause Agranulocytosis.[89] Psychiatric medicines also affect the stomach,[90][91] where the mentally ill have a four times risk of gastrointestinal disease.[92][93]
Other illnesses
The life expectancy of people with diabetes, which is 9.3% of the U.S. population, is reduced by roughly ten to twenty years.[94][95] Other demographics that tend to have a lower life expectancy than average include transplant recipients,[96] and the obese.[97]
Evolution and aging rate
Various species of plants and animals, including humans, have different lifespans. Evolutionary theory states that organisms that, by virtue of their defenses or lifestyle, live for long periods and avoid accidents, disease, predation, etc. are likely to have genes that code for slow aging, which often translates to good cellular repair. One theory is that if predation or accidental deaths prevent most individuals from living to an old age, there will be less natural selection to increase the intrinsic life span.[98] That finding was supported in a classic study of opossums by Austad;[99] however, the opposite relationship was found in an equally prominent study of guppies by Reznick.[100][101]
One prominent and very popular theory states that lifespan can be lengthened by a tight budget for food energy called caloric restriction.[102] Caloric restriction observed in many animals (most notably mice and rats) shows a near doubling of life span from a very limited calorific intake. Support for the theory has been bolstered by several new studies linking lower basal metabolic rate to increased life expectancy.[103][104][105] That is the key to why animals like giant tortoises can live so long.[106] Studies of humans with life spans of at least 100 have shown a link to decreased thyroid activity, resulting in their lowered metabolic rate.
In a broad survey of zoo animals, no relationship was found between the fertility of the animal and its life span.[107]
Calculation
The starting point for calculating life expectancy is the age-specific death rates of the population members. If a large number of data is available, a statistical population can be created that allow the age-specific death rates to be simply taken as the mortality rates actually experienced at each age (the number of deaths divided by the number of years "exposed to risk" in each data cell). However, it is customary to apply smoothing to iron out, as much as possible, the random statistical fluctuations from one year of age to the next. In the past, a very simple model used for this purpose was the Gompertz function, but more sophisticated methods are now used.[108]
These are the most common methods now used for that purpose:
- to fit a mathematical formula, such as an extension of the Gompertz function, to the data,
- for relatively small amounts of data, to look at an established mortality table that was previously derived for a larger population and make a simple adjustment to it (as multiply by a constant factor) to fit the data.
- with a large number of data, one looks at the mortality rates actually experienced at each age, and applies smoothing (as by cubic splines).
While the data required are easily identified in the case of humans, the computation of life expectancy of industrial products and wild animals involves more indirect techniques. The life expectancy and demography of wild animals are often estimated by capturing, marking, and recapturing them.[109] The life of a product, more often termed shelf life, is also computed using similar methods. In the case of long-lived components, such as those used in critical applications: in aircraft, methods like accelerated aging are used to model the life expectancy of a component.[5]
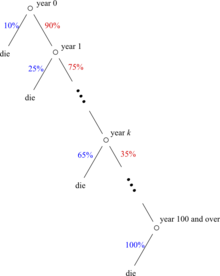
The age-specific death rates are calculated separately for separate groups of data that are believed to have different mortality rates (such as males and females, and perhaps smokers and non-smokers if data are available separately for those groups) and are then used to calculate a life table from which one can calculate the probability of surviving to each age. In actuarial notation, the probability of surviving from age to age is denoted and the probability of dying during age (between ages and ) is denoted . For example, if 10% of a group of people alive at their 90th birthday die before their 91st birthday, the age-specific death probability at 90 would be 10%. That is a probability, not a mortality rate.


The expected future lifetime of a life age in whole years (the curtate expected lifetime of (x)) is denoted by the symbol .[a] It is the conditional expected future lifetime (in whole years), assuming survival to age . If denotes the curtate future lifetime at ,


![e_{x}=E[K(x)]=\sum _{k=0}^{\infty }k\,Pr(K(x)=k)=\sum _{k=0}^{\infty }k\,\,_{k}p_{x}\,\,q_{x+k}.](../I/m/96c0c9d5aa6891a3845226a2aee458c9ae8a833e.svg)
Substituting in the sum and simplifying gives the equivalent formula:[110] If the assumption is made that on average, people live a half year in the year of death, the complete expectation of future lifetime at age is .


Life expectancy is by definition an arithmetic mean. It can also be calculated by integrating the survival curve from 0 to positive infinity (or equivalently to the maximum lifespan, sometimes called 'omega'). For an extinct or completed cohort (all people born in year 1850, for example), it can of course simply be calculated by averaging the ages at death. For cohorts with some survivors, it is estimated by using mortality experience in recent years. The estimates are called period cohort life expectancies.
It is important to note that the statistic is usually based on past mortality experience and assumes that the same age-specific mortality rates will continue into the future. Thus, such life expectancy figures need to be adjusted for temporal trends before calculating how long a currently living individual of a particular age is expected to live. Period life expectancy remains a commonly used statistic to summarize the current health status of a population.
However, for some purposes, such as pensions calculations, it is usual to adjust the life table used by assuming that age-specific death rates will continue to decrease over the years, as they have usually done in the past. That is often done by simply extrapolating past trends; but some models exist to account for the evolution of mortality like the Lee–Carter model.[111]
As discussed above, on an individual basis, a number of factors correlate with a longer life. Factors that are associated with variations in life expectancy include family history, marital status, economic status, physique, exercise, diet, drug use including smoking and alcohol consumption, disposition, education, environment, sleep, climate, and health care.[10]
Healthy life expectancy
In order to assess the quality of these additional years of life, 'healthy life expectancy' has been calculated for the last 30 years. Since 2001, the World Health Organization has published statistics called Healthy life expectancy (HALE), defined as the average number of years that a person can expect to live in "full health" excluding the years lived in less than full health due to disease and/or injury[112]. Since 2004, Eurostat publishes annual statistics called Healthy Life Years (HLY) based on reported activity limitations. The United States uses similar indicators in the framework of the national health promotion and disease prevention plan "Healthy People 2010". More and more countries are using health expectancy indicators to monitor the health of their population.
Forecasting
Forecasting life expectancy and mortality forms an important subdivision of demography. Future trends in life expectancy have huge implications for old-age support programs like U.S. Social Security and pension since the cash flow in these systems depends on the number of recipients who are still living (along with the rate of return on the investments or the tax rate in pay-as-you-go systems). With longer life expectancies, the systems see increased cash outflow; if the systems underestimate increases in life-expectancies, they will be unprepared for the large payments that will occur, as humans live longer and longer.
Life expectancy forecasting is usually based on two different approaches:
- Forecasting the life expectancy directly, generally using ARIMA or other time series extrapolation procedures: that has the advantage of simplicity, but it cannot account for changes in mortality at specific ages, and the forecast number cannot be used to derive other life table results. Analyses and forecasts using this approach can be done with any common statistical/mathematical software package, like EViews, R, SAS, Stata, Matlab, or SPSS.
- Forecasting age specific death rates and computing the life expectancy from the results with life table methods: that is usually more complex than simply forecasting life expectancy because the analyst must deal with correlated age-specific mortality rates, but it seems to be more robust than simple one-dimensional time series approaches. It also yields a set of age specific-rates that may be used to derive other measures, such as survival curves or life expectancies at different ages. The most important approach within this group is the Lee-Carter model,[113] which uses the singular value decomposition on a set of transformed age-specific mortality rates to reduce their dimensionality to a single time series, forecasts that time series and then recovers a full set of age-specific mortality rates from that forecasted value. Software includes Professor Rob J. Hyndman's R package called `demography` and UC Berkeley's LCFIT system.
Policy uses
Life expectancy is one of the factors in measuring the Human Development Index (HDI) of each nation along with adult literacy, education, and standard of living.[114]
Life expectancy is also used in describing the physical quality of life of an area or, for an individual when the value of a life settlement is determined a life insurance policy sold for a cash asset.
Disparities in life expectancy are often cited as demonstrating the need for better medical care or increased social support. A strongly associated indirect measure is income inequality. For the top 21 industrialized countries, if each person is counted equally, life expectancy is lower in more unequal countries (r = −0.907).[115] There is a similar relationship among states in the US (r = −0.620).[116]
Life expectancy vs. life span
Life expectancy differs from maximum life span. Life expectancy is an average[117] for all people in the population — including those who die shortly after birth, those who die in early adulthood (e.g. childbirth, war), and those who live unimpeded until old age. Lifespan is an individual-specific concept — maximum lifespan is therefore an upper bound rather than an average.
However, these two terms are often confused with each other to the point that when people hear "life expectancy was 35 years" they often interpret this as meaning that people of that time or place had short maximum life spans.[118] One such example can be seen in the In Search of... episode "The Man Who Would Not Die" (About Count of St. Germain) where it is stated "Evidence recently discovered in the British Museum indicates that St. Germain may have well been the long lost third son of Rákóczi born in Transylvania in 1694. If he died in Germany in 1784, he lived 90 years. The average life expectancy in the 18th century was 35 years. Fifty was a ripe old age. Ninety... was forever."
In reality, there are other examples of people living significantly longer than the life expectancy of their time period, such as Socrates, Saint Anthony, Michelangelo, and Benjamin Franklin.[119]
It can be argued that it is better to compare life expectancy of the period after childhood to get a better handle on life span.[120] Life expectancy can change dramatically after childhood, even in preindustrial times as is demonstrated by the Roman Life Expectancy table, which estimates life expectancy to be 25 years at birth, but 53 years upon reaching age 25.[121] Studies like Plymouth Plantation; "Dead at Forty" and Life Expectancy by Age, 1850–2004 similarly show a dramatic increase in life expectancy once adulthood was reached.[122][123]
See also
- Depreciation
- Biodemography
- Calorie restriction
- Demography
- DNA damage theory of aging
- Glasgow effect
- Healthcare inequality
- Indefinite lifespan
- Life table
- List of countries by life expectancy
- List of longest-living organisms
- Maximum life span
- Medieval demography
- Mitohormesis
- Mortality rate
- Population Pyramid
- Senescence
- Lindy Effect
Increasing life expectancy
Notes
a. ^ ^ In standard actuarial notation, ex refers to the expected future lifetime of (x) in whole years, while ex with a circle above the e denotes the complete expected future lifetime of (x), including the fraction.
References
- ↑ S. Shryok, J. S. Siegel et al. The Methods and Materials of Demography. Washington, DC, US Bureau of the Census, 1973
- ↑ Laden, Greg (2011-05-01). "Falsehood: "If this was the Stone Age, I'd be dead by now"". ScienceBlogs. Retrieved 2014-08-31.
- ↑ Arthur O'Sullivan; Steven M. Sheffrin (2003). Economics: Principles in Action. Pearson Prentice Hall. p. 473. ISBN 0-13-063085-3.
- ↑ John S. Millar; Richard M. Zammuto (1983). "Life Histories of Mammals: An Analysis of Life Tables". Ecology. Ecological Society of America. 64 (4): 631–635. doi:10.2307/1937181. JSTOR 1937181.
- 1 2 Eliahu Zahavi, Vladimir Torbilo & Solomon Press (1996) Fatigue Design: Life Expectancy of Machine Parts. CRC Press. ISBN 0-8493-8970-4.
- ↑ "The World Factbook — Central Intelligence Agency".
- ↑ Ansley J. Coale; Judith Banister (December 1996). "Five decades of missing females in China". Proceedings of the American Philosophical Society. 140 (4): 421–450. JSTOR 987286. Also printed as Coale AJ, Banister J (Aug 1994). "Five decades of missing females in China". Demography. 31: 459–79. doi:10.2307/2061752. PMID 7828766.
- ↑ Boseley, Sarah (August 30, 2011). "Japan's life expectancy 'down to equality and public health measures'". The Guardian. London. Retrieved August 31, 2011.
Japan has the highest life expectancy in the world but the reasons says an analysis, are as much to do with equality and public health measures as diet.... According to a paper in a Lancet series on healthcare in Japan....
- ↑ Ikeda, Nayu; Saito, Eiko; Kondo, Naoki; Inoue, Manami; Ikeda, Shunya; Satoh, Toshihiko; Wada, Koji; Stickley, Andrew; Katanoda, Kota; Mizoue, Tetsuya; Noda, Mitsuhiko; Iso, Hiroyasu; Fujino, Yoshihisa; Sobue, Tomotaka; Tsugane, Shoichiro; Naghavi, Mohsen; Ezzati, Majid; Shibuya, Kenji (August 2011). "What has made the population of Japan healthy?". The Lancet. 378 (9796): 1094–105. doi:10.1016/S0140-6736(11)61055-6. PMID 21885105.
Reduction in health inequalities with improved average population health was partly attributable to equal educational opportunities and financial access to care.
- 1 2 3 4 Santrock, John (2007). Life Expectancy. A Topical Approach to: Life-Span Development (pp. 128–132). New York, New York: The McGraw-Hill Companies, Inc.
- ↑ X. Liu (2015). "Life equations for the senescence process". Biochemistry and Biophysics Reports. 4: 228–233. doi:10.1016/j.bbrep.2015.09.020.
- ↑ "No detectable limit to how long people can live" (Press release). Science Daily. June 28, 2017. Retrieved July 4, 2017.
- ↑ Hughes, Bryan G.; Hekimi, Siegfried (June 29, 2017). "Many possible maximum lifespan trajectories". Nature. 546: E8–E9. doi:10.1038/nature22786. Retrieved July 4, 2017.
- 1 2 3 4 J. Lawrence Angel (May 1969). "The bases of paleodemography". American Journal of Physical Anthropology. 30 (3): 427–437. doi:10.1002/ajpa.1330300314.
- ↑ Hillard Kaplan; Kim Hill; Jane Lancaster; A. Magdalena Hurtado (2000). "A Theory of Human Life History Evolution: Diet, Intelligence and Longevity" (PDF). Evolutionary Anthropology. 9 (4): 156–185. doi:10.1002/1520-6505(2000)9:4<156::AID-EVAN5>3.0.CO;2-7. Retrieved 12 September 2010.
- ↑ Galor, Oded; Moav, Omer (2007). "The Neolithic Revolution and Contemporary Variations in Life Expectancy" (PDF). Brown University Working Paper. Retrieved September 12, 2010.
- ↑ Angel Lawrence J. (1984), "Health as a crucial factor in the changes from hunting to developed farming in the eastern Mediterranean", Proceedings of meeting on Paleopathology at the Origins of Agriculture: 51–73
- 1 2 3 Galor, Oded; Moav, Omer (2005). "Natural Selection and the Evolution of Life Expectancy" (PDF). Brown University Working Paper. Retrieved November 4, 2010.
- ↑ Mogens Herman Hansen, The Shotgun Method, p. 55.
- ↑ "Mortality". Britannica.com. Retrieved November 4, 2010.
- ↑ Frier, Bruce. (2000). The Cambridge Ancient History XI: The High Empire, A.D. 70–192. Cambridge University Press. p. 789. ISBN 0-521-04493-6.
- ↑ Conrad, Lawrence I. (2006). The Western Medical Tradition. Cambridge University Press. p. 137. ISBN 0-521-47564-3.
- 1 2 Jaques, R. Kevin (2006). Authority, Conflict, and the Transmission of Diversity in Medieval Islamic Law. Brill Publishers. p. 188. ISBN 9789004147454.
- 1 2 Ahmad, Ahmad Atif (2007), "Authority, Conflict, and the Transmission of Diversity in Medieval Islamic Law by R. Kevin Jaques", Journal of Islamic Studies, 18 (2): 246–248 [246], doi:10.1093/jis/etm005
- 1 2 Bulliet, Richard W. (1983), "The Age Structure of Medieval Islamic Education", Studia Islamica, 57: 105–117 [111], doi:10.2307/1595484
- 1 2 Shatzmiller, Maya (1994), Labour in the Medieval Islamic World, Brill Publishers, p. 66, ISBN 9004098968
- ↑ "Pre-European Exploration, Prehistory through 1540". Encyclopediaofarkansas.net. October 5, 2010. Retrieved November 4, 2010.
- ↑ "Time traveller's guide to Medieval Britain". Channel4.com. Retrieved November 4, 2010.
- ↑ "A millennium of health improvement". BBC News. December 27, 1998. Retrieved November 4, 2010.
- 1 2 "Expectations of Life" by H.O. Lancaster (page 8)
- 1 2 3 4 5 6 7 8 9 Pomeranz, Kenneth (2000), The Great Divergence: China, Europe, and the Making of the Modern World Economy, Princeton University Press, p. 37, ISBN 978-0-691-09010-8
- ↑ Francis, Daniel (2006). Voices and Visions: A Story of Canada. Canada: Oxford University Press. p. 21. ISBN 978-0-19-542169-9.
- ↑ Paul, Daniel N. (1993). We Were Not the Savages. Nova Scotia, Canada: Nimbus. ISBN 1552662098.
- 1 2 Prentice, Thomson. "Health, history and hard choices: Funding dilemmas in a fast-changing world" (PDF). World Health Organization: Global Health Histories. Retrieved November 4, 2010.
- ↑ http://data.worldbank.org/indicator/SP.DYN.LE00.IN
- ↑ "", Stratfordhall.org.
- ↑ "Death in Early America Archived December 30, 2010, at the Wayback Machine.". Digital History.
- ↑ "Modernization - Population Change". Encyclopædia Britannica.
- ↑ Mabel C. Buer, Health, Wealth and Population in the Early Days of the Industrial Revolution, London: George Routledge & Sons, 1926, page 30 ISBN 0-415-38218-1
- ↑ BBC—History—The Foundling Hospital. Published: May 1, 2001.
- ↑ "Gapminder World".
- ↑ CDC (1999). "Ten great public health achievements—United States, 1900–1999". MMWR Morb Mortal Wkly Rep. 48 (12): 241–3. PMID 10220250. Reprinted in: "From the Centers for Disease Control and Prevention. Ten great public health achievements—United States, 1900–1999". JAMA. 281 (16): 1481. 1999. doi:10.1001/jama.281.16.1481. PMID 10227303.
- ↑ "Life expectancy at birth, total (years)—Data".
- ↑ "World Population Prospects—The 2002 Revision", 2003, page 24
- ↑ "GHO—By category—Life expectancy—Data by country".
- ↑ "Wealth & Health of Nations". Gapminder. Retrieved 26 June 2015.
- ↑ "Life Expectancy | Visual Data". BestLifeRates.org. Retrieved 26 June 2015.
- 1 2 "Deaths: Final Data for 2010", National Vital Statistics Reports, authored by Sherry L. Murphy, Jiaquan Xu, and Kenneth D. Kochanek, volume 61, number 4, page 12, 8 May 2013
- ↑ United States Department of Health and Human Services, Office of Minority Health—Asian American/Pacific Islander Profile Archived February 4, 2012, at the Wayback Machine.. Retrieved October 1, 2013.
- ↑ "The Root Causes of Poverty". Waterfields. Retrieved 2015-03-04.
- ↑ Department of Health—Tackling health inequalities: Status report on the Programme for Action
- ↑ "Social factors key to ill health". BBC News. August 28, 2008. Retrieved August 28, 2008.
- ↑ "GP explains life expectancy gap". BBC News. August 28, 2008. Retrieved August 28, 2008.
- ↑ Fletcher, Michael A. (March 10, 2013). "Research ties economic inequality to gap in life expectancy". Washington Post. Retrieved March 23, 2013.
- ↑ "Did The Great Depression Have A Silver Lining? Life Expectancy Increased By 6.2 Years". September 29, 2009. Retrieved April 3, 2011.
- ↑ webmaster@fxtop.com, Laurent PELE. "How long will I live ? Estimate remaining life expectancy for all countries in the world".
- ↑ "The World Factbook—Central Intelligence Agency". CIA. Retrieved April 9, 2018.
- ↑ "The World Factbook—Central Intelligence Agency". CIA. Retrieved April 9, 2018.
- ↑ Kalben, Barbara Blatt. "Why Men Die Younger: Causes of Mortality Differences by Sex". Society of Actuaries", 2002, p. 17.http://www.soa.org/library/monographs/life/why-men-die-younger-causes-of-mortality-differences-by-sex/2001/january/m-li01-1-05.pdf
- ↑ Hitti, Miranda (February 28, 2005). "U.S. Life Expectancy Best Ever, Says CDC". eMedicine. WebMD. Retrieved January 18, 2011.
- ↑ "Life expectancy—care quality indicators". QualityWatch. Nuffield Trust & Health Foundation. Retrieved 16 April 2015.
- 1 2 World Health Organization (2004). "Annex Table 2: Deaths by cause, sex and mortality stratum in WHO regions, estimates for 2002" (PDF). The world health report 2004 - changing history. Retrieved November 1, 2008.
- ↑ "Telemores, sexual size dimorphism and gender gap in life expectancy". Jerrymondo.tripod.com. Retrieved November 4, 2010.
- ↑ Samaras Thomas T., Heigh Gregory H. "How human size affects longevity and mortality from degenerative diseases". Townsend Letter for Doctors & Patients. 159 (78–85): 133–139.
- ↑ Living Standards in the Past: New Perspectives on Well-Being in Asia and Europe edited by Robert C. Allen, Tommy Bengtsson, Martin Dribe
- ↑ Kalben, Barbara Blatt. Why Men Die Younger: Causes of Mortality Differences by Sex Society of Actuaries, 2002.
- ↑ "Fruit flies offer DNA clue to why women live longer". August 2, 2012 – via www.bbc.co.uk.
- ↑ Evolutionary biologist, PZ Myers Mother's Curse
- ↑ "When Did Women Start to Outlive Men?". Retrieved 2015-07-08.
- ↑ United Nations "World Population Ageing 2009"; ST/ESA/SER.A/295, Population Division, Department of Economic and Social Affairs, United Nations, New York, Oct. 2010, liv + 73 pp.
- ↑ Japan Times "Centenarians to Hit Record 44,000". The Japan Times, September 15, 2010. Okinawa 667 centenarians per 1 million inhabitants in September 2010, had been for a long time the Japanese prefecture with the largest ratio of centenarians, partly because it also had the largest loss of young and middle-aged population during the Pacific War.
- ↑ "Resident Population. National Population Estimates for the 2000s. Monthly Postcensal Resident Population, by single year of age, sex, race, and Hispanic Origin" Archived October 10, 2013, at the Wayback Machine., Bureau of the Census (updated monthly). Different figures, based on earlier assumptions (104,754 centenarians on Nov.1, 2009) are provided in "Older Americans Month: May 2010" Archived February 16, 2016, at the Wayback Machine., Bureau of the Census, Facts for Features, March 2, 2010, 5 pp.
- ↑ "Nearly 1 in 5 Americans Suffers From Mental Illness Each Year" Author Victoria Bekiempis . Publisher Newsweek. February 28, 2014
- ↑ "The global prevalence of common mental disorders" Published by International Journal of Epidemiology. March 19, 2014. doi.org/10.1093/ije/dyu038
- ↑ "Morbidity and Mortality in People With Serious Mental Illness" (PDF). National Association of State Mental Health Program Directors. 2006.
- ↑ "The Largest Health Disparity We Don’t Talk About" author Dhruv Khullar. May 30, 2018. New York Times publisher.
- ↑ "Mortality rate three times as high among mental health service users than in general population" Health and Social Care Gov. UK. 2013
- ↑ "Morbidity and Mortality in People With Serious Mental Illness" (PDF). National Association of State Mental Health Program Directors. 2006.
- ↑ Wahlbeck, Kristian; Westman, Jeanette; Nordentoft, Merete; Gissler, Mika; Laursen, Thomas Munk (December 1, 2011). "Outcomes of Nordic mental health systems: life expectancy of patients with mental disorders". Br J Psychiatry. 199 (6): 453–458. doi:10.1192/bjp.bp.110.085100. PMID 21593516 – via bjp.rcpsych.org.
- ↑ Reininghaus, Ulrich; Dutta, Rina; Dazzan, Paola; Doody, Gillian A.; Fearon, Paul; Lappin, Julia; Heslin, Margaret; Onyejiaka, Adanna; Donoghue, Kim; Lomas, Ben; Kirkbride, James B.; Murray, Robin M.; Croudace, Tim; Morgan, Craig; Jones, Peter B. (September 27, 2014). "Mortality in Schizophrenia and Other Psychoses: A 10-Year Follow-up of the ӔSOP First-Episode Cohort". Schizophr Bull. 41: sbu138. doi:10.1093/schbul/sbu138. PMC 4393685. PMID 25262443 – via schizophreniabulletin.oxfordjournals.org.
- ↑ Laursen TM, Munk-Olsen T, Vestergaard M (March 2012). "Life expectancy and cardiovascular mortality in persons with schizophrenia". Curr Opin Psychiatry. 25: 83–8. doi:10.1097/YCO.0b013e32835035ca. PMID 22249081.
- ↑ "Antipsychotics Linked to Mortality in Parkinson's". Medscape. Retrieved April 9, 2018.
- ↑ Rosenbaum Lisa (2016). "Closing the Mortality Gap — Mental Illness and Medical Care". New England Journal of Medicine. 375: 1585–1589. doi:10.1056/NEJMms1610125.
- ↑ "Inquest told" Northampton Chronicle. July 3, 2013.
- ↑ Kumar PN, Thomas B (2011). "Hyperglycemia associated with olanzapine treatment". Indian J Psychiatry. 53: 176–7. doi:10.4103/0019-5545.82562. PMC 3136028. PMID 21772658.
- ↑ "Lilly Adds Strong Warning Label to Zyprexa, a Schizophrenia Drug". The New York Times. October 6, 2007. Retrieved April 9, 2018.
- ↑ Codario, Ronald A. (October 28, 2007). "Type 2 Diabetes, Pre-Diabetes, and the Metabolic Syndrome". Springer Science & Business Media – via Google Books.
- ↑ "Antipsychotic-Related Metabolic Testing Falls Far Short". MedScape. Retrieved April 9, 2018.
- ↑ Jose Ma. J. Alvir (1993). "Clozapine-Induced Agranulocytosis -- Incidence and Risk Factors in the United States". New England Journal of Medicine. 329: 162–167. doi:10.1056/NEJM199307153290303.
- ↑ Sonnenburg, Justin Sonnenburg, Erica. "Gut Feelings–the "Second Brain" in Our Gastrointestinal Systems [Excerpt]". Scientific American. Retrieved April 9, 2018.
- ↑ Mosley, Michael, Michael (July 11, 2012). "The second brain in our stomachs". Retrieved April 9, 2018 – via www.bbc.com.
- ↑ Rege S, Lafferty T (2008). "Life-threatening constipation associated with clozapine". Australas Psychiatry. 16: 216–9. doi:10.1080/10398560701882203. PMID 18568631.
- ↑ Hibbard KR, Propst A, Frank DE, Wyse J (2009). "Fatalities associated with clozapine-related constipation and bowel obstruction: a literature review and two case reports". Psychosomatics. 50: 416–9. doi:10.1176/appi.psy.50.4.416. PMID 19687183.
- ↑ http://www.diabetes.co.uk/diabetes-life-expectancy.html
- ↑ Centers for Disease Control and Prevention
- ↑ Kiberd Bryce A., Keough-Ryan Tammy, Clase Catherine M. (2003). "Screening for prostate, breast and colorectal cancer in renal transplant recipients". American Journal of Transplantation. 3 (5): 619–625. doi:10.1034/j.1600-6143.2003.00118.x.
- ↑ Diehr Paula; et al. (2008). "Weight, mortality, years of healthy life, and active life expectancy in older adults". Journal of the American Geriatrics Society. 56 (1): 76–83. doi:10.1111/j.1532-5415.2007.01500.x.
- ↑ Williams G (1957). "Pleiotropy, natural selection, and the evolution of senescence". Evolution. Society for the Study of Evolution. 11 (4): 398–411. doi:10.2307/2406060. JSTOR 2406060.
- ↑ Austad SN (1993). "Retarded senescence in an insular population of Virginia opossums". J. Zool. Lond. 229 (4): 695–708. doi:10.1111/j.1469-7998.1993.tb02665.x.
- ↑ Reznick DN, Bryant MJ, Roff D, Ghalambor CK, Ghalambor DE (2004). "Effect of extrinsic mortality on the evolution of senescence in guppies". Nature. 431 (7012): 1095–1099. doi:10.1038/nature02936. PMID 15510147.
- ↑ Mitteldorf J, Pepper J (2007). "How can evolutionary theory accommodate recent empirical results on organismal senescence?". Theory in Biosciences. 126 (1): 3–8. doi:10.1007/s12064-007-0001-0. PMID 18087751.
- ↑ Kirkwood TE (1977). "Evolution of aging". Nature. 270 (5635): 301–304. doi:10.1038/270301a0. PMID 593350.
- ↑ Hulbert, A. J.; Pamplona, Reinald; Buffenstein, Rochelle; Buttemer, W. A. (October 1, 2007). "Life and Death: Metabolic Rate, Membrane Composition, and Life Span of Animals". Physiol. Rev. 87 (4): 1175–1213. doi:10.1152/physrev.00047.2006. PMID 17928583 – via physrev.physiology.org.
- ↑ Olshansky, S J; Rattan, Suresh IS (July 25, 2009). "What Determines Longevity: Metabolic Rate or Stability?". 5 (28).
- ↑ Aguilaniu, Hugo; Durieux, Jenni; Dillin, Andrew (October 15, 2005). "Metabolism, ubiquinone synthesis, and longevity". Genes Dev. 19 (20): 2399–2406. doi:10.1101/gad.1366505. PMID 16230529 – via genesdev.cshlp.org.
- ↑ "The Longevity Secret for Tortoises Is Held In Their Low Metabolism Rate". Archived from the original on November 12, 2013.
- ↑ Ricklefs RE, Cadena CD (2007). "Lifespan is unrelated to investment in reproduction in populations of mammals and birds in captivity". Ecol. Lett. 10 (10): 867–872. doi:10.1111/j.1461-0248.2007.01085.x. PMID 17845285.
- ↑ Anderson, Robert N. (1999) Method for constructing complete annual U.S. life tables. Vital and health statistics. Series 2, Data evaluation and methods research; no. 129 (DHHS publication no. (PHS) 99-1329) PDF
- ↑ Linda J Young; Jerry H Young (1998) Statistical ecology: a population perspective. Kluwer Academic Publishers, p. 310
- ↑ R. Cunningham; T. Herzog; R. London (2008). Models for Quantifying Risk (Third ed.). Actex. ISBN 978-1-56698-676-2. page 92.
- ↑ Ronald D. Lee and Lawrence Carter. 1992. "Modeling and Forecasting the Time Series of U.S. Mortality," Journal of the American Statistical Association 87 (September): 659-671.
- ↑ "WHO | Health Status Statistics: Mortality". www.who.int. Retrieved 2018-03-10.
- ↑ "The Lee-Carter Method for Forecasting Mortality, with Various Extensions and Applications - SOA" (PDF). SOA. Retrieved April 9, 2018.
- ↑ "International Human Development Indicators—UNDP". Hdrstats.undp.org. Archived from the original on April 20, 2009. Retrieved November 4, 2010.
- ↑ Has the relation between income inequality and life expectancy disappeared? Evidence from Italy and top industrialised countries Archived January 9, 2015, at the Wayback Machine. J Epidemiol Community Health 2005;59:158–162.
- ↑ Inequality in income and mortality in the United States: analysis of mortality and potential pathways BMJ 1996, 312:999.
- ↑ Wanjek, Christopher (2002). Bad Medicine: Misconceptions and Misuses Revealed, from Distance Healing to Vitamin O. Wiley. pp. 70–71. ISBN 0-471-43499-X.
- ↑ Wanjek, Christopher (2002), Bad Medicine: Misconceptions and Misuses Revealed, from Distance Healing to Vitamin O, Wiley, pp. 70–71, ISBN 047143499X.
- ↑ Wanjek, Christopher (2002), Bad Medicine: Misconceptions and Misuses Revealed, from Distance Healing to Vitamin O, Wiley, pp. 70–72, ISBN 047143499X.
- ↑ Wanjek, Christopher (2002). Bad Medicine: Misconceptions and Misuses Revealed, from Distance Healing to Vitamin O. Wiley. p. 71. ISBN 0-471-43499-X.
- ↑ Frier, "Demography", 789.
- ↑ Plymouth Plantation; "Dead at Forty"
- ↑ Life Expectancy by Age, 1850–2004
Further reading
- Leonid A. Gavrilov & Natalia S. Gavrilova (1991), The Biology of Life Span: A Quantitative Approach. New York: Harwood Academic Publisher, ISBN 3-7186-4983-7
- Kochanek, Kenneth D., Elizabeth Arias, and Robert N. Anderson (2013), How Did Cause of Death Contribute to Racial Differences in Life Expectancy in the United States in 2010?. Hyattsville, Md.: U.S. Department of Health and Human Services, Centers for Disease Control and Prevention, National Center for Health Statistics.
- Frier, Bruce W. "Demography", in Alan K. Bowman, Peter Garnsey, and Dominic Rathbone, eds., The Cambridge Ancient History XI: The High Empire, A.D. 70–192, (Cambridge: Cambridge University Press, 2000), 827–54.
External links
| Wikimedia Commons has media related to Life expectancy. |
- Charts for all countries
- Our World In Data – Life Expectancy—Visualizations of how life expectancy around the world has changed historically (by Max Roser). Includes life expectancy for different age groups. Charts for all countries, world maps, and links to more data sources.
- Global Agewatch has the latest internationally comparable statistics on life expectancy from 195 countries.
- Rank Order—Life expectancy at birth from the CIA's World Factbook.
- CDC year-by-year life expectancy figures for USA from the USA Centers for Disease Controls and Prevention, National Center for Health Statistics.
- Life expectancy in Roman times from the University of Texas.
- Animal lifespans: Animal Lifespans from Tesarta Online (Internet Archive); The Life Span of Animals from Dr Bob's All Creatures Site.