Demographics of Tanzania
| Total population | |
|---|---|
|
56,376,403 (2017 census) Diaspora est. 3.7million[1] | |
| Regions with significant populations | |
| 35,000 | |
| 20,308[2] | |
| 19,500[3] | |
| 1,500[3] | |
| 900[3] | |
| 900[3] | |
| 700[3] | |
| 500[3] | |
| 500[3] | |
| 300 | |
| Languages | |
| Kiswahili, English and Regional languages | |
| Religion | |
| Christianity, Islam and Indigenous beliefs | |
| Part of a series on the |
| Culture of Tanzania |
|---|
 |
| History |
| People |
| Languages |
| Religion |
|
Music and performing arts |
| Sport |
|
Monuments |
|
Symbols |
|
This article is about the demographic features of the population of Tanzania, including population density, ethnicity, education level, health of the populace, economic status, religious affiliations, and other aspects of the population.
The population distribution in Tanzania is extremely uneven. Most people live on the northern border or the eastern coast, with much of the remainder of the country being sparsely populated.[4]:page 1252 Density varies from 12 per square kilometre (31/sq mi) in the Katavi Region to 3,133 per square kilometre (8,110/sq mi) in Dar es Salaam.[5]:page 6 Approximately 70 percent of the population is rural, although this percentage has been declining since at least 1967.[6] Dar es Salaam is the de facto capital and largest city. Dodoma, located in the centre of Tanzania, is the de jure capital, although action to move government buildings to Dodoma has stalled..
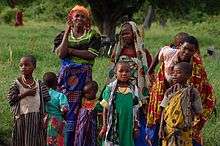
The population consists of about 125 ethnic groups.[7] The Sukuma, Nyamwezi, Chagga, and Haya peoples have more than 1 million members each.[8]:page 4
Over 100 different languages are spoken in Tanzania, making it the most linguistically diverse country in East Africa.[9] Among the languages spoken in Tanzania are all four of Africa's language families: Bantu, Cushitic, Nilotic, and Khoisan.[9] Swahili and English are Tanzania's official languages.[9] Swahili belongs to the Bantu branch of the Niger-Congo family.[10] The Sandawe people speak a language that may be related to the Khoe languages of Botswana and Namibia, while the language of the Hadzabe people, although it has similar click consonants, is arguably a language isolate.[11] The language of the Iraqw people is Cushitic.[12] Other languages are Indian languages and Portuguese (spoken by Goans and Mozambicans).
Although much of Zanzibar's native population came from the mainland, one group known as Shirazis traces its origins to the island's early Persian settlers. Non-Africans residing on the mainland and Zanzibar account for 1 percent of the total population. The Asian community, including Hindus, Sikhs, Shi'a and Sunni Muslims, Parsis, and Goans, has declined by 50 percent in the 2000s and early 2010s to 50,000 on the mainland and 4,000 on Zanzibar. An estimated 70,000 Arabs and 20,000 Europeans (90 percent of which are from the British diaspora) reside in Tanzania.
Based on 1999–2003 data, over 74,000 Tanzanian-born people were living in Organization for Economic Co-operation and Development countries, with 32,630 residing in the United Kingdom; 19,960 in Canada; 12,225 in the United States; 1,714 in Australia; 1,180 in the Netherlands; and 1,012 in Sweden.[13]
Population

According to the 2012 census, the total population was 44,928,923 compared to 12,313,469 in 1967,[5]:page 1 resulting in an annual growth rate of 2.9 percent. The under 15 age group represented 44.1 percent of the population, with 35.5 percent being in the 15–35 age group, 52.2 percent being in the 15–64 age group, and 3.8 percent being older than 64.[14]
According to the 2012 revision of the World Population Prospects, children below the age of 15 constituted 44.8 percent of the total population, with 52.0 percent aged 15–64 and 3.1 percent aged 65 or older.[15]
| Total population[15] | Population aged 0–14 (%)[15] | Population aged 15–64 (%)[15] | Population aged 65+ (%)[15] | |
|---|---|---|---|---|
| 1950 | 7,650,000 | 46.0 | 51.8 | 2.2 |
| 1955 | 8,741,000 | 45.7 | 52.0 | 2.3 |
| 1960 | 10,074,000 | 45.8 | 51.8 | 2.4 |
| 1965 | 11,683,000 | 45.8 | 51.7 | 2.4 |
| 1970 | 13,605,000 | 46.2 | 51.3 | 2.5 |
| 1975 | 15,978,000 | 46.4 | 51.1 | 2.6 |
| 1980 | 18,687,000 | 46.5 | 50.8 | 2.6 |
| 1985 | 21,850,000 | 46.4 | 51.0 | 2.7 |
| 1990 | 25,485,000 | 46.0 | 51.3 | 2.7 |
| 1995 | 29,944,000 | 45.3 | 51.9 | 2.8 |
| 2000 | 34,021,000 | 44.8 | 52.3 | 2.9 |
| 2005 | 38,824,000 | 44.6 | 52.4 | 3.0 |
| 2010 | 44,793,000 | 44.8 | 52.0 | 3.1 |
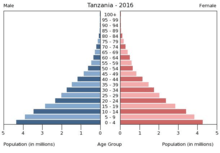
Structure of the population [16]
Structure of the population (01.07.2013) (Estimates) :
| Age Group | Male | Female | Total | % |
|---|---|---|---|---|
| Total | 23 267 957 | 23 864 623 | 47 132 580 | 100 |
| 0-4 | 4 191 004 | 4 121 103 | 8 312 107 | 17,64 |
| 5-9 | 3 608 891 | 3 551 955 | 7 160 846 | 15,19 |
| 10-14 | 2 735 494 | 2 728 687 | 5 464 181 | 11,59 |
| 15-19 | 2 494 983 | 2 490 960 | 4 985 943 | 10,58 |
| 20-24 | 2 179 173 | 2 160 970 | 4 340 143 | 9,21 |
| 25-29 | 1 730 600 | 1 754 007 | 3 484 607 | 7,39 |
| 30-34 | 1 289 114 | 1 563 083 | 2 852 197 | 6,05 |
| 35-39 | 1 207 182 | 1 394 428 | 2 601 610 | 5,52 |
| 40-44 | 1 032 605 | 1 088 697 | 2 121 302 | 4,50 |
| 45-49 | 770 149 | 797 868 | 1 568 017 | 3,33 |
| 50-54 | 604 621 | 629 580 | 1 234 201 | 2,62 |
| 55-59 | 422 141 | 459 343 | 881 484 | 1,87 |
| 60-64 | 347 604 | 387 334 | 734 938 | 1,56 |
| 65-69 | 223 365 | 243 517 | 466 882 | 0,99 |
| 70-74 | 179 960 | 207 795 | 387 755 | 0,82 |
| 75-79 | 115 076 | 130 796 | 245 872 | 0,52 |
| 80+ | 135 995 | 154 500 | 290 495 | 0,62 |
| Age group | Male | Female | Total | Percent |
|---|---|---|---|---|
| 0-14 | 10 535 389 | 10 401 745 | 20 937 134 | 44,42 |
| 15-64 | 12 078 172 | 12 726 270 | 24 804 442 | 52,63 |
| 65+ | 654 396 | 736 608 | 1 391 004 | 2,95 |
Vital statistics
The Tanzanian Demographic and Health Survey 2010 estimated that the infant mortality rate for 2005–10 was 51.[17] Registration of other vital events in Tanzania is not complete. The Population Department of the United Nations prepared the following estimates.[15]
| Period | Live births per year | Deaths per year | Natural change per year | CBR* | CDR* | NC* | TFR* | IMR* |
|---|---|---|---|---|---|---|---|---|
| 1950-1955 | 402,000 | 184,000 | 218,000 | 49.0 | 22.4 | 26.6 | 6.74 | 153 |
| 1955-1960 | 464,000 | 198,000 | 267,000 | 49.3 | 21.0 | 28.3 | 6.80 | 143 |
| 1960-1965 | 535,000 | 218,000 | 322,000 | 49.1 | 20.1 | 29.0 | 6.80 | 136 |
| 1965-1970 | 616,000 | 239,000 | 384,000 | 48.7 | 18.9 | 29.8 | 6.79 | 128 |
| 1970-1975 | 709,000 | 258,000 | 475,000 | 48.0 | 17.5 | 30.5 | 6.75 | 119 |
| 1975-1980 | 821,000 | 275,000 | 542,000 | 47.4 | 15.9 | 31.5 | 6.73 | 109 |
| 1980-1985 | 932,000 | 307,000 | 633,000 | 46.0 | 15.2 | 30.8 | 6.55 | 104 |
| 1985-1990 | 1,061,000 | 348,000 | 727,000 | 44.8 | 14.7 | 30.1 | 6.36 | 102 |
| 1990-1995 | 1,197,000 | 423,000 | 892,000 | 43.2 | 15.3 | 27.9 | 6.05 | 102 |
| 1995-2000 | 1,336,000 | 480,000 | 815,000 | 41.8 | 15.0 | 26.8 | 5.75 | 92 |
| 2000-2005 | 1,522,000 | 492,000 | 961,000 | 41.8 | 13.5 | 28.3 | 5.66 | 77 |
| 2005-2010 | 1,744,000 | 454,000 | 1,230,000 | 41.6 | 10.8 | 30.2 | 5.58 | 61 |
| * CBR = crude birth rate (per 1000); CDR = crude death rate (per 1000); NC = natural change (per 1000); TFR = total fertility rate (number of children per woman); IMR = infant mortality rate per 1000 births | ||||||||
Births and deaths [16]
| Year | Population | Live births | Deaths | Natural increase | Crude birth rate | Crude death rate | Rate of natural increase | TFR |
|---|---|---|---|---|---|---|---|---|
| 2009 | 1 667 889 | 577 393 | 1 090 496 | |||||
| 2010 | 1 678 325 | 573 213 | 1 105 122 | |||||
| 2011 | 1 687 203 | 565 099 | 1 122 104 | |||||
| 2012 | 44 928 923 | 1 694 943 | 555 975 | 1 138 968 | 5.2 | |||
Life expectancy
| Period | Life expectancy in Years[18] |
|---|---|
| 1950–1955 | 41.25 |
| 1955–1960 | |
| 1960–1965 | |
| 1965–1970 | |
| 1970–1975 | |
| 1975–1980 | |
| 1980–1985 | |
| 1985–1990 | |
| 1990–1995 | |
| 1995–2000 | |
| 2000–2005 | |
| 2005–2010 | |
| 2010–2015 |
Population
Source:[19]
| Region | 1967 (Population / Crude Birth Rate / Total Fertility Rate) | 1978 (Population / Crude Birth Rate / Total Fertility Rate) | 1988 (Population / Crude Birth Rate / Total Fertility Rate) | 2002 (Population / Crude Birth Rate / Total Fertility Rate) | 2012 (Population / Crude Birth Rate / Total Fertility Rate) |
|---|---|---|---|---|---|
| Tanzania, including Zanzibar | 12,313,469 / 47 / 7.3 | 17,036,499 / 49 / 6.3 | 22,455,207 / 47 / 5.4 | 33,461,849 / 43 / 4.2 | 44,928,923 / / |
| Zanzibar | 354,815 / 48 / 7.3 | 476,111 / 48 / 7.1 | 640,675 / 49 / 6.4 | 981,754 / 43 / 4.5 | 1,303,569 / / |
Fertility and Births (Demographic and Health Surveys)
Total Fertility Rate (TFR) (Wanted Fertility Rate) and Crude Birth Rate (CBR):[20]
| Year | CBR (Total) | TFR (Total) | CBR (Urban) | TFR (Urban) | CBR (Rural) | TFR (Rural) | CBR (Zanzibar) | TFR (Zanzibar) |
|---|---|---|---|---|---|---|---|---|
| 1991-1992 | 42.8 | 6.25 (5.57) | 42.1 | 5.14 | 43.0 | 6.59 (5.91) | ||
| 1996 | 40.8 | 5.82 (5.1) | 36.3 | 4.11 (3.5) | 41.9 | 6.34 (5.5) | ||
| 1999 | 41.4 | 5.55 (4.8) | 34.4 | 3.16 (2.9) | 43.5 | 6.48 (5.5) | ||
| 2004-2005 | 42.4 | 5.7 (4.9) | 34.6 | 3.6 (3.1) | 44.8 | 6.5 (5.6) | 38.0 | 5.3 (4.6) |
| 2010 | 38.1 | 5.4 (4.7) | 35.0 | 3.7 (3.3) | 39.0 | 6.1 (5.3) | 35,9 | 5.1 (4.8) |
| 2015-16 | 37.2 | 5.2 (4.5) | 35.1 | 3.8 (3.4) | 38.1 | 6.0 (5.1) | 36.3 | 5.1 (4.6) |
Total fertility rate in Tanzania
Fertility rates are estimated by Surveys (TDHS) and Census in different times. TDHS surveys estimated these fertility rates :6.3 (1991–92), 5.8 (1996), 5.7 (2004–05), 5.4 (2010) and 2002 Census said 6.3 [21]
| Region | 1967[22] | 1978[22] | 1988[22] | 2002[22] | 2006-09[17] |
|---|---|---|---|---|---|
| Tanzania (country total) | 7.3 | 6.3 | 5.4 | 4.2 | 5.4 |
| Dodoma (capital) | 7.6 | 6.2 | 5.9 | 4.5 | |
| Arusha | 7.5 | 7.0 | 6.0 | 3.4 | |
| Kilimanjaro | 8.9 | 7.5 | 5.8 | 3.4 | |
| Tanga | 7.7 | 6.2 | 5.1 | 3.7 | |
| Morogoro | 6.2 | 6.5 | 4.3 | 3.6 | |
| Pwani | 5.8 | 6.1 | 5.4 | 3.7 | |
| Dar es Salaam | 5.0 | 5.4 | 3.4 | 1.9 | |
| Lindi | - | 5.4 | 4.6 | 3.1 | |
| Mtwara | 5.7 | 4.9 | 4.5 | 3.1 | |
| Ruvuma | 7.1 | 6.1 | 5.0 | 3.6 | |
| Iringa | 7.8 | 6.3 | 4.9 | 3.6 | |
| Mbeya | 8.1 | 6.3 | 4.7 | 3.5 | |
| Singida | 6.3 | 5.9 | 5.7 | 4.8 | |
| Tabora | 6.7 | 6.0 | 5.4 | 4.9 | |
| Rukwa | - | 6.1 | 6.2 | 5.0 | |
| Kigoma | 6.6 | 7.2 | 6.5 | 5.5 | |
| Shinyanga | 8.7 | 6.9 | 6.3 | 5.6 | |
| Kagera | 7.5 | 7.3 | 6.9 | 5.4 | |
| Mwanza | 8.1 | 7.1 | 6.1 | 5.0 | |
| Mara | 8.0 | 6.9 | 5.9 | 5.9 | |
| Manyara | - | - | - | 4.9 | |
| Tanzania Mainland | 7.3 | 6.3 | 5.4 | 4.2 | 5.4 |
| North Unguja | - | 7.1 | 7.0 | 4.9 | |
| South Unguja | - | 6.2 | 6.5 | 4.2 | |
| Urban West | - | 6.1 | 5.2 | 3.6 | |
| North Pemba | - | 8.3 | 6.9 | 5.7 | |
| South Pemba | - | 8.2 | 7.6 | 5.8 | |
| Tanzania Zanzibar | 7.3 | 7.1 | 6.4 | 4.5 | 5.1 |
CIA World Factbook demographic statistics
The following demographic statistics are from the CIA World Factbook, unless otherwise indicated.[23]
Population
- 48,261,942 (July 2013 estimate)
Note: Estimates for this country explicitly take into account the effects of excess mortality due to AIDS; this can result in lower life expectancy, higher infant mortality, higher death rates, lower population growth rates, and changes in the distribution of population by age and sex than would otherwise be expected.
Median age
total: 17.3 years
male: 17.0 years
female: 17.6 years (2013 estimate)
Sex ratio
at birth: 1.03 male(s)/female
0-14 years: 1.02 male(s)/female
15–54 years: 1.00 male(s)/female
55-64 years: 0.75 male(s)/female
65 years and over: 0.76 male(s)/female
total population: 0.99 male(s)/female (2013 estimate)
Life expectancy at birth
total population: 60.76 years
male: 59.48 years
female: 62.09 years (2013 estimate)
HIV/AIDS
Age 15-49 HIV infection rates:
- 5.1 percent overall,[24] with 6.2 percent of women[25] and 3.8 percent of men[26] being infected.[27]
People living with HIV/AIDS:
- 1.6 million (2011 estimate)[28]
Deaths:
- 86,000 (2009 estimate)
Languages
Literacy
definition:
age 15 and over can read and write Swahili, English, or Arabic
total population: 69.4%
male: 77.5%
female: 62.2% (2003 est.)
Religions
Most Tanzanians are nowadays Christians and Muslims. The numerical relationship between followers of the two religions is regarded as politically sensitive and questions about religious affiliation have not been included in census questionnaires since 1967.
For many years estimates have been repeated that about a third of the population each follows Islam, Christianity and traditional religions.[30] As there is likely no longer such a large percentage of traditional religionists,[31] a range of competing estimates has been published giving one side or the other a large share or trying to show equal shares.
Estimates from the Pew Report Islam and Christianity (2010) were 60% Christian and 36% Muslim.[32]
The remainder of the population are Hindus, Buddhists, animists, and unaffiliated. Most Christians are Roman Catholic, Lutheran or Seventh-Day Adventist, though a number of other Pentecostal churches, Anglicans, and Eastern Orthodox Christians are also represented in the country. Most Tanzanian Muslims are Sunni, though there are also populations of Ibadi, Shia, Ahamadiya, Bohora, and Sufi. Muslims are concentrated in coastal areas and in mainland areas along former caravan trade routes.
See also
References
| Wikimedia Commons has media related to Demographics of Tanzania. |
- ↑ "IOM launches project to engage Tanzanian diaspora". IOM. 28 January 2014. Archived from the original on 2014-05-29. Retrieved 2014-05-29.
- ↑ "SELECTED POPULATION PROFILE IN THE UNITED STATES more information 2009-2011 American Community Survey 3-Year Estimate". United States Census Bureau. Archived from the original on 2014-08-15. Retrieved 2014-05-29.
- 1 2 3 4 5 6 7 "Connecting with Emigrants: A Global Profile of Diasporas: Key statistics on diaspora from Tanzania". OECD Publishing. Retrieved 2014-05-29.
- ↑ "Economy", authored by Joseph Lake, in Africa South of the Sahara, edited by Europa Publications and Iain Frame, Routledge, 2013
- 1 2 Population Distribution by Administrative Units, United Republic of Tanzania, 2013 Archived May 2, 2013, at the Wayback Machine.
- ↑ "Report reveals rapid rural-urban migration", The Citizen, reported by Athuman Mtulya, 26 September 2013
- ↑ Levinson, David (26 August 1998). "Ethnic Groups Worldwide: A Ready Reference Handbook". Oryx Press – via Google Books.
- ↑ Otiso, Kefa M. (24 January 2013). "Culture and Customs of Tanzania". ABC-CLIO – via Google Books.
- 1 2 3 "East Africa", authored by Silvester Ron Simango, in Sociolinguistics: Regional overview, edited by Ulrich Ammon, published by Walter de Gruyter, 2006, pages 1966-7
- ↑ "Swahili - A language of Tanzania". Ethnologue. Retrieved 9 February 2014.
- ↑ Blench, Roger (22 June 2006). "Archaeology, Language, and the African Past". Rowman Altamira – via Google Books.
- ↑ "Iraqw", Ethnologue: Languages of the World, edited by M. Paul Lewis, Gary F. Simons, and Charles D. Fennig, SIL International, Seventeenth edition, Dallas, Texas, USA, accessed 14 October 2014
- ↑ "Country-of-birth database". Organisation for Economic Co-operation and Development. Archived from the original on 17 June 2009. Retrieved 10 July 2013.
- ↑ "Tanzania in figures 2012, National Bureau of Statistics, Ministry of Finance, June 2013, page 23" (PDF). Archived from the original (PDF) on 2013-11-26.
- 1 2 3 4 5 6 "World Population Prospects - Population Division - United Nations". esa.un.org.
- 1 2 "United Nations Statistics Division - Demographic and Social Statistics". unstats.un.org.
- 1 2 Tanzania Demographic and Health Survey 2010, Tanzania National Bureau of Standards, funding provided by the Ministry of Health and Social Welfare (Tanzania), Tanzania Food and Nutrition Centre, Department for International Development (United Kingdom), World Health Organization/Zanzibar, United Nations Fund for Population Activities, United Nations Children's Fund, World Food Programme, United Nations Development Programme, and Irish Aids, technical assistance provided by ICF Macro through its MEASURE DHS programme, survey conducted 19 December 2010 to 23 May 2011, with results applying to the preceding three-year period Archived September 13, 2012, at the Wayback Machine.
- ↑ "World Population Prospects - Population Division - United Nations". esa.un.org. Retrieved 2018-08-26.
- ↑ "Analytical Report, 2002 Census, United Republic of Tanzania" (PDF).
- ↑ "MEASURE DHS: Demographic and Health Surveys". microdata.worldbank.org.
- ↑ "Archived copy" (PDF). Archived from the original (PDF) on 2012-09-13. Retrieved 2012-01-02.
- 1 2 3 4 "2002 Census, United Republic of Tanzania" (PDF).
- ↑ "The World Factbook — Central Intelligence Agency". www.cia.gov.
- ↑ At a 95 percent confidence level, the rate was 4.6 to 5.6 percent. Refer to page 202 of the survey.
- ↑ At a 95 percent confidence level, the rate was 5.5 to 6.8 percent. Refer to page 202 of the survey.
- ↑ At a 95 percent confidence level, the rate was 3.2 to 4.5 percent. Refer to page 202 of the survey.
- ↑ "Tanzania HIV/AIDS and Malaria Indicator Survey 2011-12, authorized by the Tanzania Commission for AIDS (TACAIDS) and the Zanzibar Commission for AIDS; implemented by the Tanzania National Bureau of Statistics in collaboration with the Office of the Chief Government Statistician (Zanzibar); funded by the United States Agency for International Development, TACAIDS, and the Ministry of Health and Social Welfare, with support provided by ICF International; data collected 16 December 2011 to 24 May 2012; report published in Dar es Salaam in March 2013". Archived from the original on 20 October 2014.
- ↑ "UNAIDS World AIDS Day Report 2012, Joint United Nations Programme on HIV/AIDS, page 7" (PDF).
- 1 2 3 "Africa :: TANZANIA". CIA The World Factbook.
- ↑ So repeated here: (USA government), Central Intelligence Agency. "The World Fact Book". Retrieved 25 May 2014.
- ↑ note continued adherence to traditional beliefs also among Christians and Muslims:"(In Tanzania) more than half the people surveyed believe that sacrifices to ancestors or spirits can protect them from harm." see Pew report Christians and Muslims in Subsaharan Africa (2010)
- ↑ "Islam and Christianity in Subsaharan Africa (2010)" (PDF). Pew Research Center’s Forum on Religion & Public Life.