Demographics of China
| Demographics of China | |
|---|---|
 Population of China since 1960 | |
| Population |
|
| Growth rate |
|
| Birth rate | 12.95 births per 1,000 (2016 est.) |
| Death rate | 7.06 deaths per 1,000 (2016 est.) |
| Life expectancy |
|
| • male |
|
| • female |
|
| Fertility rate | 1.60 children per woman (2017 est.) |
| Infant mortality rate | 12.2 deaths per 1000 live births (2015) |
| Age structure | |
| 0–14 years | 17.15% (2015 est.) |
| 15–64 years | 72.04% (2015 est.) |
| 65 and over | 10.81% (2015 est.) |
| Sex ratio | |
| At birth | 1.14 male to female (2016 est.) |
| Under 15 | 1.14 male to female (2015 est.) |
| 15–64 years | 1.05 male to female (2015 est.) |
| 65 and over | 0.90 male to female (2015 est.) |
| Nationality | |
| Nationality | noun: Chinese adjective: Chinese |
| Major ethnic | Han Chinese |
| Minor ethnic | Zhuang, Manchu, Hui, Miao, Uyghurs, Yi, Tujia, Inner Mongols, Tibetan, Buyei, Dong, Yao, Korean, Bai, Hani, Li, Kazak, Dai, She, Lisu, Gelao, Lahu, Dongxiang, Va, Sui, Nakhi, Qiang, Tu, Xibe, Mulao, Kyrgyz, Daur, Jingpo, Salar, Blang, Maonan, Tajik, Pumi, Achang, Nu, Ewenki, Gin, Jino, De'ang, Uzbeks, Russian, Yugur, Bonan, Monba, Oroqen, Derung, Tatars, Hezhen, Lhoba |
| Language | |
| Official | Mandarin |
| Spoken | Wu (Shanghainese), Yue (Cantonese), Min (Minnan, Mindong, others), Xiang, Gan, Hakka, various Mandarin dialects and Patuá |
The demographics of China are identified by a large population with a relatively small youth division, which was partially a result of China's one-child policy, which was modified to a two-child policy in 2015. China's population reached the billion mark in 1982.
China's population is 1.411 billion[1], the largest of any country in the world. According to the 2010 census, 91.51% of the population was Han Chinese, and 8.49% were minorities. China's population growth rate is only 0.59%, ranking 159th in the world.[2] China conducted its sixth national population census on 1 November 2010.[3] Unless otherwise indicated, the statistics on this page pertain to mainland China only; see also Demographics of Hong Kong and Demographics of Macau.
Population
Historical population
The population of China fluctuated between 30 million and 86 million during the Han dynasty.
After the collapse of the Han Dynasty, the population stayed around 50 million until the advent of the Tang Dynasty.
Under the Tang Dynasty, the population increased from 45 million to 80 million over the course of 200 years.
At the beginning of the Song Dynasty, the population stood at over 100 million.
After Ming and earlier period of Qing dynasty founded population moved around 100 million to 150 million until 1700s.
In the period between 1749 and 1851, the population doubled in a century.
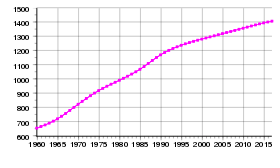
During 1960-2015, the population became nearly 1.4 billion. And specially Population in 1949 540 million to 1982 1.03 billion which doubled during Mao. And growth slowed down cause of One - Child policy except Eco generation mid-late 1980 to early 1990s. [4]
Census data
| Dynasty | Year | Households | Population | Modern estimates | Share of World population |
|---|---|---|---|---|---|
| Warring States | -400 | 43,740,000 | 27% | ||
| Qin | -200 | 42,000,000 | 28% | ||
| Western Han | 1 | 12,366,470 | 59,594,979 | 65,000,000 | 30% |
| Eastern Han | 156 | 16,070,906 | 50,068,856 | 65,000,000 | 31% |
| Easter Han - Three Kingdomes | 200 | 60,800,000 | 32% | ||
| Three Kingdoms | 280 | 6,801,000 | 8,200,000 | 37,986,000 | 20% |
| Western Jin | 300 | 35,000,000 | 18% | ||
| Northern and Southern dynasties | 400 | 51,300,000 | 27% | ||
| Northern and Southern dynasties | 500 | 51,300,000 | 27% | ||
| Sui | 600 | 8,700,000 | 44,500,000 | 46,000,000 | 23% |
| Tang | 700 | 6,156,141 | 37,140,000 | 48,300,000 | 23% |
| Tang | 755 | 8,914,709 | 52,919,309 | 90,000,000 | 42% |
| Tang | 800 | 50,600,000 | 23% | ||
| Five Dynasties and Ten Kingdoms | 900 | 39,000,000 | 16% | ||
| Song | 1000 | 60,950,000 | 23% | ||
| Song(North) | 1100 | 110,750,000 | 35% | ||
| Song(South) | 1200 | 140,000,000 | 39% | ||
| Yuan | 1290 | 13,196,206 | 58,834,711 | 75,306,000 | 21% |
| Yuan | 1351 | 27,650,000 | 87,587,000 | 120,359,000 | 34% |
| Ming | 1393 | 10,699,399 | 58,323,934 | 65,000,000 | 19% |
| Ming | 1400 | 11,415,829 | 66,598,339 | 81,000,000 | 23% |
| Ming | 1500 | 10,508,935 | 60,105,835 | 110,000,000 | 26% |
| Ming | 1550 | 10,621,436 | 60,692,856 | 145,000,000 | 30% |
| Ming | 1600 | 197,000,000 | 36% | ||
| Qing | 1650 | 123,000,000 | 140,000,000 | 26% | |
| Qing | 1700 | 126,110,000 | 160,000,000 | 26% | |
| Qing | 1750 | 181,810,000 | 225,000,000 | 37% | |
| Qing | 1800 | 332,181,400 | 330,000,000 | 37% | |
| Qing | 1850 | 430,000,000 | 436,100,000 | 36% | |
|
Republic of China |
1928 | 474,780,000 | 474,780,000 | 24% | |
| People's republic of China | 1950 | 546,815,000 | 552,000,000 | 22% | |
| People's republic of China | 1975 | 916,395,000 | 920,940,000 | 23% | |
| People's republic of China | 2000 | 1,262,645,000 | 1,283,190,000 | 21% | |
| People's republic of China | 2005 | 1,303,720,000 | 1,321,620,000 | 20% | |
| People's republic of China | 2010 | 1,337,825,000 | 1,359,760,000 | 20% | |
| People's republic of China | 2015 | 1,374,620,000 | 1,397,030,000 | 19% |
Censuses in China
The People's Republic of China conducted censuses in 1953, 1964, 1982, 2000, and 2010. In 1987, the government announced that the fourth national census would take place in 1990 and that there would be one every ten years thereafter. The 1982 census (which reported a total population of 1,008,180,738) is generally accepted as significantly more reliable, accurate, and thorough than the previous two. Various international organizations eagerly assisted the Chinese in conducting the 1982 census, including the United Nations Fund for Population Activities, which donated US$15.6 million for the preparation and execution of the census.
China has been the world's most populous nation for many centuries. When China took its first post-1949 census in 1953, the population stood at 583 million; by the fifth census in 2000, the population had more than doubled, reaching 1.2 billion.
By the sixth census in 2010, the total population had reached to 1,370,536,875, with the mainland having 1,339,724,852, Hong Kong having 7,097,600, and Macau having 552,300.
Population of China by age and sex (demographic pyramid)
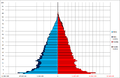 China population pyramid as of 1st National Census day on June 30, 1953
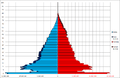 China population pyramid as of 2nd National Census day on July 1, 1964
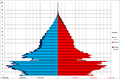 China population pyramid as of 3rd National Census day on July 1, 1982
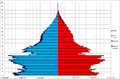 China population pyramid as of 4th National Census day on July 1, 1990
 China population pyramid in 2009
 China population pyramid as of 2016
| Province or autonomous region |
census 1953 | census 1964 | census 1982 | census 1990 | census 2000 | census 2010 | ||||||
|---|---|---|---|---|---|---|---|---|---|---|---|---|
| Number | % | Number | % | Number | % | Number | % | Number | % | Number | % | |
| Beijing Municipality | 3,768,149 | 1.48 | 8,568,495 | 9.09 | 9,230,687 | 3.92 | 11,819,407 | 0.95 | 13,820,000 | 1.09 | 19,612,368 | 1.46 |
| Hebei | 35,984,644 | 6.18 | 49,687,781 | 6.58 | 53,005,876 | 5.26 | 61,082,439 | 5.39 | 67,440,000 | 5.33 | 79,854,202 | 5.36 |
| Tianjin Municipality | 2,693,831 | 0.46 | 7,764,141 | 0.77 | 8,785,402 | 0.77 | 10,010,000 | 0.79 | 12,938,224 | 0.97 | ||
| Shanxi | 14,314,485 | 2.46 | 18,015,067 | 2.59 | 25,291,389 | 2.51 | 28,759,014 | 2.54 | 32,970,000 | 2.60 | 35,712,111 | 2.67 |
| Inner Mongolia Autonomous Region | 6,100,104 | 1.05 | 12,348,638 | 1.78 | 19,274,279 | 1.91 | 21,456,798 | 1.89 | 23,760,000 | 1.88 | 24,706,321 | 1.84 |
| Rehe (now defunct) | 5,160,822 | 0.89 | ||||||||||
| Liaoning | 18,545,147 | 3.18 | 26,946,200 | 3.88 | 35,721,693 | 3.54 | 39,459,697 | 3.48 | 42,380,000 | 3.35 | 43,746,323 | 3.27 |
| Jilin | 11,290,073 | 1.94 | 15,668,663 | 2.26 | 22,560,053 | 2.24 | 24,658,721 | 2.18 | 27,280,000 | 2.16 | 27,462,297 | 2.05 |
| Heilongjiang | 11,897,309 | 2.04 | 20,118,271 | 2.90 | 32,665,546 | 3.24 | 35,214,873 | 3.11 | 39,890,000 | 2.91 | 38,312,224 | 2.86 |
| Shanghai Municipality | 6,204,417 | 1.06 | 10,816,458 | 1.56 | 11,859,748 | 1.18 | 13,341,896 | 1.18 | 16,740,000 | 1.32 | 23,019,148 | 1.72 |
| Jiangsu | 41,252,192 | 7.08 | 44,504,608 | 6.41 | 60,521,114 | 6.00 | 67,056,519 | 5.91 | 74,380,000 | 5.88 | 77,659,903 | 5.87 |
| Zhejiang | 22,865,747 | 3.92 | 28,318,573 | 4.08 | 38,884,603 | 3.86 | 41,445,930 | 3.66 | 46,770,000 | 3.69 | 54,426,891 | 4.06 |
| Anhui | 30,343,637 | 5.21 | 31,241,657 | 4.50 | 49,665,724 | 4.93 | 56,180,813 | 4.96 | 59,860,000 | 4.73 | 59,500,510 | 4.44 |
| Fujian | 13,142,721 | 2.26 | 16,757,223 | 2.41 | 25,931,106 | 2.57 | 30,097,274 | 2.65 | 34,710,000 | 2.74 | 36,894,216 | 2.75 |
| Jiangxi | 16,772,865 | 2.88 | 21,068,019 | 3.03 | 33,184,827 | 3.29 | 37,710,281 | 3.33 | 41,400,000 | 3.27 | 44,567,475 | 3.33 |
| Shandong | 48,876,548 | 8.39 | 55,519,038 | 7.99 | 74,419,054 | 7.38 | 84,392,827 | 7.44 | 90,790,000 | 7.17 | 95,793,065 | 7.15 |
| Henan | 44,214,594 | 7.59 | 50,325,511 | 7.25 | 74,422,739 | 7.38 | 85,509,535 | 7.54 | 92,560,000 | 7.31 | 94,023,567 | 7.02 |
| Hubei | 27,789,693 | 4.77 | 33,709,344 | 4.85 | 47,804,150 | 4.74 | 53,969,210 | 4.76 | 60,280,000 | 4.76 | 57,237,740 | 4.27 |
| Hunan | 33,226,954 | 5.70 | 37,182,286 | 5.35 | 54,008,851 | 5.36 | 60,659,754 | 5.35 | 64,440,000 | 5.09 | 65,683,722 | 4.90 |
| Guangdong | 34,770,059 | 5.97 | 42,800,849 | 6.16 | 59,299,220 | 5.88 | 62,829,236 | 5.54 | 86,420,000 | 6.83 | 104,303,132 | 7.79 |
| Hainan | 7,870,000 | 0.62 | 8,671,518 | 0.65 | ||||||||
| Guangxi Zhuang Autonomous Region | 19,560,822 | 3.36 | 20,845,017 | 3.00 | 36,420,960 | 3.61 | 42,245,765 | 3.73 | 44,890,000 | 3.55 | 46,026,629 | 3.55 |
| Sichuan | 62,303,999 | 10.69 | 67,956,490 | 9.78 | 99,713,310 | 9.89 | 107,218,173 | 9.46 | 83,290,000 | 6.58 | 80,418,200 | 6.00 |
| Chongqing Municipality | 30,900,000 | 2.44 | 28,846,170 | 2.15 | ||||||||
| Guizhou | 15,037,310 | 2.58 | 17,140,521 | 2.47 | 28,552,997 | 2.83 | 32,391,066 | 2.86 | 35,250,000 | 2.78 | 34,746,468 | 2.59 |
| Yunnan | 17,472,737 | 3.00 | 20,509,525 | 2.95 | 32,553,817 | 3.23 | 36,972,610 | 3.26 | 42,880,000 | 3.39 | 45,966,239 | 3.43 |
| Tibet Autonomous Region | 1,273,969 | 0.22 | 1,251,225 | 0.18 | 1,892,393 | 0.19 | 2,196,010 | 0.19 | 2,620,000 | 0.21 | 3,002,166 | 0.22 |
| Xikang (now defunct) | 3,381,064 | 0.58 | ||||||||||
| Shaanxi | 15,881,281 | 2.73 | 20,766,915 | 2.99 | 28,904,423 | 2.87 | 32,882,403 | 2.90 | 36,050,000 | 2.85 | 37,327,378 | 2.79 |
| Gansu | 12,093,600 | 2.06 | 12,630,569 | 1.82 | 19,569,261 | 1.94 | 22,371,141 | 1.97 | 25,620,000 | 2.02 | 25,575,254 | 1.91 |
| Ningxia Hui Autonomous Region | 1,506,200 | 0.26 | 2,107,500 | 0.30 | 3,895,578 | 0.39 | 4,655,451 | 0.41 | 5,620,000 | 0.44 | 6,301,350 | 0.47 |
| Qinghai | 1,676,534 | 0.29 | 2,145,604 | 0.31 | 3,895,706 | 0.39 | 4,456,946 | 0.39 | 5,180,000 | 0.41 | 5,626,722 | 0.42 |
| Xinjiang Uygur Autonomous Region | 4,873,608 | 0.84 | 7,270,067 | 1.05 | 13,081,681 | 1.30 | 15,155,778 | 1.34 | 19,250,000 | 1.52 | 21,813,334 | 1.63 |
| Military personnel | 4,238,210 | 3,199,100 | 2,500,000 | 2,300,000 | ||||||||
| Population with permanent residence difficult to define | 4,649,985 | |||||||||||
| Total mainland China | 582,603,417 | 694,581,759 | 1,008,175,288 | 1,133,682,501 | 1,265,830,000 | 1,339,724,852 | ||||||
In 1982 China conducted its first population census since 1964. It was by far the most thorough and accurate census taken since 1949 and confirmed that China was a nation of more than 1 billion people, or about one-fifth of the world's population. The census provided demographers with a set of data on China's age-sex structure, fertility and mortality rates, and population density and distribution. Information was also gathered on minority ethnic groups, urban population, and marital status. For the first time since the People's Republic of China was founded, demographers had reliable information on the size and composition of the Chinese work force. The nation began preparing for the 1982 census in late 1976. Chinese census workers were sent to the United States and Japan to study modern census-taking techniques and automation. Computers were installed in every provincial-level unit except Tibet and were connected to a central processing system in the Beijing headquarters of the State Statistical Bureau. Pretests and small scale trial runs were conducted and checked for accuracy between 1980 and 1981 in twenty-four provincial-level units. Census stations were opened in rural production brigades and urban neighborhoods. Beginning on 1 July 1982, each household sent a representative to a census station to be enumerated. The census required about a month to complete and employed approximately 5 million census takers.
The 1982 census collected data in nineteen demographic categories relating to individuals and households. The thirteen areas concerning individuals were name, relationship to head of household, sex, age, nationality, registration status, educational level, profession, occupation, status of nonworking persons, marital status, number of children born and still living, and number of births in 1981. The six items pertaining to households were type (domestic or collective), serial number, number of persons, number of births in 1981, number of deaths in 1981, and number of registered persons absent for more than one year. Information was gathered in a number of important areas for which previous data were either extremely inaccurate or simply nonexistent, including fertility, marital status, urban population, minority ethnic groups, sex composition, age distribution, and employment and unemployment.
A fundamental anomaly in the 1982 statistics was noted by some Western analysts. They pointed out that although the birth and death rates recorded by the census and those recorded through the household registration system were different, the two systems arrived at similar population totals. The discrepancies in the vital rates were the result of the underreporting of both births and deaths to the authorities under the registration system; families would not report some births because of the one-child policy and would not report some deaths so as to hold on to the rations of the deceased.
Nevertheless, the 1982 census was a watershed for both Chinese and world demographics. After an eighteen-year gap, population specialists were given a wealth of reliable, up-to-date figures on which to reconstruct past demographic patterns, measure current population conditions, and predict future population trends. For example, Chinese and foreign demographers used the 1982 census age-sex structure as the base population for forecasting and making assumptions about future fertility trends. The data on age-specific fertility and mortality rates provided the necessary base-line information for making population projections. The census data also were useful for estimating future manpower potential, consumer needs, and utility, energy, and health-service requirements. The sudden abundance of demographic data helped population specialists immeasurably in their efforts to estimate world population. Previously, there had been no accurate information on these 21% of the Earth's inhabitants. Demographers who had been conducting research on global population without accurate data on the Chinese fifth of the world's population were particularly thankful for the 1982 breakthrough census.
Population control
Initially, China's post-1949 leaders were ideologically disposed to view a large population as an asset. But the liabilities of a large, rapidly growing population soon became apparent. For one year, starting in August 1956, vigorous support was given to the Ministry of Public Health's mass birth control efforts. These efforts, however, had little impact on fertility. After the interval of the Great Leap Forward, Chinese leaders again saw rapid population growth as an obstacle to development, and their interest in birth control revived. In the early 1960s, schemes somewhat more muted than during the first campaign, emphasized the virtues of late marriage. Birth control offices were set up in the central government and some provincial-level governments in 1964. The second campaign was particularly successful in the cities, where the birth rate was cut in half during the 1963–66 period. The upheaval of the Cultural Revolution brought the program to a halt, however.
In 1972 and 1973 the party mobilized its resources for a nationwide birth control campaign administered by a group in the State Council. Committees to oversee birth control activities were established at all administrative levels and in various collective enterprises. This extensive and seemingly effective network covered both the rural and the urban population. In urban areas public security headquarters included population control sections. In rural areas the country's "barefoot doctors" distributed information and contraceptives to people's commune members. By 1973 Mao Zedong was personally identified with the family planning movement, signifying a greater leadership commitment to controlled population growth than ever before. Yet until several years after Mao's death in 1976, the leadership was reluctant to put forth directly the rationale that population control was necessary for economic growth and improved living standards.
Population growth targets were set for both administrative units and individual families. In the mid-1970s the maximum recommended family size was two children in cities and three or four in the country. Since 1979 the government has advocated a one-child limit for both rural and urban areas and has generally set a maximum of two children in special circumstances. As of 1986 the policy for minority nationalities was two children per couple, three in special circumstances, and no limit for ethnic groups with very small populations. The overall goal of the one-child policy was to keep the total population within 1.2 billion through the year 2000, on the premise that the Four Modernizations program would be of little value if population growth was not brought under control.
The one-child policy was a highly ambitious population control program. Like previous programs of the 1960s and 1970s, the one-child policy employed a combination of public education, social pressure, and in some cases coercion. The one-child policy was unique, however, in that it linked reproduction with economic cost or benefit.
Under the one-child program, a sophisticated system rewarded those who observed the policy and penalized those who did not. Through this policy, the increasing population got temperate after the penalties were made. Couples with only one child were given a "one-child certificate" entitling them to such benefits as cash bonuses, longer maternity leave, better child care, and preferential housing assignments. In return, they were required to pledge that they would not have more children. In the countryside, there was great pressure to adhere to the one-child limit. Because the rural population accounted for approximately 60% of the total, the effectiveness of the one-child policy in rural areas was considered the key to the success or failure of the program as a whole.
In rural areas the day-to-day work of family planning was done by cadres at the team and brigade levels who were responsible for women's affairs and by health workers. The women's team leader made regular household visits to keep track of the status of each family under her jurisdiction and collected information on which women were using contraceptives, the methods used, and which had become pregnant. She then reported to the brigade women's leader, who documented the information and took it to a monthly meeting of the commune birth-planning committee. According to reports, ceilings or quotas had to be adhered to; to satisfy these cutoffs, unmarried young people were persuaded to postpone marriage, couples without children were advised to "wait their turn," women with unauthorized pregnancies were pressured to have abortions, and those who already had children were urged to use contraception or undergo sterilization. Couples with more than one child were exhorted to be sterilized.
The one-child policy enjoyed much greater success in urban than in rural areas. Even without state intervention, there were compelling reasons for urban couples to limit the family to a single child. Raising a child required a significant portion of family income, and in the cities a child did not become an economic asset until he or she entered the work force at age sixteen. Couples with only one child were given preferential treatment in housing allocation. In addition, because city dwellers who were employed in state enterprises received pensions after retirement, the sex of their first child was less important to them than it was to those in rural areas.
Numerous reports surfaced of coercive measures used to achieve the desired results of the one-child policy. The alleged methods ranged from intense psychological pressure to the use of physical force, including some grisly accounts of forced abortions and infanticide. Chinese officials admitted that isolated, uncondoned abuses of the program occurred and that they condemned such acts, but they insisted that the family planning program was administered on a voluntary basis using persuasion and economic measures only. International reaction to the allegations were mixed. The UN Fund for Population Activities and the International Planned Parenthood Federation were generally supportive of China's family planning program. The United States Agency for International Development, however, withdrew US$10 million from the Fund in March 1985 based on allegations that coercion had been used.
Observers suggested that an accurate assessment of the one-child program would not be possible until all women who came of childbearing age in the early 1980s passed their fertile years. As of 1987 the one-child program had achieved mixed results. In general, it was very successful in almost all urban areas but less successful in rural areas.
Rapid fertility reduction associated with the one-child policy has potentially negative results. For instance, in the future the elderly might not be able to rely on their children to care for them as they have in the past, leaving the state to assume the expense, which could be considerable. Based on United Nations and Chinese government statistics, it was estimated in 1987 that by the year 2000 the population 60 years and older (the retirement age is 60 in urban areas) would number 127 million, or 10.1% of the total population; the projection for 2025 was 234 million elderly, or 16.4%. According to projections based on the 1982 census, if the one-child policy were maintained to the year 2000, 25% of China's population would be age 65 or older by the year 2040. In 2050, the number of people over 60 is expected to increase to 430 million. [6]
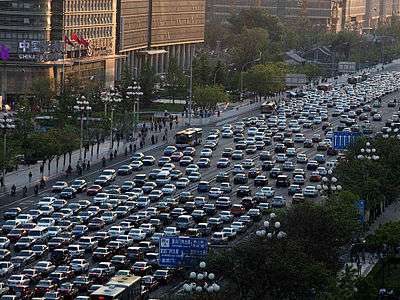
Population density and distribution
- Overall
China is the most populated country in the world and its national population density (137/km2) is similar to those of Switzerland and the Czech Republic. The overall population density of China conceals major regional variations, the western and northern part have a few million people, while eastern half has about 1.3 billion. The vast majority of China's population lives near the east in major cities.
- Coast and eastern China
In the 11 provinces, special municipalities, and autonomous regions along the southeast coast, population density was 320.6 people per km2.
Broadly speaking, the population was concentrated east of the mountains and south of the northern steppe. The most densely populated areas included the Yangtze River Valley (of which the delta region was the most populous), Sichuan Basin, North China Plain, Pearl River Delta, and the industrial area around the city of Shenyang in the northeast.
- Western areas
Population is most sparse in the mountainous, desert, and grassland regions of the northwest and southwest. In Inner Mongolia Autonomous Region, portions are completely uninhabited, and only a few sections have populations denser than ten people per km2. The Inner Mongolia, Xinjiang, and Tibet autonomous regions and Qinghai and Gansu comprise 55% of the country's land area but in 1985 contained only 5.7% of its population.
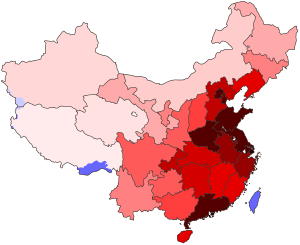 A 2010 population density map of the territories governed by the PRC and the ROC. The eastern, coastal provinces are much more densely populated than the western interior because of the historical access to water. |
| ||||||||||||||||||||||||||||||||||||||||||
- Gender disparity concern
Future challenges for China will be the gender disparity. According to the 2010 census, males account for 51.27% of China's 1.34 billion people, while females made up 48.73% of the total. The sex ratio (the number of males for each female in a population) at birth was 118.06 boys to every 100 girls (54.14%) in 2010, higher than the 116.86 (53.89%) of 2000, but 0.53 points lower than the ratio of 118.59 (54.25%) in 2005.[7] In most western countries the sex ratio at birth is around 105 boys to 100 girls (51.22%). At the moment there are about 9 million more boys than girls in China.
Vital statistics
Total Fertility Rate from 1930 to 1949
Children born per woman from 1930 to 1949. It is based on fairly good data for the entire period. Sources: Our World In Data and Gapminder Foundation.[8]
| Years | 1930 | 1931 | 1932 | 1933 | 1934 | 1935 | 1936 | 1937 | 1938 | 1939 | 1940[8] |
|---|---|---|---|---|---|---|---|---|---|---|---|
| Total Fertility Rate in China | 5.5 | 5.47 | 5.45 | 5.43 | 5.4 | 5.38 | 5.35 | 5.32 | 5.3 | 5.28 | 5.25 |
| Years | 1941 | 1942 | 1943 | 1944 | 1945 | 1946 | 1947 | 1948 | 1949[8] |
|---|---|---|---|---|---|---|---|---|---|
| Total Fertility Rate in China | 5.15 | 5.06 | 4.96 | 4.86 | 4.77 | 5 | 5.2 | 4.91 | 5.54 |
Life expectancy
| Period | Life expectancy in Years |
Period | Life expectancy in Years |
|---|---|---|---|
| 1950–1955 | 43.8 | 1985–1990 | 68.9 |
| 1955–1960 | 44.5 | 1990–1995 | 69.7 |
| 1960–1965 | 44.6 | 1995–2000 | 70.9 |
| 1965–1970 | 55.5 | 2000–2005 | 73.1 |
| 1970–1975 | 61.7 | 2005–2010 | 74.7 |
| 1975–1980 | 65.5 | 2010–2015 | 75.7 |
| 1980–1985 | 67.8 |
Source: UN World Population Prospects[9]
Table of births and deaths 1950–2017
China's fertility statistics differ depending on the source. According to the Ministry of Health and Family Planning November 2015 announcement, China's 2015 TFR was somewhere between 1.5 and 1.6. Ministry of Health and Family Planning:[10][8]
| Average population (x 1000) | Live births1 | Deaths1 | Natural change1 | Crude birth rate (per 1000) | Crude death rate (per 1000) | Natural change (per 1000) | Total Fertility Rate | |
|---|---|---|---|---|---|---|---|---|
| 1950 | 546,815 | 20,232,000 | 9,843,000 | 10,389,000 | 37.0 | 18.0 | 19.0 | 5.29 |
| 1951 | 557,480 | 21,073,000 | 9,923,000 | 11,150,000 | 37.8 | 17.8 | 20.0 | |
| 1952 | 568,910 | 21,050,000 | 9,671,000 | 11,379,000 | 37.0 | 17.0 | 20.0 | |
| 1953 | 581,390 | 21,511,000 | 8,139,000 | 13,372,000 | 37.0 | 14.0 | 23.0 | |
| 1954 | 595,310 | 22,604,000 | 7,846,000 | 14,758,000 | 37.97 | 13.18 | 24.79 | |
| 1955 | 608,655 | 19,842,000 | 7,474,000 | 12,368,000 | 32.60 | 12.28 | 20.32 | 5.98 |
| 1956 | 621,465 | 19,825,000 | 7,085,000 | 12,740,000 | 31.90 | 11.40 | 20.50 | |
| 1957 | 637,405 | 21,691,000 | 6,884,000 | 14,807,000 | 34.03 | 10.80 | 23.23 | |
| 1958 | 653,235 | 19,088,000 | 7,826,000 | 11,262,000 | 29.22 | 11.98 | 17.24 | |
| 1959 | 666,005 | 16,504,000 | 9,717,000 | 6,787,000 | 24.78 | 14.59 | 10.19 | |
| 1960 | 667,070 | 13,915,000 | 16,964,000 | −3 049 000 | 20.86 | 25.43 | −4.57 | 3.99 |
| 1961 | 660,330 | 11,899,000 | 9,403,000 | 2,496,000 | 18.02 | 14.24 | 3.78 | |
| 1962 | 665,770 | 24,640,000 | 6,671,000 | 17,969,000 | 37.01 | 10.02 | 26.99 | |
| 1963 | 682,335 | 29,593,000 | 6,851,000 | 22,742,000 | 43.37 | 10.04 | 33.33 | |
| 1964 | 698,355 | 27,334,000 | 8,031,000 | 19,303,000 | 39.14 | 11.50 | 27.64 | |
| 1965 | 715,185 | 27,091,000 | 6,794,000 | 20,297,000 | 37.88 | 9.50 | 28.38 | 6.02 |
| 1966 | 735,400 | 25,776,000 | 6,494,000 | 19,282,000 | 35.05 | 8.83 | 26.22 | |
| 1967 | 754,550 | 25,625,000 | 6,361,000 | 19,264,000 | 33.96 | 8.43 | 25.53 | |
| 1968 | 774,510 | 27,565,000 | 6,359,000 | 21,206,000 | 35.59 | 8.21 | 27.38 | |
| 1969 | 796,025 | 27,152,000 | 6,392,000 | 20,760,000 | 34.11 | 8.03 | 26.08 | |
| 1970 | 818,315 | 27,356,000 | 6,219,000 | 21,137,000 | 33.43 | 7.60 | 25.83 | 5.75 |
| 1971 | 841,105 | 25,780,000 | 6,157,000 | 19,623,000 | 30.65 | 7.32 | 23.33 | |
| 1972 | 862,030 | 25,663,000 | 6,560,000 | 19,103,000 | 29.77 | 7.61 | 22.16 | |
| 1973 | 881,940 | 24,633,000 | 6,209,000 | 18,424,000 | 27.93 | 7.04 | 20.89 | |
| 1974 | 900,350 | 22,347,000 | 6,609,000 | 15,738,000 | 24.82 | 7.34 | 17.48 | |
| 1975 | 916,395 | 21,086,000 | 6,708,000 | 14,378,000 | 23.01 | 7.32 | 15.69 | 3.58 |
| 1976 | 930,685 | 18,530,000 | 6,747,000 | 11,783,000 | 19.91 | 7.25 | 12.66 | |
| 1977 | 943,455 | 17,860,000 | 6,482,000 | 11,378,000 | 18.93 | 6.87 | 12.06 | |
| 1978 | 956,165 | 17,450,000 | 5,976,000 | 11,474,000 | 18.25 | 6.25 | 12.00 | |
| 1979 | 969,005 | 17,268,000 | 6,018,000 | 11,250,000 | 17.82 | 6.21 | 11.61 | |
| 1980 | 981,235 | 17,868,000 | 6,221,000 | 11,647,000 | 18.21 | 6.34 | 11.87 | 2.32 |
| 1981 | 993,885 | 20,782,000 | 6,321,000 | 14,461,000 | 20.91 | 6.36 | 14.55 | |
| 1982 | 1,008,065 | 21,260,000 | 6,653,000 | 14,607,000 | 22.28 | 6.60 | 15.68 | |
| 1983 | 1,020,180 | 18,996,000 | 7,223,000 | 11,773,000 | 20.19 | 6.90 | 13.29 | |
| 1984 | 1,034,750 | 18,022,000 | 6,890,000 | 11,132,000 | 19.90 | 6.82 | 13.08 | |
| 1985 | 1,045,320 | 21,994,000 | 7,087,000 | 14,907,000 | 21.04 | 6.78 | 14.26 | 2.65 |
| 1986 | 1,066,790 | 23,928,000 | 7,318,000 | 16,610,000 | 22.43 | 6.86 | 15.57 | |
| 1987 | 1,084,035 | 25,291,000 | 7,285,000 | 18,006,000 | 23.33 | 6.72 | 16.61 | |
| 1988 | 1,101,630 | 24,643,000 | 7,315,000 | 17,328,000 | 22.37 | 6.64 | 15.73 | |
| 1989 | 1,118,650 | 24,140,000 | 7,316,000 | 16,824,000 | 21.58 | 6.54 | 15.04 | |
| 1990 | 1,135,185 | 23,910,000 | 7,570,000 | 16,340,000 | 21.06 | 6.67 | 14.39 | 2.43 |
| 1991 | 1,150,780 | 22,650,000 | 7,710,000 | 14,940,000 | 19.68 | 6.70 | 12.98 | |
| 1992 | 1,164,970 | 21,250,000 | 7,740,000 | 13,510,000 | 18.24 | 6.64 | 11.60 | |
| 1993 | 1,178,440 | 21,320,000 | 7,820,000 | 13,500,000 | 18.09 | 6.64 | 11.46 | |
| 1994 | 1,191,835 | 21,100,000 | 7,740,000 | 13,360,000 | 17.70 | 6.49 | 11.21 | |
| 1995 | 1,204,855 | 20,630,000 | 7,920,000 | 12,710,000 | 17.12 | 6.57 | 10.55 | 1.68 |
| 1996 | 1,217,550 | 20,670,000 | 7,990,000 | 12,680,000 | 16.98 | 6.56 | 10.41 | |
| 1997 | 1,230,075 | 20,380,000 | 8,010,000 | 12,370,000 | 16.57 | 6.51 | 10.06 | |
| 1998 | 1,241,935 | 19,420,000 | 8,070,000 | 11,350,000 | 15.64 | 6.50 | 9.14 | |
| 1999 | 1,252,735 | 18,340,000 | 8,090,000 | 10,250,000 | 14.64 | 6.46 | 8.18 | |
| 2000 | 1,262,645 | 17,710,000 | 8,140,000 | 9,570,000 | 14.03 | 6.45 | 7.58 | 1.45 |
| 2001 | 1,271,850 | 17,020,000 | 8,180,000 | 8,840,000 | 13.38 | 6.43 | 6.95 | |
| 2002 | 1,280,400 | 16,470,000 | 8,210,000 | 8,260,000 | 12.86 | 6.41 | 6.45 | |
| 2003 | 1,288,400 | 15,990,000 | 8,250,000 | 7,740,000 | 12.41 | 6.40 | 6.01 | |
| 2004 | 1,296,075 | 15,930,000 | 8,320,000 | 7,610,000 | 12.29 | 6.42 | 5.87 | |
| 2005 | 1,303,720 | 16,170,000 | 8,490,000 | 7,680,000 | 12.40 | 6.51 | 5.89 | 1.51 |
| 2006 | 1,311,020 | 15,840,000 | 8,920,000 | 6,920,000 | 12.09 | 6.81 | 5.28 | |
| 2007 | 1,317,885 | 15,940,000 | 9,130,000 | 6,810,000 | 12.10 | 6.93 | 5.17 | |
| 2008 | 1,324,655 | 16,080,000 | 9,350,000 | 6,730,000 | 12.14 | 7.06 | 5.08 | |
| 2009 | 1,331,380 | 16,150,000 | 9,430,000 | 6,720,000 | 11.95 | 7.08 | 4.87 | |
| 2010 | 1,337,825 | 15,920,000 | 9,510,000 | 6,410,000 | 11.90 | 7.11 | 4.79 | 1.54 |
| 2011 | 1,344,130 | 16,040,000 | 9,600,000 | 6,440,000 | 11.93 | 7.14 | 4.79 | |
| 2012 | 1,353,821 | 16,350,000 | 9,660,000 | 6,690,000 | 12.07 | 7.14 | 4.93 | |
| 2013 | 1,360,720 | 16,400,000 | 9,720,000 | 6,680,000 | 12.08 | 7.16 | 4.92 | |
| 2014 | 1,367,820 | 16,870,000 | 9,770,000 | 7,100,000 | 12.37 | 7.16 | 5.21 | |
| 2015[11] | 1,374,620 | 16,550,000 | 9,750,000 | 6,800,000 | 12.07 | 7.11 | 4.96 | 1.60 [12] |
| 2016 | 1,382,710 | 17,860,000 | 9,770,000 | 8,090,000 | 12.95 | 7.09 | 5.86 | 1.70 [12] |
| 2017[13] | 1,390,080 | 17,230,000 | 9,860,000 | 7,370,000 | 12.43 | 7.11 | 5.32 | |
The latest data from the National Bureau of Statistics (NBS) seems to contradict this, stating China's TFR for 2015 was 1,05. Although there is a natural margin of error since the NBS surveys only a thin cross-section of Chinese society, approximately 1% of the total population.[14] Fertility according to National Bureau of Statistics (NBS):[15]
| Census year | Fertility Rate |
|---|---|
| 2000 | 1.22 |
| 2005 | 1.33 |
| 2010 | 1.18 |
| 2015 | 1.05 |
| 2016 | 1.29 |
| 2017 | 1.24 |
Fertility and mortality
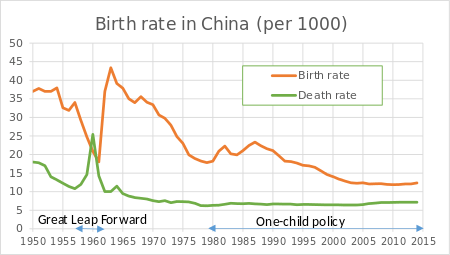
In 1949 crude death rates were probably higher than 30 per 1,000, and the average life expectancy was only 35 years. Beginning in the early 1950s, mortality steadily declined; it continued to decline through 1978 and remained relatively constant through 1987. One major fluctuation was reported in a computer reconstruction of China's population trends from 1953 to 1987 produced by the United States Bureau of the Census. The computer model showed that the crude death rate increased dramatically during the famine years associated with the Great Leap Forward (1958–60).
According to Chinese government statistics, the crude birth rate followed five distinct patterns from 1949 to 1982. It remained stable from 1949 to 1954, varied widely from 1955 to 1965, experienced fluctuations between 1966 and 1969, dropped sharply in the late 1970s, and increased from 1980 to 1981. Between 1970 and 1980, the crude birth rate dropped from 33.4 per 1,000 to 18.2 per 1,000. The government attributed this dramatic decline in fertility to the wǎn xī shǎo ("晚、稀、少", or "late, long, few": later marriages, longer intervals between births, and fewer children) birth control campaign. However, elements of socioeconomic change, such as increased employment of women in both urban and rural areas and reduced infant mortality (a greater percentage of surviving children would tend to reduce demand for additional children), may have played some role. The birth rate increased in the 1980s to a level over 20 per 1,000, primarily as a result of a marked rise in marriages and first births. The rise was an indication of problems with the one-child policy of 1979. Chinese sources, however, indicate that the birth rate started to decrease again in the 1990s and reached a level of around 12 per 1,000 in recent years.
In urban areas, the housing shortage may have been at least partly responsible for the decreased birth rate. Also, the policy in force during most of the 1960s and the early 1970s of sending large numbers of high school graduates to the countryside deprived cities of a significant proportion of persons of childbearing age and undoubtedly had some effect on birth rates (see Cultural Revolution (1966–76)). Primarily for economic reasons, rural birth rates tended to decline less than urban rates. The right to grow and sell agricultural products for personal profit and the lack of an old-age Welfare system were incentives for rural people to produce many children, especially sons, for help in the fields and for support in old age. Because of these conditions, it is unclear to what degree education had been able to erode traditional values favoring large families.
Today, the population continues to grow. There is also a serious gender imbalance. Census data obtained in 2000 revealed that 119 boys were born for every 100 girls, and among China's "floating population" the ratio was as high as 128:100. These situations led the government in July 2004 to ban selective abortions of female fetuses. It is estimated that this imbalance will rise until 2025–2030 to reach 20% then slowly decrease.[16]
China now has an increasingly aging population; it is projected that 11.8% of the population in 2020 will be 65 years of age and older. Health care has improved dramatically in China since 1949. Major diseases such as cholera, typhoid, and scarlet fever have been brought under control. Life expectancy has more than doubled, and infant mortality has dropped significantly. On the negative side, the incidence of cancer, cerebrovascular disease, and heart disease has increased to the extent that these have become the leading causes of death. Economic reforms initiated in the late 1970s fundamentally altered methods of providing health care; the collective medical care system has been gradually replaced by a more individual-oriented approach.
In Hong Kong, the birth rate of 0.9% is lower than its death rate. Hong Kong's population increases because of immigration from the mainland and a large expatriate population comprising about 4%. Like Hong Kong, Macau also has a low birth rate relying on immigration to maintain its population.
Total fertility rate
According to the 2000 census, the TFR was 1.22 (0.86 for cities, 1.08 for towns and 1.43 for villages/outposts). Beijing had the lowest TFR at 0.67, while Guizhou had the highest at 2.19. The Xiangyang district of Jiamusi city (Heilongjiang) has a TFR of 0.41, which is the lowest TFR recorded anywhere in the world in recorded history. Other extremely low TFR counties are: 0.43 in the Heping district of Tianjin city (Tianjin), and 0.46 in the Mawei district of Fuzhou city (Fujian). At the other end TFR was 3.96 in Geji County (Tibet), 4.07 in Jiali County (Tibet), and 5.47 in Baqing County (Tibet).[17]
The 2010 census reported a TFR of 1.18 (0.88 in cities, 1.15 in townships, and 1.44 in rural areas).[18] The five regions with the lowest fertility rates were Beijing (0.71), Shanghai (0.74), Liaoning (0.74), Heilongjiang (0.75), and Jilin (0.76). The five regions with the highest fertility rates were Guangxi (1.79), Guizhou (1.75), Xinjiang (1.53), Hainan (1.51), and Anhui (1.48).[18]
Total fertility rate by ethnic group (2010 census): Han (1.14), Zhuang (1.59), Hui (1.48), Manchu (1.18), Uyghur (2.04), Miao (1.82), Yi (1.82), Tujia (1.74), Tibetan (1.60), Mongols (1.26).[19]
Labor force
In 2012, for the first time, according to statistics released by China's National Bureau of Statistics in January 2013, the number of people theoretically able to enter the Chinese labor force (individuals aged 15 to 59), shrank slightly to 937.27 million people, a decrease of 3.45 million from 2011. This trend, resulting from China's demographic transition, is anticipated to continue for at least the next 20 years, to 2030.[20] The CIA World Fact Book estimates the 2012 actual active labor force to amount to 798.5 million.[21]
Height and weight
As of 2012, the average Chinese man was 167.1 centimeters tall (5 ft 5.8 in) in 2012, the figures showed, and women's average height was 155.8 centimeters (5 ft 1.3 in). The same study showed an average Chinese man weighed 66.2 kilograms (145.9 lbs, or 10 stone 5.9 lbs), up 3.5 kilograms (7.7 lbs) over 10 years, while women were 2.9 kilograms (6.4 pounds) heavier on average at 57.3 kilograms (126.3 pounds, or 9 stone 0.3 lbs). They were up just 0.4 centimeters (0.16 in) and 0.7 centimeters (0.28 in) respectively from 10 years earlier.[22]
Ethnic groups
The People's Republic of China (PRC) officially recognizes 56 distinct ethnic groups, the largest of which are Han, who constitute 91.51% of the total population in 2010. Ethnic minorities constitute 8.49% or 113.8 million of China's population in 2010. During the past decades ethnic minorities have experienced higher growth rates than the majority Han population, because they are not under the one-child policy. Their proportion of the population in China has grown from 6.1% in 1953, to 8.04% in 1990, 8.41% in 2000, and 8.49% in 2010. Large ethnic minorities (data according to the 2000 census) include the Zhuang (16 million, 1.28%), Manchu (10 million, 0.84%), Uyghur (9 million, 0.78%), Hui (9 million, 0.71%), Miao (8 million, 0.71%), Yi (7 million, 0.61%), Tujia (5.75 million, 0.63%), Mongols (5 million, 0.46%), Tibetan (5 million, 0.43%), Buyi (3 million, 0.23%), and Korean (2 million, 0.15%).
| Ethnic group | Language family | 1953 | % | 1964 | % | 1982 | % | 1990 | % | 2000 | % | 2010[23] | % |
|---|---|---|---|---|---|---|---|---|---|---|---|---|---|
| Han | Chinese | 547,283,057 | 93.94 | 651,296,368 | 94.22 | 936,703,824 | 93.30 | 1,039,187,548 | 91.92 | 1,137,386,112 | 91.53 | 1,220,844,520 | 91.60 |
| Minority groups | 35,320,360 | 6.06 | 39,883,909 | 5.78 | 67,233,254 | 6.67 | 90,570,743 | 8.01 | 105,225,173 | 8.47 | 111,966,349 | 8.40 | |
| Zhuang | Tai-Kadai | 6,611,455 | 1.13 | 8,386,140 | 1.21 | 13,441,900 | 1.32 | 15,555,820 | 1.38 | 16,178,811 | 1.28 | 16,926,381 | 1.27 |
| Hui | Chinese | 3,559,350 | 0.61 | 4,473,147 | 0.64 | 7,207,780 | 0.71 | 8,612,001 | 0.76 | 9,816,802 | 0.78 | 10,586,087 | 0.79 |
| Manchu | Tungusic | 2,418,931 | 0.42 | 2,695,675 | 0.39 | 4,299,950 | 0.43 | 9,846,776 | 0.87 | 10,682,263 | 0.84 | 10,387,958 | 0.78 |
| Uyghurs | Turkic | 3,640,125 | 0.62 | 3,996,311 | 0.58 | 5,917,030 | 0.59 | 7,207,024 | 0.64 | 8,399,393 | 0.66 | 10,069,346 | 0.76 |
| Miao | Miao-Yao / Hmong-Mien | 2,511,339 | 0.43 | 2,782,088 | 0.40 | 5,017,260 | 0.50 | 7,383,622 | 0.65 | 8,940,116 | 0.71 | 9,426,007 | 0.71 |
| Yi | Tibeto-Burman | 3,254,269 | 0.56 | 3,380,960 | 0.49 | 5,492,330 | 0.54 | 6,578,524 | 0.58 | 7,762,286 | 0.61 | 8,714,393 | 0.65 |
| Tujia | Tibeto-Burman | 284,900 | 0.03 | 5,725,049 | 0.51 | 8,028,133 | 0.63 | 8,353,912 | 0.63 | ||||
| Tibetans | Tibeto-Burman | 2,775,622 | 0.48 | 2,501,174 | 0.36 | 3,821,950 | 0.38 | 4,593,072 | 0.41 | 5,416,021 | 0.43 | 6,282,187 | 0.47 |
| Mongols | Mongolic | 1,462,956 | 0.25 | 1,965,766 | 0.28 | 3,402,200 | 0.34 | 4,802,407 | 0.42 | 5,813,947 | 0.46 | 5,981,840 | 0.45 |
| Buyei | Tai-Kadai | 1,247,883 | 0.21 | 1,348,055 | 0.19 | 2,103,150 | 0.21 | 2,548,294 | 0.22 | 2,971,460 | 0.23 | 2,870,034 | 0.22 |
| Korean | Korean | 1,120,405 | 0.19 | 1,339,569 | 0.19 | 1,783,150 | 0.18 | 1,923,361 | 0.17 | 1,923,842 | 0.15 | 1,830,929 | 0.14 |
| Dong | Tai-Kadai | 712802 | 836123 | 1,446,190 | 0.14 | 2,508,624 | 0.22 | 2,960,293 | 0.24 | 2,879,974 | 0.22 | ||
| Yao | Miao-Yao / Hmong-Mien | 665933 | 857265 | 1,414,870 | 0.14 | 2,137,033 | 0.19 | 2,637,421 | 0.21 | 2,796,003 | 0.21 | ||
| Bai | Sino-Tibetan | 567119 | 706623 | 1,147,360 | 0.11 | 1,598,052 | 0.14 | 1,858,063 | 0.15 | 1,933,510 | 0.15 | ||
| Hani | Tibeto-Burman | 481220 | 628727 | 1,063,300 | 0.11 | 1,254,800 | 0.11 | 1,439,673 | 0.12 | 1,660,932 | 0.12 | ||
| Kazakh | Turkic | 509375 | 491637 | 878,570 | 0.09 | 1,110,758 | 0.10 | 1,250,458 | 0.10 | 1,462,588 | 0.11 | ||
| Li | Tai-Kadai | 360950 | 438813 | 882,030 | 0.09 | 1,112,498 | 0.10 | 1,247,814 | 0.10 | 1,463,064 | 0.11 | ||
| Dai | Tai-Kadai | 478966 | 535389 | 864,340 | 0.09 | 1,025,402 | 0.09 | 1,158,989 | 0.09 | 1,261,311 | 0.09 | ||
| She | Miao-Yao / Hmong-Mien | 234167 | 379,080 | 0.04 | 634,700 | 0.06 | 709,592 | 0.06 | 708,651 | 0.05 | |||
| Lisu | Tibeto-Burman | 317465 | 270628 | 466,760 | 0.05 | 574,589 | 0.05 | 634,912 | 0.05 | 702,839 | 0.05 | ||
| Gelao | Tai-Kadai | 26852 | 59,810 | 0.01 | 438,192 | 0.04 | 579,357 | 0.05 | 550,746 | 0.04 | |||
| Dongxiang | Mongolic | 155761 | 147443 | 279523 | – | 373,669 | 0.03 | 513,805 | 0.04 | 621,500 | 0.05 | ||
| Gaoshan | Austronesian | 329 | 366 | 1,750 | 0.00 | 2,877 | 0.00 | 4,461 | 0.00 | 4,009 | 0.00 | ||
| Lahu | Tibeto-Burman | 139060 | 191241 | 320,350 | 0.03 | 411,545 | 0.04 | 453,705 | 0.04 | 485,966 | 0.04 | ||
| Sui | Tai-Kadai | 133566 | 156099 | 300,690 | 0.03 | 347,116 | 0.03 | 406,902 | 0.03 | 411,847 | 0.03 | ||
| Va | Mon-Khmer | 286158 | 200272 | 271,050 | 0.03 | 351,980 | 0.03 | 396,610 | 0.03 | 429,709 | 0.03 | ||
| Nakhi | Tibeto-Burman | 143453 | 156796 | 248,650 | 0.02 | 277,750 | 0.02 | 308,839 | 0.02 | 326,295 | 0.02 | ||
| Qiang | Tibeto-Burman | 35660 | 49105 | 109,760 | 0.01 | 198,303 | 0.02 | 306,072 | 0.02 | 309,576 | 0.02 | ||
| Tu | Mongolic | 53277 | 77349 | 148,760 | 0.01 | 192,568 | 0.02 | 241,198 | 0.02 | 289,565 | 0.02 | ||
| Mulao | Tai-Kadai | 52819 | 91,790 | 0.01 | 160,648 | 0.01 | 207,352 | 0.02 | 216,257 | 0.02 | |||
| Xibe | Tungusic | 19022 | 33438 | 77,560 | 0.01 | 172,932 | 0.02 | 188,824 | 0.02 | 190,481 | 0.01 | ||
| Kyrgyz | Turkic | 70944 | 70151 | 108,790 | 0.01 | 143,537 | 0.01 | 160,823 | 0.01 | 186,708 | 0.01 | ||
| Daur | Mongolic | 63394 | 94126 | – | 121,463 | 0.01 | 132,143 | 0.01 | 131,992 | 0.01 | |||
| Jingpo | Tibeto-Burman | 101852 | 57762 | 100,180 | 0.01 | 119,276 | 0.01 | 132,143 | 0.01 | 147,828 | 0.01 | ||
| Maonan | Tai-Kadai | 22382 | 37,450 | 0.00 | 72,370 | 0.01 | 107,106 | 0.01 | 101,192 | 0.01 | |||
| Salar | Turkic | 30658 | 69135 | 68,030 | 0.01 | 82,398 | 0.01 | 104,503 | 0.01 | 130,607 | 0.01 | ||
| Blang | Mon-Khmer | 39411 | 58473 | – | 87,546 | 0.01 | 91,882 | 0.01 | 119,639 | 0.01 | |||
| Tajik | Indo-European (Iranian) | 14462 | 16236 | 27,430 | 0.00 | 33,223 | 0.00 | 41,028 | 0.00 | 51,069 | 0.00 | ||
| Achang | Tibeto-Burman | 12032 | 31,490 | 0.00 | 27,718 | 0.00 | 33,936 | 0.00 | 39,555 | 0.00 | |||
| Pumi | Tibeto-Burman | 14298 | 18,860 | 0.00 | 29,721 | 0.00 | 33,600 | 0.00 | 42,861 | 0.00 | |||
| Ewenki | Tungusic | 4957 | 9681 | 19,440 | 0.00 | 26,379 | 0.00 | 30,505 | 0.00 | 30,875 | 0.00 | ||
| Nu | Tibeto-Burman | 15047 | 25,980 | 0.00 | 27,190 | 0.00 | 28,759 | 0.00 | 37,523 | 0.00 | |||
| Gin (Vietnamese) | Mon-Khmer | 12,140 | 0.00 | 18,749 | 0.00 | 22,517 | 0.00 | 28,199 | 0.00 | ||||
| Jino | Tibeto-Burman | 11,260 | 0.00 | 18,022 | 0.00 | 20,899 | 0.00 | 23,143 | 0.00 | ||||
| De'ang | Mon-Khmer | – | – | 15,461 | 0.00 | 17,935 | 0.00 | 20,556 | 0.00 | ||||
| Bonan | Mongolic | 4957 | 5125 | 6,620 | 0.00 | 11,683 | 0.00 | 16,505 | 0.00 | 20,074 | 0.00 | ||
| Russian | Indo-European (Slavic) | 22656 | 1326 | 2,830 | 0.00 | 13,500 | 0.00 | 15,609 | 0.00 | 15,393 | 0.00 | ||
| Yugur | Turkic | 3861 | 5717 | 7,670 | 0.00 | 12,293 | 0.00 | 13,719 | 0.00 | 14,378 | 0.00 | ||
| Uzbek | Turkic | 13626 | 7717 | 13,810 | 0.00 | 14,763 | 0.00 | 13,370 | 0.00 | 10,569 | 0.00 | ||
| Monba | Tibeto-Burman | 3809 | 1,040 | 0.00 | 7,498 | 0.00 | 8,923 | 0.00 | 10,561 | 0.00 | |||
| Oroqen | Tungusic | 2262 | 2709 | 2,280 | 0.00 | 7,004 | 0.00 | 8,196 | 0.00 | 8,659 | 0.00 | ||
| Derung | Tibeto-Burman | 4,250 | 0.00 | 5,825 | 0.00 | 7,426 | 0.00 | 6,930 | 0.00 | ||||
| Chinese Tatars | Turkic | 6929 | 2294 | 7,510 | 0.00 | 5,064 | 0.00 | 4,890 | 0.00 | 3,556 | 0.00 | ||
| Hezhen | Tungusic | 718 | 670 | 0.00 | 4,254 | 0.00 | 4,640 | 0.00 | 5,354 | 0.00 | |||
| Lhoba | Tibeto-Burman | 1,030 | 0.00 | 2,322 | 0.00 | 2,965 | 0.00 | 3,682 | 0.00 | ||||
| Unrecognized | 3,370,880 | 0.33 | 3,498 | 0.00 | 734,379 | 0.06 | 640,101 | 0.05 | |||||
| Unknown | 4,720 | 0.00 | 752,347 | 0.07 | 735,379 | 0.06 | – | – | |||||
| Foreigners | – | – | – | – | 941 | 0.00 | 1,448 | 0.00 | |||||
| Total mainland China | 582,603,417 | 694,581,759 | 1,008,175,288 | 1,133,682,501 | 1,242,612,226 | 1,332,810,869 | |||||||
Neither Hong Kong nor Macau recognizes the official ethnic classifications maintained by the central government. In Macau, the largest substantial ethnic groups of non-Chinese descent are the Macanese, of mixed Chinese and Portuguese descent (Eurasians), as well as migrants from the Philippines and Thailand. Overseas Filipinas working as domestic workers comprise the largest non-Han Chinese ethnic group in Hong Kong.
People from other immigration jurisdictions
The 2010 Census counted 234,829 residents from Hong Kong, 21,201 residents from Macao, 170,283 residents from Taiwan, and 593,832 residents from other locations, totaling 1,020,145 residents.[24]
| Nationality | Residents |
|---|---|
| South Korea | 120,750 |
| United States | 71,493 |
| Japan | 66,159 |
| Burma | 39,776 |
| Vietnam | 36,205 |
| Canada | 19,990 |
| France | 15,087 |
| India | 15,051 |
| Germany | 14,446 |
| Australia | 13,286 |
| Other countries | 181,589 |
| TOTAL | 593,832 |
Languages
The official spoken standard in the People's Republic of China is Standard Chinese, also known as Putonghua. Its pronunciation is based on the Beijing dialect of the Mandarin Chinese dialect group, which was traditionally the formal version the Chinese language.[25]
Other languages include other varieties of Chinese: Mandarin dialects, as well as Wu (Shanghainese), Yue (Cantonese), Eastern Min (Fuzhou), Southern Min (Hokkien or Taiwanese and Teochiu), Xiang, Gan and Hakka; there are also minority languages spoken in China.
Over 70% of the Han ethnic group are native speakers of the Mandarin group of dialects spoken in northern and southwestern China. The rest, concentrated in south and southeast China, speak one of the six other major Chinese varieties. In addition to their own local dialect, nearly all Chinese also speak Standard Mandarin (Putonghua), which is the language of instruction in all schools and is used for formal and official purposes.
Non-Chinese languages spoken widely by ethnic minorities include Mongolian, Tibetan, Uyghur language and other Turkic languages (in Xinjiang), Korean (in the northeast), and Vietnamese (in the southeast).
In addition to Chinese, in the special administrative regions, English is an official language of Hong Kong and Portuguese is an official language of Macau. Patuá is a Portuguese creole spoken by a small number of Macanese. English, though not official, is widely used in Macau. In both of the special administrative regions, the dominant spoken form of Chinese is Cantonese.
For written Chinese, the PRC officially uses simplified Chinese characters in mainland China, while traditional Chinese characters are used in Hong Kong and Macau.
The de facto spoken standard in Hong Kong and Macao is Cantonese, although officially it is just the Chinese language, not specifying which spoken form is standard. The written official standard in Hong Kong and Macao is Mandarin in traditional Chinese characters.
On 1 January 1979, the PRC Government officially adopted the hanyu pinyin system for spelling Chinese names and places in mainland China in Roman letters. A system of romanization invented by the Chinese, pinyin has long been widely used in mainland China on street and commercial signs as well as in elementary Chinese textbooks as an aid in learning Chinese characters. Variations of pinyin also are used as the written forms of several minority languages.
Pinyin replaced other conventional spellings in mainland China's English-language publications. The U.S. Government and United Nations also adopted the pinyin system for all names of people and places in mainland China. For example, the capital of the PRC is spelled "Beijing" rather than "Peking".
Religions
.png)
.png)
.png)
.png)
.png)
.png)
| Province | Chinese ancestorism[26] |
Buddhism[34] | Christianity[34] | Islam[35] |
|---|---|---|---|---|
| Fujian | 31.31% | 40.40% | 3.97% | 0.32% |
| Zhejiang | 23.02% | 23.99% | 3.89% | <0.2% |
| Guangxi | 40.48% | 10.23% | 0.15% | <0.2% |
| Guangdong | 43.71% | 5.18% | 0.68% | <0.2% |
| Yunnan | 32.22% | 13.06% | 0.68% | 1.52% |
| Guizhou | 31.18% | 1.86% | 0.49% | 0.48% |
| Jiangsu | 16.67% | 14.17% | 2.67% | <0.2% |
| Jiangxi | 24.05% | 7.96% | 0.66% | <0.2% |
| Shandong | 25.28% | 2.90% | 1.54% | 0.55% |
| Chongqing | 26.63% | 0.85% | 0.28% | <0.2% |
| Hunan | 20.19% | 2.44% | 0.49% | <0.2% |
| Shanxi | 15.61% | 3.65% | 1.55% | <0.2% |
| Henan | 7.94% | 5.52% | 4.95% | 1.05% |
| Jilin | 7.73% | 8.23% | 3.26% | <0.2% |
| Anhui | 4.64% | 7.83% | 4.32% | 0.58% |
| Gansu | 3.51% | 6.85% | 0.28% | 6.64% |
| Heilongjiang | 7.73% | 4.39% | 3.63% | 0.35% |
| Shaanxi | 7.58% | 6.35% | 1.66% | 0.4% |
| Liaoning | 7.73% | 5.31% | 1.99% | 0.64% |
| Sichuan | 10.6% | 2.06% | 0.30% | <0.2% |
| Hubei | 6.5% | 2.09% | 1.71% | <0.2% |
| Hebei | 5.52% | 1.59% | 1.13% | 0.82% |
| Hainan | – | – | 0.48%[26] | <0.2% |
| Beijing | – | 11.2%[37] | 0.78%[26] | 1.76% |
| Shanghai | – | 10.30% | 1.88% | 0.36% |
| Tianjin | – | – | 0.43% | <0.2% |
| Tibet | – | ~78%[38] | – | 0.39% |
| Xinjiang | – | – | 1.0%[26] | 57.99% |
| Ningxia | – | – | 1.17%[26] | 33.99% |
| Qinghai | – | – | 0.76%[26] | 17.51% |
| Inner Mongolia | 2.36% | 12.1%[39] | 2.0%[26] | 0.91% |
| China | 16%[40] | 15%[41][42] | 2.5%[41][42] | 2%[36]:13 |
- General surveys' results
|
|
|
|
- Geographic and socioeconomic distributions
| Religious community | Weighed proportion (%) | Male proportion (%) | Average age (years) | Agricultural household proportion (%) | Ethnic minority proportion (%) | Married proportion (%) | Communist Party member proportion (%) | Education (years) | Annual family income (yuan) |
|---|---|---|---|---|---|---|---|---|---|
| Traditional folk religion | 31.09 | 64.8 | 46.46 | 96.4 | 1.1 | 94.6 | 9.8 | 5.94 | 29.772 |
| Buddhism | 10.85 | 54.4 | 49.44 | 95.8 | 0.0 | 92.1 | 9.8 | 5.88 | 38.911 |
| Protestantism | 3.54 | 47.7 | 49.66 | 89.2 | 4.6 | 96.9 | 4.6 | 5.83 | 24.168 |
| Taoism | 0.71 | 64.3 | 50.50 | 92.9 | 0.0 | 100 | 21.4 | 6.29 | 30.630 |
| Catholicism | 0.39 | 66.7 | 46.33 | 91.7 | 8.3 | 91.7 | 8.3 | 7.50 | 46.010 |
| Religious people average | 46.59 | 61.6 | 49.45 | 96.2 | 1.2 | 93.8 | 9.6 | 5.94 | 30.816 |
| Not religious people | 53.41 | 64.6 | 50.62 | 96.3 | 5.5 | 93.3 | 15.0 | 6.40 | 26.448 |
|
Religious self-identification of participants of the cultural nationalist movement in the mainland (2011)[49] Don't know (9.4%)
|
- ↑ Beijing, Shanghai, Nantong, Wuhan, Baoding.
- ↑ Although a lower 215 million, or 16% said they "believed in the existence" of ancestral spirits.
- ↑ Center for Chinese Agricultural Policy
- ↑ The populations surveyed were those of the provinces of Jiangsu, Sichuan, Shaanxi, Jilin, Hebei and Fujian.
- ↑ Mostly Catholicism (0.6%), while nobody declared affiliation with Protestantism (0%).
Migration
Internal migration in the People's Republic of China is one of the most extensive in the world according to the International Labour Organization.[50] In fact, research done by Kam Wing Chan of the University of Washington suggests that "In the 30 years since 1979, China's urban population has grown by about 440 million to 622 million in 2009. Of the 440 million increase, about 340 million was attributable to net migration and urban reclassification. Even if only half of that increase was migration, the volume of rural-urban migration in such a short period is likely the largest in human history."[51] Migrants in China are commonly members of a floating population, which refers primarily to migrants in China without local household registration status through the Chinese Hukou system.[52] In general, rural-urban migrant workers are most excluded from local educational resources, citywide social welfare programs and many jobs because of their lack of hukou status.[53]
In 2011 a total of 252.78 million migrant workers (an increase of 4.4% compared to 2010) existed in China. Out of these, migrant workers who left their hometown and worked in other provinces accounted for 158.63 million (an increase of 3.4% compared to 2010) and migrant workers who worked within their home provinces reached 94.15 million (an increase of 5.9% compared to 2010).[54] Estimations are that Chinese cities will face an influx of another 243 million migrants by 2025, taking the urban population up to nearly 1 billion people.[55] This population of migrants would represent "almost 40 percent of the total urban population," a number which is almost three times the current level.[55][56] While it is often difficult to collect accurate statistical data on migrant floating populations, the number of migrants is undoubtedly quite large. “In China’s largest cities, for instance, it is often quoted that at least one out of every five persons is a migrant.”[57] China's government influences the pattern of urbanization through the Hukou permanent residence registration system, land-sale policies, infrastructure investment and the incentives offered to local government officials. The other factors influencing migration of people from rural provincial areas to large cities are employment, education, business opportunities and higher standard of living.[58]
The mass emigration known as the Chinese diaspora, which occurred from the 19th century to 1949, was mainly caused by wars and starvation in mainland China, invasion from various foreign countries, as well as the problems resulting from political corruption. Most immigrants were illiterate peasants and manual labourers, called "coolies" by analogy to the same pattern of immigration from India, who emigrated to work in countries such as the Americas, Australia, South Africa and Southeast Asia.
Urbanization
.jpg)
Urbanization increased in speed following the initiation of the reform and opening policy. By the end of 2014, 54.7% of the total population lived in urban areas, a rate that rose from 26% in 1990.[59]
Demographic statistics
Demographic statistics according to the World Population Review.[60]
- One birth every 2 seconds
- One death every 3 seconds
- One net migrant every 2 minutes
- Net gain of one person every 6 seconds
The following demographic statistics are from the CIA World Factbook, unless otherwise indicated.[61] No statistics have been included for areas currently governed by the Republic of China (Taiwan). Unless stated otherwise, statistics refer only to mainland China. (See Demographics of Hong Kong and Demographics of Macau.)
- Population
- Mainland only: 1,379,302,771 (2015)
- Hong Kong: 7,191,503 (2015)
- Macau: 601,969 (2015)
- Total: 1,387,096,243 (2015).
- Population rank: 1 (See List of countries by population.)
- Urban-rural ratio
- Urban: 55.8% (2015) — 779,478,624
- Rural: 44.2% (2015) — 617,549,929
- Age structure
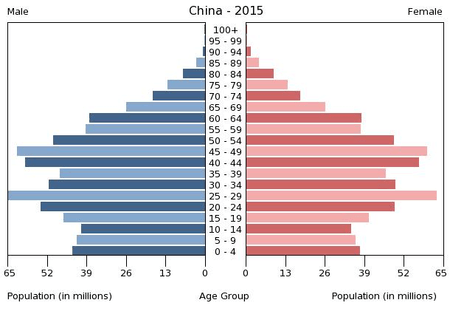
starting with 0–5 years in the bottom box.
Effects of the one-child policy result in smaller age cohorts in recent years.
- 0-14 years: 17.15% (male 127,484,177/female 109,113,241)
- 15-24 years: 12.78% (male 94,215,607/female 82,050,623)
- 25-54 years: 48.51% (male 341,466,438/female 327,661,460)
- 55-64 years: 10.75% (male 74,771,050/female 73,441,177)
- 65 years and over: 10.81% (male 71,103,029/female 77,995,969) (2017 est.)
- 0–14 years: 17.15% (2015)
- 15–64 years: 72.04% (2015)
- 65 years and: 10.81% (2015)
- Median age
- total: 37.4 years Country comparison to the world: 67th
- male: 36.5 years
- female: 38.4 years (2017 est.)
- Population growth rate
- 0.41% (2017 est.) Country comparison to the world: 160th
- Birth rate
- 12.3 births/1,000 population (2017 est.) Country comparison to the world: 161st
- Death rate
- 7.8 deaths/1,000 population (2017 est.) Country comparison to the world: 101st
- Net migration rate
- -0.4 migrant(s)/1,000 population (2017 est.) Country comparison to the world: 121st
- Population growth rate
- Population growth rate: 0.59% (2016)
- Sex distribution
- Sex distribution: 104.98 (2016)
- Sex ratio
- At birth: 1.15 male(s)/female (2015)
- Under 15 years: 1.17 male(s)/female (2015)
- 15–64 years: 1.08 male(s)/female (2015)
- 65 years and over: 0.92 male(s)/female (2015)
- Total population: 1.05 male(s)/female (2016)
- Infant mortality rate
- Total: 12.2 deaths/1,000 live births (2015 est)
- Male: 12.4 deaths/1,000 live births (2015 est)
- Female: 12.0 deaths/1,000 live births (2015 est)
- Urbanization
- urban population: 59.2% of total population (2018)
- rate of urbanization: 2.42% annual rate of change (2015-20 est.)
note: data do not include Hong Kong and Macau
- Life expectancy at birth
- Total population: 76.34 years (2015)
- Male: 73.64 years (2015)
- Female: 79.43 years (2015)
- Religious affiliation
- Predominantly: Mahayana Buddhism, Taoism (Chinese folk religion), Confucianism (via ancestral worship).
- Others: Christianity (3% – 4%), Islam (1.5%), ethnic minority religions, others.
- Note: State atheism, but traditionally pragmatic and eclectic.
See also
Notes
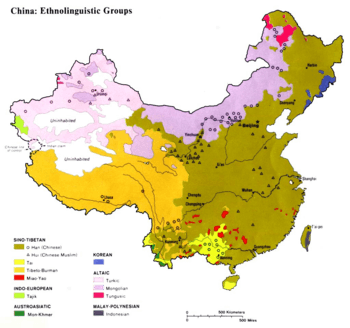
- ↑ Source: United States Central Intelligence Agency, 1983. The map shows the distribution of ethnolinguistic groups according to the historical majority ethnic groups by region. Note this is different from the current distribution due to age-long internal migration and assimilation.
- ↑ Chinese ancestral or lineage religion is the worship of kin's ancestor-gods in the system of lineage churches and ancestral shrines. It is worthwhile to note that this does not include other forms of Chinese religion, such as the worship of national ancestral gods or the gods of nature (which in northern China is more common than ancestor worship), and Taoism and Confucianism.
- ↑ The map represents the geographic diffusion of the tradition of folk religious movements of salvation, Confucian churches and jiaohua ("transformative teachings") movements, based on historical data and contemporary fieldwork. Due to incomplete data and ambiguous identity of many of these traditions the map may not be completely accurate. Sources include a World Religion Map from Harvard University, based on data from the World Religion Database, showing highly unprecise ranges of Chinese folk (salvationist) religions' membership by province. Another source, the studies of China's Regional Religious System, find "very high activity of popular religion and secret societies and low Buddhist presence in northern regions, while very high Buddhist presence in the southeast".[27]
Historical record and contemporary scholarly fieldwork testify certain central and northern provinces of China as hotbeds of folk religious sects and Confucian religious groups.
- Hebei: Fieldwork by Thomas David Dubois[28] testifies the dominance of folk religious movements, specifically the Church of the Heaven and the Earth and the Church of the Highest Supreme, since their "energetic revival since the 1970s" (p. 13), in the religious life of the counties of Hebei. Religious life in rural Hebei is also characterised by a type of organisation called the benevolent churches and the salvationist movement known as Zailiism has returned active since the 1990s.
- Henan: According to Heberer and Jakobi (2000)[29] Henan has been for centuries a hub of folk religious sects (p. 7) that constitute significant focuses of the religious life of the province. Sects present in the region include the Baguadao or Tianli ("Order of Heaven") sect, the Dadaohui, the Tianxianmiaodao, the Yiguandao, and many others. Henan also has a strong popular Confucian orientation (p. 5).
- Northeast China: According to official records by the then-government, the Universal Church of the Way and its Virtue or Morality Society had 8 million members in Manchuria, or northeast China in the 1930s, making up about 25% of the total population of the area (note that the state of Manchuria also included the eastern end of modern-day Inner Mongolia).[30] Folk religious movements of a Confucian nature, or Confucian churches, were in fact very successful in the northeast.
- Shandong: The province is traditionally a stronghold of Confucianism and is the area of origin of many folk religious sects and Confucian churches of the modern period, including the Universal Church of the Way and its Virtue, the Way of the Return to the One (皈依道 Guīyīdào), the Way of Unity (一貫道 Yīguàndào), and others. Alex Payette (2016) testifies the rapid growth of Confucian groups in the province in the 2010s.[31]
- ↑ The statistics for Chinese ancestorism, that is the worship of ancestor-gods within the lineage system, are from the Chinese Spiritual Life Survey of 2010.[26] The statistics for Buddhism and Christianity are from the China Family Panel Studies survey of 2012.[34] The statistics for Islam are from a survey conducted in 2010.[35] It is worthwhile to note that the populations of Chinese ancestorism and Buddhism may overlap, even with the large remaining parts of the population whose belief is not documented in the table. The latter, the uncharted population, may practise other forms of Chinese religion, such as the worship of gods, Taoism, Confucianism and folk salvationisms, or may be atheist. Indeed, according to the CFPS 2012, only 6.3% of the Chinese were irreligious in the sense of "atheism", while the rest practised the worship of gods and ancestors.[36]:13
References
- ↑ "World Population Prospects: The 2017 Revision". ESA.UN.org (custom data acquired via website). United Nations Department of Economic and Social Affairs, Population Division. Retrieved 10 September 2017.
- ↑ Statistics about the Population Growth in China, 2001–2011, World Bank, July 2012. Retrieved 10 April 2013.
- ↑ "Tough road ahead for China census". Straitstimes.com. Retrieved 14 October 2013.
- 1 2 Banister, Judith (1992). "A Brief History of China's Population". A Brief History of China's Population, The Population of Modern China. pp. 51–57. doi:10.1007/978-1-4899-1231-2_3. ISBN 978-0-306-44138-7.
- 1 2 "中华人民共和国国家统计局 >> 人口普查公报". Stats.gov.cn. Archived from the original on 27 December 2013. Retrieved 14 October 2013.
- ↑ Du, Peng; Yang, Hui (2010). "China's population ageing and active ageing". China Journal of Social Work. 3 (2–3): 139–152. doi:10.1080/17525098.2010.492636.
- ↑ "Chinese mainland gender ratios most balanced since 1950s: census data". News.xinhuanet.com. 28 April 2011. Retrieved 14 October 2013.
- 1 2 3 4 Max Roser (2014), "Fertility Rate", Our World In Data, Gapminder Foundation
- ↑ "World Population Prospects – Population Division – United Nations". Retrieved 2017-07-15.
- ↑ "National Bureau of Statistics of China: China Statistical yearbook 2011, chapter 3 Population". Stats.gov.cn. Retrieved 14 October 2013.
- ↑ "China's Economy Realized a Moderate but Stable and Sound Growth in 2015". Stats.gov.cn. Retrieved 31 August 2017.
- 1 2 Times, Global. "Two-child policy brings China 1 million more newborns in 2016 - Global Times". Globaltimes.cn. Retrieved 31 August 2017.
- ↑ "National Economy Maintained the Momentum of Stable and Sound Development and Exceeded the Expectation". Stats.gov.cn. Retrieved 20 January 2018.
- ↑ "财新网-原创财经新媒体-CAIXIN.COM". english.caixin.com. Retrieved 31 August 2017.
- ↑ https://www.straitstimes.com/asia/east-asia/chinas-worrying-decline-in-birth-rate-china-daily-columnist
- ↑ "Pascal Rocha da Silva, Projection de la population chinoise 2000–2050, p. 9, cf" (PDF). Archived from the original (PDF) on 11 August 2013. Retrieved 14 October 2013.
- ↑ "FERTILITY IN CHINA IN 2000: A COUNTY LEVEL ANALYSIS" (PDF). Txspace.tamu.edu. Archived from the original (PDF) on 16 June 2007. Retrieved 30 August 2017.
- 1 2 Wang Guang-zhou; Fu Chong-hui. "New fertility changes and characteristics from the sixth population census in China" (PDF). Iussp.org. Retrieved 31 August 2017.
- ↑ Team, Discuz! Team and Comsenz UI. "科学网—2010年人口普查各民族人口数据 - 易富贤的博文". blog.sciencenet.cn. Retrieved 31 August 2017.
- ↑ Jamil Anderliniin; Ed Crooks (19 January 2013). "Chinese Labor Pool Begins to Drain". CNBC. Financial Times. Retrieved 8 February 2013.
- ↑ "CIA World Fact Book". Cia.gov. Retrieved 27 November 2013.
- ↑ "Chinese people getting 'taller and fatter'". News.yahoo.com. Retrieved 31 August 2017.
- ↑ "2-1 全国各民族分年龄、性别的人口" (XLS). Stats.gov.cn. Retrieved 31 August 2017.
- ↑ "Major Figures on Residents from Hong Kong, Macao and Taiwan and Foreigners Covered by 2010 Population Census". Stats.gov.cn. Archived from the original on 14 May 2011. Retrieved 14 October 2013.
- ↑ Dong, J. (2010). The enregisterment of Putonghua in practice. Language & Communication, 30(4), 265-275.
- 1 2 3 4 5 6 7 8 9 Data from the Chinese Spiritual Life Survey (CSLS) 2010 for Chinese ancestorists, and from the Chinese General Social Survey (CGSS) 2009 for Christians. Reported in Wang, Xiuhua (2015). "Explaining Christianity in China: Why a Foreign Religion has Taken Root in Unfertile Ground" (PDF). Baylor University. p. 15. Archived from the original (PDF) on 25 September 2015.
- ↑ Wu, Jiang; Tong, Daoqin. "Spatial Analysis and GIS Modeling of Regional Religious Systems in China" (PDF). University of Arizona. Archived from the original (PDF) on 27 April 2017.
- ↑ Dubois (2005).
- ↑ Heberer, Thomas; Jakobi, Sabine (2000). "Henan - The Model: From Hegemonism to Fragmentism. Portrait of the Political Culture of China's Most Populated Province" (PDF). Duisburg Working Papers on East Asian Studies (32).
- ↑ Ownby (2008).
- ↑ Payette (2016).
- ↑ Lu 卢, Yunfeng 云峰 (2014). "卢云峰:当代中国宗教状况报告——基于CFPS(2012)调查数据" [Report on Religions in Contemporary China – Based on CFPS (2012) Survey Data] (PDF). World Religious Cultures (1). Archived from the original (PDF) on 9 August 2014. p. 13. The report compares the data of the China Family Panel Studies 2012 with those of the Renmin University's Chinese General Social Survey (CGSS) of the years 2006, 2008, 2010 and 2011.
- ↑ "Taoism in China" (Map). Taoism's incidence by province of China. Archived from the original on 27 April 2017. The map illustrates local religion led by Taoist specialists, forms and institutions.
- 1 2 3 4 5 Data from the China Family Panel Studies (CFPS) 2012. Reported in Gai, Rong Hua; Gao, Jun Hui (22 December 2016). "Multiple-Perspective Analysis on the Geological Distribution of Christians in China". PEOPLE: International Journal of Social Sciences. 2 (1). pp. 809–817. doi:10.20319/pijss.2016.s21.809817. ISSN 2454-5899.
- 1 2 3 Data from Yang, Zongde (2010). "Study on Current Muslim Population in China" (PDF). Jinan Muslim (2). Archived from the original (PDF) on 27 April 2017. Reported in Min, Junqing (2013). "The Present Situation and Characteristics of Contemporary Islam in China" (PDF). JISMOR (8). Archived from the original (PDF) on 24 June 2017. p. 29.
- 1 2 China Family Panel Studies 2012. Reported and compared with Chinese General Social Survey (CGSS) 2006, 2008, 2010 and 2011 in Lu 卢, Yunfeng 云峰 (2014). "卢云峰:当代中国宗教状况报告——基于CFPS(2012)调查数据" [Report on Religions in Contemporary China – Based on CFPS (2012) Survey Data] (PDF). World Religious Cultures (1). Archived from the original (PDF) on 9 August 2014.
- ↑ Lai, Hongyi (2016). China's Governance Model: Flexibility and Durability of Pragmatic Authoritarianism. Routledge. ISBN 978-1317859529. p. 167.
- ↑ "Internazional Religious Freedom Report 2012" (PDF). US Government. p. 20, quoting: "Most ethnic Tibetans practice Tibetan Buddhism, although a sizeable minority practices Bon, an indigenous religion, and very small minorities practice Islam, Catholicism, or Protestantism. Some scholars estimate that there are as many as 400,000 Bon followers across the Tibetan Plateau. Scholars also estimate that there are up to 5,000 ethnic Tibetan Muslims and 700 ethnic Tibetan Catholics in the TAR".
- ↑ Wu, Jiayu; Fang, Yong (January 2016). "Study on the Protection of the Lama Temple Heritage in Inner Mongolia as a Cultural Landscape". Journal of Asian Architecture and Building Engineering. 15 (1). Archived from the original on 24 September 2017. Note that the article, in an evident mistranslation from Chinese, reports 30 million Tibetan Buddhists in Inner Mongolia instead of 3 million.
- ↑ 2010 Chinese Spiritual Life Survey, Purdue University's Center on Religion and Chinese Society. Data reported in Wenzel-Teuber, Katharina; Strait, David (2012). "People's Republic of China: Religions and Churches Statistical Overview 2011" (PDF). Religions & Christianity in Today's China. II (3). pp. 29–54. ISSN 2192-9289. Archived from the original (PDF) on 27 April 2017.
- 1 2 For China Family Panel Studies 2014 survey results see release #1 (archived) and release #2 (archived). The tables also contain the results of CFPS 2012 (sample 20,035) and Chinese General Social Survey (CGSS) results for 2006, 2008 and 2010 (samples ~10.000/11,000). Also see, for comparison CFPS 2012 data in Lu 卢, Yunfeng 云峰 (2014). "卢云峰:当代中国宗教状况报告——基于CFPS(2012)调查数据" [Report on Religions in Contemporary China – Based on CFPS (2012) Survey Data] (PDF). World Religious Cultures (1). Archived from the original (PDF) on 9 August 2014. p. 13, reporting the results of the CGSS 2006, 2008, 2010 and 2011, and their average (fifth column of the first table).
- 1 2 Wenzel-Teuber, Katharina. "Statistics on Religions and Churches in the People's Republic of China – Update for the Year 2016" (PDF). Religions & Christianity in Today's China. VII (2). pp. 26–53. Archived from the original (PDF) on 22 July 2017.
- ↑ Yao, Xinzhong (May 2007). "Religious Belief and Practice in Urban China 1995-2005". Journal of Contemporary Religion. 22 (2). pp. 169-185.
- ↑ "Religion in China on the Eve of the 2008 Beijing Olympics". Religion and Public Life Project. Pew Research Center. 2008.
- 1 2 China Family Panel Studies 2012. Reported and compared with Chinese General Social Survey (CGSS) 2006, 2008, 2010 and 2011 in Lu 卢, Yunfeng 云峰 (2014). "卢云峰:当代中国宗教状况报告——基于CFPS(2012)调查数据" [Report on Religions in Contemporary China – Based on CFPS (2012) Survey Data] (PDF). World Religious Cultures (1). Archived from the original (PDF) on 9 August 2014.
- ↑ 2010 Chinese Spiritual Life Survey, Purdue University's Center on Religion and Chinese Society. Data reported in Wenzel-Teuber, Katharina; Strait, David (2012). "People's Republic of China: Religions and Churches Statistical Overview 2011" (PDF). Religions & Christianity in Today's China. 2 (3). pp. 29–54. ISSN 2192-9289. Archived from the original (PDF) on 27 April 2017.
- ↑ Yu Tao (2012). "A Solo, a Duet, or an Ensemble? Analysing the Recent Development of Religious Communities in Contemporary Rural China". ECRAN – Europe-China Research and Advice Network, University of Nottingham.
- ↑ Sun, Shangyang; Li, Ding. "Chinese Traditional Culture Study Fever, Scarcity of Meaning and the Trend of University Students' Attitudes towards Religions: A Survey in Beijing". Journal of Sino-Western Studies (2011). pp. 53–68.
- ↑ Yang, Fenggang; Tamney, Joseph (2011). Confucianism and Spiritual Traditions in Modern China and Beyond. Brill. ISBN 9004212396. . p. 67.
- ↑ "Labour migration". International Labour Organization. Retrieved 2013-10-20.
- ↑ Chan, Kam Wing; Peter Bellwood (2011). "China, Internal Migration" (PDF). In Immanuel Ness (ed.). The Encyclopedia of Global Migration. Blackwell Publishing. pp. 1–46. Retrieved 2013-10-20.
- ↑ Liang, Zai; Zhongdong Ma (2004). "China's floating population: new evidence from the 2000 census". Population and Development Review. 30 (3): 467–488. doi:10.1111/j.1728-4457.2004.00024.x.
- ↑ Chan, Kam Wing; Li Zhang (1999). "The Hukou System and Rural-Urban Migration in China: Processes and Changes". The China Quarterly. 160: 818–855. doi:10.1017/s0305741000001351.
- ↑ "Statistical Communiqué on the 2011 National Economic and Social Development". National Bureau of Statistics of China. 2012. Retrieved 6 August 2012.
beneath figure 3
- 1 2 Shanghai, Geoff Dyer in (23 March 2008). "China braced for wave of urban migrants". Financial Times. ISSN 0307-1766. Retrieved 2013-11-15.
- ↑ Woetzel, Jonathan; Lenny Mendonca, Janamitra Devan, Stefano Negri, Yangmei Hu, Luke Jordan, Xiujun Li, Alexander Maasry, Geoff Tsen, Flora Yu (March 2009), Preparing for China's urban billion, McKinsey Global Institute
- ↑ Wang, Feng; Xuejin Zuo (May 1999). "Inside China's Cities: Institutional Barriers and Opportunities for Urban Migrants". The American Economic Review. 89 (2): 276–280. doi:10.1257/aer.89.2.276. JSTOR 117120.
- ↑ Griffiths, Michael. B. (2010) 'Lamb Buddha's Migrant Workers: Self-assertion on China’s Urban Fringe’. Journal of Current Chinese Affairs (China Aktuell), 39, 2, 3–37.
- ↑ "Chinese urban population 54.77 pct of total". Xinhua. 20 January 2015.
- ↑ "China Population 2018", World Population Review
- ↑ "World Factbook EUROPE : CHINA", The World Factbook, July 12, 2018
- ↑ "China – Religion". Atheism.about.com. 16 December 2009. Archived from the original on 15 May 2013. Retrieved 14 October 2013.
- ↑ "CIA Factbook – China". Cia.gov. Retrieved 14 October 2013.
- ↑ "Bureau of East Asian and Pacific Affairs – Background Note: China". State.gov. 16 August 2013. Retrieved 14 October 2013.
- ↑ "Chinese Religions". Asia.msu.edu. 15 May 2013. Retrieved 14 October 2013.

http://worldhistorysite.com/population.html
https://zh.wikipedia.org/wiki/%E4%B8%AD%E5%9B%BD%E4%BA%BA%E5%8F%A3%E5%8F%B2
| Sino-Tibetan |
| ||||||||
|---|---|---|---|---|---|---|---|---|---|
| Austroasiatic | |||||||||
| Hmong-Mien | |||||||||
| Mongolic | |||||||||
| Tai-Kadai | |||||||||
| Tungusic | |||||||||
| Turkic | |||||||||
| Unrecognized | |||||||||
| Others | |||||||||