Demographics of Gabon
The Demographics of Gabon is the makeup of the population of Gabon. As of 2016, Gabon has a population of 1,979,786[1]. Gabon's population is relatively young with 35.5% of its population under 15 years of age and only 4.3% of its population over 65 years old. Gabon has a nearly even split between males and females with 0.99 males for every female in the population. In the age range of 15–65, the ration is exactly 1 male to 1 female. The life expectancy of Gabon is lower than the world average. Gabon's population's life expectancy at birth is 53.11 years while the world average is 67.2 years as of 2010. Ethnically, the biggest group in Gabon are the Fang people with over 500,000 people, or about a third of Gabon's population, belonging to this ethnic group. The biggest religion in Gabon is Christianity, with between 55–75% of the population of Gabon being Christian.
Population statistics
The following demographic statistics are from the CIA World Factbook, unless otherwise indicated.
Population:1,514,993
note:
Estimates for this country explicitly take into account the effects of excess mortality due to AIDS; this can result in lower life expectancy, higher infant mortality and death rates, lower population and growth rates, and changes in the distribution of population by age and sex than would otherwise be expected (July 2010 est.)
Sex ratio:
at birth:
1.03 male(s)/female
under 15 years:
1.01 male(s)/female
15–64 years:
1 male(s)/female
65 years and over:
0.72 male(s)/female
total population:
0.99 male(s)/female (2010 est.)
Life expectancy at birth:
total population:
53.11 years
male:
52.19 years
female:
54.05 years (2010 est.)
Population
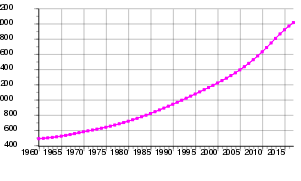
According to the 2017 revision of the World Population Prospects[1] the total population was 1,979,786 in 2016, compared to only 469,000 in 1950. The proportion of children below the age of 15 in 2010 was 35.5%, 60.2% was between 15 and 65 years of age, while 4.3% was 65 years or older .[2]
| Total population (thousands) | Population aged 0–14 (%) | Population aged 15–64 (%) | Population aged 65+ (%) | |
|---|---|---|---|---|
| 1950 | 469 | 28.4 | 64.3 | 7.3 |
| 1955 | 476 | 29.4 | 63.5 | 7.1 |
| 1960 | 486 | 30.3 | 62.6 | 7.1 |
| 1965 | 502 | 31.9 | 61.1 | 7.1 |
| 1970 | 530 | 33.0 | 59.9 | 7.1 |
| 1975 | 595 | 35.2 | 58.0 | 6.8 |
| 1980 | 683 | 37.7 | 55.9 | 6.4 |
| 1985 | 794 | 40.0 | 54.0 | 6.0 |
| 1990 | 929 | 41.4 | 53.0 | 5.6 |
| 1995 | 1,087 | 42.0 | 52.8 | 5.1 |
| 2000 | 1,235 | 41.0 | 54.3 | 4.8 |
| 2005 | 1,371 | 38.6 | 57.0 | 4.4 |
| 2010 | 1,505 | 35.5 | 60.2 | 4.3 |
Structure of the population (DHS 2012; males 19,318, females 20,636, total 39,955):
| Age group | Male (%) | Female (%) | Total (%) |
|---|---|---|---|
| 0–4 | 16.0 | 14.3 | 15.1 |
| 5–9 | 12.4 | 12.4 | 12.4 |
| 10–14 | 12.0 | 12.5 | 12.3 |
| 15–19 | 9.6 | 9.9 | 9.7 |
| 20–24 | 7.6 | 9.6 | 8.7 |
| 25–29 | 7.5 | 8.4 | 8.0 |
| 30–34 | 7.8 | 7.0 | 7.4 |
| 35–39 | 6.6 | 5.4 | 5.9 |
| 40–44 | 5.4 | 4.4 | 4.9 |
| 45–49 | 4.1 | 3.3 | 3.7 |
| 50–54 | 3.4 | 4.2 | 3.8 |
| 55–59 | 2.0 | 2.3 | 2.1 |
| 60–64 | 2.6 | 1.7 | 2.1 |
| 65–69 | 1.1 | 1.4 | 1.2 |
| 70–74 | 0.9 | 1.3 | 1.1 |
| 75–79 | 0.6 | 0.7 | 0.6 |
| 80+ | 0.5 | 1.3 | 0.9 |
| Age group | Male (%) | Female (%) | Total (%) |
|---|---|---|---|
| 0–14 | 40.4 | 39.2 | 39.8 |
| 15–64 | 56.5 | 56.1 | 56.4 |
| 65+ | 3.1 | 4.7 | 3.8 |
Vital statistics
Registration of vital events is in Gabon not complete. The Population Department of the United Nations prepared the following estimates. [2]
| Period | Live births per year | Deaths per year | Natural change per year | CBR* | CDR* | NC* | TFR* | IMR* |
|---|---|---|---|---|---|---|---|---|
| 1950–1955 | 14,000 | 13,000 | 1,000 | 30.5 | 27.7 | 2.8 | 4.00 | 179 |
| 1955–1960 | 14,000 | 12,000 | 2,000 | 30.1 | 25.9 | 4.2 | 4.00 | 167 |
| 1960–1965 | 15,000 | 12,000 | 3,000 | 31.4 | 24.8 | 6.5 | 4.25 | 158 |
| 1965–1970 | 17,000 | 11,000 | 6,000 | 32.5 | 21.7 | 10.7 | 4.50 | 134 |
| 1970–1975 | 20,000 | 11,000 | 9,000 | 35.4 | 19.1 | 16.3 | 4.90 | 114 |
| 1975–1980 | 24,000 | 10,000 | 13,000 | 37.5 | 16.4 | 21.0 | 5.10 | 95 |
| 1980–1985 | 28,000 | 10,000 | 18,000 | 38.4 | 13.7 | 24.7 | 5.20 | 78 |
| 1985–1990 | 33,000 | 10,000 | 23,000 | 38.1 | 11.3 | 26.8 | 5.15 | 63 |
| 1990–1995 | 38,000 | 11,000 | 28,000 | 38.0 | 10.5 | 27.4 | 5.10 | 59 |
| 1995–2000 | 39,000 | 12,000 | 27,000 | 33.2 | 10.2 | 23.0 | 4.37 | 58 |
| 2000–2005 | 39,000 | 14,000 | 25,000 | 29.7 | 10.4 | 19.3 | 3.78 | 58 |
| 2005–2010 | 39,000 | 13,000 | 26,000 | 27.4 | 9.4 | 18.0 | 3.35 | 51 |
| * CBR = crude birth rate (per 1000); CDR = crude death rate (per 1000); NC = natural change (per 1000); IMR = infant mortality rate per 1000 births; TFR = total fertility rate (number of children per woman) | ||||||||
Fertility and births
Total Fertility Rate (TFR) (Wanted Fertility Rate) and Crude Birth Rate (CBR):[3]
| Year | CBR (Total) | TFR (Total) | CBR (Urban) | TFR (Urban) | CBR (Rural) | TFR (Rural) |
|---|---|---|---|---|---|---|
| 2000 | 33.1 | 4.3 (3.5) | 33.3 | 3.9 (3.2) | 32.4 | 5.7 (4.7) |
| 2012 | 33.3 | 4.1 (3.2) | 33.2 | 3.9 (3.0) | 33.4 | 6.1 (4.6) |
Fertility data as of 2012 (DHS Program):[4]
| Province | Total fertility rate | Percentage of women age 15–49 currently pregnant | Mean number of children ever born to women age 40–49 |
|---|---|---|---|
| Libreville/Port-Gentil | 3.5 | 9.3 | 4.4 |
| Estuaire (except Libreville) | 4.1 | 8.6 | 5.2 |
| Haut-Ogooué | 4.9 | 10.3 | 5.8 |
| Moyen-Ogooué | 4.9 | 8.9 | 5.4 |
| Ngounié | 5.7 | 10.9 | 6.0 |
| Nyanga | 5.7 | 10.7 | 6.2 |
| Ogooué Maritime (except Port-Gentil) | 4.8 | 9.8 | 4.6 |
| Ogooué-Ivindo | 6.7 | 14.0 | 6.6 |
| Ogooué-Lolo | 5.3 | 11.3 | 5.9 |
| Woleu-N’tem | 5.0 | 9.8 | 4.7 |
Life expectancy
| Period | Life expectancy in Years[5] |
|---|---|
| 1950–1955 | 37.00 |
| 1955–1960 | |
| 1960–1965 | |
| 1965–1970 | |
| 1970–1975 | |
| 1975–1980 | |
| 1980–1985 | |
| 1985–1990 | |
| 1990–1995 | |
| 1995–2000 | |
| 2000–2005 | |
| 2005–2010 | |
| 2010–2015 |
Ethnic groups
Broad ethnic groups are:
- Bantu tribes including four major tribal groupings (Fang, Eshira, Punu, Teke)
- other Africans, notably 'forest people' (pygmee, now sedentarizing) such as the Babongo tribe
- Europeans, including 10,700 French and 11,000 persons of dual nationality
Specific groups, and estimated population:[6]
- Baka (3,825)
- Bakwele people (5,858)
- Barama people (7,170)
- Benga people (2,390)
- Bhubhi people (5,858)
- Duma people (8,368)
- Eshira people (20,317)
- Fang people (500,299)
- Fon people (16,403)
- Fulani people (5,746)
- Gun people (16,403)
- Hausa people (8,619)
- Kande people (1,427)
- Kaningi people (8,567)
- Kele people (10,774)
- Kota people (53,780)
- Lumbu people (13,515)
- Mahongwe people (4,875)
- Mbaama people (9,373)
- Mbahouin people (2,297)
- Mbede people (103,381)
- Mbwisi people (1,609)
- Minduumo people (5,029)
- Miyangho people (7,140)
- Myene people (41,828)
- Ndasa people (2,872)
- Ngom people (9,625)
- Northern Teke people (14,283)
- Nzebi people (127,714)
- Pinji people (7,140)
- Punu people (146,820)
- Sake people (3,346)
- Sangu people (28,573)
- Seki people (1,399)
- Sighu people (1,427)
- Simba people (4,285)
- Tsangi people (5,975)
- Tsogo people (37,047)
- Vili people (4,311)
- Vumbu people (15,537)
- Wandji people (12,240)
- Western Teke people (38,244)
- Wolof people (7,184)
- Wumbvu people (21,404)
Language and religion
Religions:[7] Roman Catholic 41.9%, Protestant 13.7%, other Christian 32.4%, Islam 6.4%, Animist 0.3%, other 0.3%, None/No Answer 5% (2012 est.)
Languages: French (official since colonial rule), Fang, Myene, Bateke, Bapounou/Eschira, Bandjabi
Literacy:
[7]
definition:
age 15 and over can read and write
total population:
83.2%
male:
85.3%
female:
81% (2015 est.)
References
| Wikimedia Commons has media related to Demographics of Gabon. |
- 1 2 "World Population Prospects: The 2017 Revision". ESA.UN.org (custom data acquired via website). United Nations Department of Economic and Social Affairs, Population Division. Retrieved 10 September 2017.
- 1 2 "Population Division of the Department of Economic and Social Affairs of the United Nations Secretariat, World Population Prospects: The 2010 Revision". Esa.un.org. Retrieved 7 November 2017.
- ↑ "MEASURE DHS: Demographic and Health Surveys". Microdata.worldbank.org. Retrieved 7 November 2017.
- ↑ "Enquête Démographique et de Santé 2012" (PDF). Dhsprogram.com. Retrieved 7 November 2017.
- ↑ "World Population Prospects - Population Division - United Nations". esa.un.org. Retrieved 2018-08-26.
- ↑ "Missionary Atlas Project - West Africa - Gabon" (PDF). Worldmap. Retrieved 7 November 2017.
- 1 2 "Africa :: GABON". CIA The World Factbook.
![]()