Demographics of Seychelles
This article is about the demographic features of the population of Seychelles, including population density, ethnicity, education level, health of the populace, economic status, religious affiliations and other aspects of the population.
About 90% of the Seychellois people live on the island of Mahé. Most of the rest live on Praslin and La Digue, with the remaining smaller islands either sparsely populated or uninhabited.
Most Seychellois are descendants of early French settlers and East Africans who arrived in the 19th century. Tamils, along with other South Indians and Chinese (1.1% of the population) account for the other permanent inhabitants. About 1,703 (2000) expatriates live and work in Seychelles.
Seychelles culture is a mixture of French and African (Creole) influences. The local Seychellois Creole (Kreol), a creole language derived from French and African tongues, is the native language of 91.8% of the people; but English and French are also commonly used. English remains the language of government and commerce.
About 91.9% of the adult population is literate, and the literacy rate of school-aged children has risen to well over 98%. Increases are expected, as nearly all children of primary school age attend school, and the government encourages adult education.
Vital statistics
| Population (in thousands)[1][2] | Live births | Deaths | Natural change | Crude birth rate (per 1000) | Crude death rate (per 1000) | Natural change (per 1000) | TFR | |
|---|---|---|---|---|---|---|---|---|
| 1950 | 36 | 1 061 | 418 | 643 | 29.5 | 11.6 | 17.9 | |
| 1951 | 34 | 1 033 | 425 | 608 | 30.4 | 12.5 | 17.9 | |
| 1952 | 36 | 1 037 | 456 | 581 | 28.8 | 12.7 | 16.1 | |
| 1953 | 37 | 1 169 | 438 | 731 | 31.6 | 11.8 | 19.8 | |
| 1954 | 37 | 1 209 | 457 | 752 | 32.7 | 12.4 | 20.3 | |
| 1955 | 39 | 1 303 | 456 | 847 | 33.4 | 11.7 | 21.7 | |
| 1956 | 38 | 1 458 | 468 | 990 | 38.4 | 12.3 | 26.1 | |
| 1957 | 38 | 1 534 | 424 | 1 110 | 40.4 | 11.2 | 29.2 | |
| 1958 | 39 | 1 553 | 450 | 1 103 | 39.8 | 11.5 | 28.3 | |
| 1959 | 40 | 1 595 | 421 | 1 174 | 39.9 | 10.5 | 29.4 | |
| 1960 | 42 | 1 714 | 450 | 1 264 | 40.8 | 10.7 | 30.1 | |
| 1961 | 43 | 1 775 | 574 | 1 201 | 41.3 | 13.3 | 27.9 | |
| 1962 | 44 | 1 733 | 504 | 1 229 | 39.4 | 11.5 | 27.9 | |
| 1963 | 45 | 1 855 | 513 | 1 342 | 41.2 | 11.4 | 29.8 | |
| 1964 | 46 | 1 867 | 485 | 1 382 | 40.6 | 10.5 | 30.0 | |
| 1965 | 47 | 1 772 | 563 | 1 209 | 37.7 | 12.0 | 25.7 | |
| 1966 | 47 | 1 895 | 515 | 1 380 | 40.3 | 11.0 | 29.4 | |
| 1967 | 48 | 1 827 | 536 | 1 291 | 38.1 | 11.2 | 26.9 | |
| 1968 | 49 | 1 738 | 538 | 1 200 | 35.5 | 11.0 | 24.5 | |
| 1969 | 51 | 1 715 | 561 | 1 154 | 33.6 | 11.0 | 22.6 | |
| 1970 | 52 | 1 660 | 437 | 1 223 | 31.9 | 8.4 | 23.5 | |
| 1971 | 53 | 1 837 | 464 | 1 373 | 34.7 | 8.8 | 25.9 | |
| 1972 | 55 | 1 723 | 529 | 1 194 | 31.3 | 9.6 | 21.7 | |
| 1973 | 56 | 1 639 | 475 | 1 164 | 29.3 | 8.5 | 20.8 | |
| 1974 | 57 | 1 860 | 497 | 1 363 | 32.6 | 8.7 | 23.9 | |
| 1975 | 59 | 1 806 | 433 | 1 373 | 30.6 | 7.3 | 23.3 | |
| 1976 | 61 | 1 642 | 466 | 1 176 | 26.9 | 7.6 | 19.3 | |
| 1977 | 62 | 1 599 | 477 | 1 122 | 25.8 | 7.7 | 18.1 | |
| 1978 | 62 | 1 796 | 466 | 1 330 | 29.0 | 7.5 | 21.5 | |
| 1979 | 63 | 1 730 | 438 | 1 292 | 27.5 | 7.0 | 20.5 | |
| 1980 | 63 | 1 830 | 444 | 1 386 | 29.0 | 7.0 | 22.0 | |
| 1981 | 64 | 1 802 | 442 | 1 360 | 28.2 | 6.9 | 21.3 | |
| 1982 | 64 | 1 552 | 482 | 1 070 | 24.3 | 7.5 | 16.7 | |
| 1983 | 64 | 1 662 | 452 | 1 210 | 25.8 | 7.0 | 18.8 | |
| 1984 | 65 | 1 739 | 488 | 1 251 | 26.9 | 7.6 | 19.4 | |
| 1985 | 65 | 1 729 | 468 | 1 261 | 26.5 | 7.2 | 19.3 | |
| 1986 | 66 | 1 722 | 498 | 1 224 | 26.2 | 7.6 | 18.6 | |
| 1987 | 66 | 1 684 | 505 | 1 179 | 25.4 | 7.6 | 17.8 | |
| 1988 | 67 | 1 643 | 504 | 1 139 | 24.7 | 7.6 | 17.1 | |
| 1989 | 69 | 1 600 | 563 | 1 037 | 23.2 | 8.2 | 15.0 | |
| 1990 | 70 | 1 617 | 543 | 1 074 | 23.3 | 7.8 | 15.5 | |
| 1991 | 71 | 1 708 | 545 | 1 163 | 24.2 | 7.7 | 16.5 | |
| 1992 | 71 | 1 603 | 522 | 1 081 | 22.7 | 7.4 | 15.3 | |
| 1993 | 72 | 1 689 | 597 | 1 092 | 23.4 | 8.3 | 15.1 | |
| 1994 | 74 | 1 700 | 550 | 1 150 | 23.0 | 7.5 | 15.6 | |
| 1995 | 75 | 1 582 | 525 | 1 057 | 21.0 | 7.0 | 14.0 | |
| 1996 | 76 | 1 611 | 566 | 1 045 | 21.1 | 7.4 | 13.7 | |
| 1997 | 77 | 1 475 | 603 | 872 | 19.1 | 7.8 | 11.3 | |
| 1998 | 79 | 1 412 | 570 | 842 | 17.9 | 7.2 | 10.7 | |
| 1999 | 80 | 1 460 | 560 | 900 | 18.2 | 7.0 | 11.2 | |
| 2000 | 81 | 1 512 | 553 | 959 | 18.6 | 6.8 | 11.8 | |
| 2001 | 81 | 1 440 | 554 | 886 | 17.7 | 6.8 | 10.9 | |
| 2002 | 84 | 1 481 | 647 | 834 | 17.7 | 7.7 | 10.0 | |
| 2003 | 83 | 1 498 | 668 | 830 | 18.1 | 8.1 | 10.0 | |
| 2004 | 83 | 1 435 | 611 | 824 | 17.3 | 7.4 | 9.9 | |
| 2005 | 84 | 1 536 | 673 | 863 | 18.3 | 8.0 | 10.3 | |
| 2006 | 85 | 1 467 | 664 | 803 | 17.3 | 7.8 | 9.4 | |
| 2007 | 86 | 1 499 | 630 | 869 | 17.4 | 7.3 | 10.1 | |
| 2008 | 87 | 1 546 | 662 | 884 | 17.8 | 7.6 | 10.2 | |
| 2009 | 87 | 1 580 | 684 | 896 | 18.1 | 7.8 | 10.3 | 2.38 |
| 2010 | 87 | 1 504 | 664 | 840 | 16.8 | 7.4 | 9.4 | 2.17 |
| 2011 | 88 | 1 625 | 691 | 934 | 18.6 | 7.9 | 10.7 | 2.38 |
| 2012 | 89 | 1 645 | 651 | 994 | 18.6 | 7.4 | 11.3 | 2.42 |
| 2013 | 92 | 1 566 | 717 | 849 | 17.4 | 8.0 | 9.4 | 2.37 |
| 2014 | 92 | 1 557 | 725 | 832 | 17.0 | 7.9 | 9.1 | 2.34 |
| 2015 | 93 | 1 592 | 703 | 889 | 17.0 | 7.5 | 9.5 | |
| 2016 | 93[3] |
Structure of the population [4]
Structure of the population (2013 estimates):
| Age Group | Male | Female | Total | % |
|---|---|---|---|---|
| Total | 44 735 | 45 214 | 89 949 | 100 |
| 0-4 | 3 777 | 3 631 | 7 408 | 8,24 |
| 5-9 | 3 179 | 3 215 | 6 394 | 7,11 |
| 10-14 | 3 131 | 2 952 | 6 083 | 6,76 |
| 15-19 | 3 411 | 3 187 | 6 598 | 7,34 |
| 20-24 | 3 393 | 2 844 | 6 237 | 6,93 |
| 25-29 | 3 609 | 3 473 | 7 082 | 7,87 |
| 30-34 | 3 751 | 3 681 | 7 432 | 8,26 |
| 35-39 | 3 529 | 3 693 | 7 222 | 8,03 |
| 40-44 | 3 656 | 3 536 | 7 192 | 8,00 |
| 45-49 | 3 371 | 3 628 | 6 999 | 7,78 |
| 50-54 | 3 162 | 3 153 | 6 315 | 7,02 |
| 55-59 | 2 473 | 2 351 | 4 824 | 5,36 |
| 60-64 | 1 459 | 1 604 | 3 063 | 3,41 |
| 65-69 | 1 106 | 1 193 | 2 299 | 2,56 |
| 70-74 | 789 | 999 | 1 788 | 1,99 |
| 75-79 | 468 | 890 | 1 358 | 1,51 |
| 80-84 | 286 | 634 | 920 | 1,02 |
| 85-89 | 141 | 349 | 490 | 0,54 |
| 90-94 | 37 | 152 | 189 | 0,21 |
| 95-99 | 6 | 44 | 50 | 0,06 |
| 100+ | 1 | 5 | 6 | 0,01 |
| Age group | Male | Female | Total | Percent |
|---|---|---|---|---|
| 0-14 | 10 087 | 9 798 | 19 885 | 22,11 |
| 15-64 | 31 814 | 31 150 | 62 964 | 70,00 |
| 65+ | 2 834 | 4 266 | 7 100 | 7,89 |
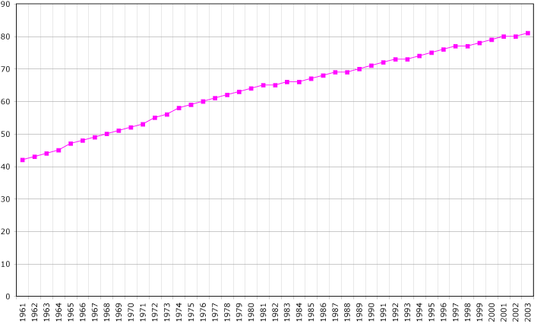
Life expectancy
| Period | Life expectancy in Years[5] |
|---|---|
| 1950–1955 | 57.96 |
| 1955–1960 | |
| 1960–1965 | |
| 1965–1970 | |
| 1970–1975 | |
| 1975–1980 | |
| 1980–1985 | |
| 1985–1990 | |
| 1990–1995 | |
| 1995–2000 | |
| 2000–2005 | |
| 2005–2010 | |
| 2010–2015 |
CIA World Factbook demographic statistics
The following demographic statistics are from the CIA World Factbook, unless otherwise indicated.
Population
81 534 July 2005 est.)
Age structure
0–14 years:
26.4% (male 10,839; female 10,601)
15–64 years:
67.4% (male 26,709; female 28,025)
65 years and over:
6.2% (male 1,622; female 3,392) (2005 est.)
Population growth rate
0.789098% (2005 est.)
Sex ratio
at birth:
1.03 male(s)/female
under 15 years:
1.02 male(s)/female
15-64 years:
0.95 male(s)/female
65 years and over:
0.48 male(s)/female
total population:
0.93 male(s)/female (2005 est.)
Infant mortality rate
15.53 deaths/1,000 live births (2005 est.)
Life expectancy at birth
total population:
69 years
male:
69 years
female:
69 years (2005 est.)
Total fertility rate
1.75 children born/woman (2005 est.)
Nationality
noun:
Seychellois (singular and plural)
adjective:
Seychelles
Ethnic groups
Religions
Roman Catholic (76.2%), Protestant (10.6%) (Anglican (6.1%), Pentecoastal Assembly (1.5%), Seventh-Day Adventist (1.2%), other Protestant (1.6)), other Christian (2.4%), Hindu (2.4%), Islam (1.6%), other non-Christian (1.1%), unspecified (4.8%), none (0.9%) (2010 est.) [6]
Languages
Seychellois Creole (official) 89.1%, English (official) 5.1%, French (official) 0.7%, Other 3.8%, Unspecified 1.4% (2010 est.)[6]
Literacy
definition:
age 15 and over can read and write
total population:
91.9%
male:
91.4%
female:
92.3% (2003 est.)
References
- ↑ United nations. Demographic Yearbooks
- ↑ "MISD: Statistics & Database Administration Section". www.misd.gov.sc.
- ↑ "The World Factbook — Central Intelligence Agency". www.cia.gov.
- ↑ "United Nations Statistics Division - Demographic and Social Statistics". unstats.un.org.
- ↑ "World Population Prospects - Population Division - United Nations". esa.un.org. Retrieved 2018-08-26.
- 1 2 3 "Africa :: MAURITIUS". CIA The World Factbook.