Demographics of South Africa
| Demographics of South Africa | |
|---|---|
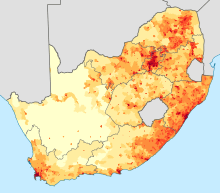
 Population of South Africa, 1961–2008 | |
| Population | 57,725,600 (July 2018 estimate)[1] |
| Density | 45.78/km2 |
| Growth rate | 1.55%[1] |
| Birth rate | 20.8 births/1,000 population (2018 est.) |
| Death rate | 9.1 deaths/1,000 population (2018 est.) |
| Life expectancy | 64 years (2018 est.) |
| • male | 61 years (2018 est.) |
| • female | 67 years (2018 est.) |
| Fertility rate | 2.4 children born/woman (2013 est.) |
| Infant mortality rate | 36.4 deaths/1,000 (2018 est.) |
| Age structure | |
| 0–14 years | 28.9% (male 7,093,328/female 7,061,579) |
| 15–64 years | 65.8% (male 16,275,424/female 15,984,181) |
| 65 and over | 5.4% (male 1,075,117/female 1,562,860) (2010 est.) |
| Sex ratio | |
| Total | 0.99 male(s)/female (2010 est.) |
| At birth | 1.02 male(s)/female |
| Under 15 | 1 male(s)/female |
| 15–64 years | 1.02 male(s)/female |
| 65 and over | 0.68 male(s)/female |
| Nationality | |
| Nationality | South African |
| Language | |
| Official | See Languages of South Africa |
The demographics of South Africa encompasses about 57.7 million people of diverse origins, cultures, languages, and religions.[1] The last census was held in 2011 and the next will be in 2021.[2]
In 2011, Statistics South Africa counted 2.1 million foreigners in total.[3] However, numerous reports suggest that that is a vast underestimation. The real figure may in fact be as high as five million,[4] including some three million Zimbabweans.[5]
Population
Historical population
| Historical population | ||
|---|---|---|
| Year | Pop. | ±% p.a. |
| 1 | 100,000 | — |
| 1000 | 300,000 | +0.11% |
| 1500 | 600,000 | +0.14% |
| 1600 | 700,000 | +0.15% |
| 1700 | 1,000,000 | +0.36% |
| 1820 | 1,550,000 | +0.37% |
| 1870 | 2,547,000 | +1.00% |
| 1904 | 5,175,463 | +2.11% |
| 1911 | 5,972,757 | +2.07% |
| 1913 | 6,153,000 | +1.50% |
| 1921 | 6,927,403 | +1.49% |
| 1936 | 9,587,863 | +2.19% |
| 1946 | 11,415,925 | +1.76% |
| 1950 | 13,683,162 | +4.63% |
| 1955 | 15,384,557 | +2.37% |
| 1960 | 17,396,367 | +2.49% |
| 1970 | 22,502,502 | +2.61% |
| 1980 | 29,077,143 | +2.60% |
| 1990 | 36,793,490 | +2.38% |
| 1995 | 41,426,810 | +2.40% |
| 2001 | 44,819,777 | +1.32% |
| 2007 | 48,502,063 | +1.32% |
| 2011 | 51,770,560 | +1.64% |
| 2016 | 55,653,654 | +1.46% |
| Note: Population estimates (1 AD - 1870 AD) are deduced from quantitative macroeconomic historical calculations. 1 (est.), 1000 (est.), 1500 (est.), 1600 (est.), 1700 (est.), 1820 (est.), 1870 (est.), 1913,[6] 1904[7] 1904-1946,[8][9][10] 1950-2010,[11] 2001, 2011, 2015[12] | ||
UN population projections: 2010 to 2050
| Population projections | ||
|---|---|---|
| Year | Pop. | ±% |
| 2015 | 54,957,000 | — |
| 2020 | 57,296,000 | +4.3% |
| 2025 | 59,702,000 | +4.2% |
| 2030 | 61,836,000 | +3.6% |
| 2035 | 63,670,000 | +3.0% |
| 2040 | 65,413,000 | +2.7% |
| 2045 | 67,075,000 | +2.5% |
| 2050 | 68,642,000 | +2.3% |
| Source: United Nations Secretariat[13] | ||
Age and population estimates: 1950 to 2015
According to the 2010 revision of the United Nations Secretariat's World Population Prospects, South Africa's total population was 50,133,000 in 2010, compared to only 13,683,000 in 1950. In 2010, 30.1% of the people were children under the age of 15, 65.2% were between 15 and 64 years of age, and 4.6% were 65 or older.[14] All population estimates are rounded to the nearest thousand.
| Year | Total population | Percentage under 15 years old |
Percentage 15 to 64 years old |
Percentage at least 65 years old |
|---|---|---|---|---|
| 1950 | 13,683,000 | 38.6 | 57.8 | 3.6 |
| 1955 | 15,385,000 | 39.9 | 56.4 | 3.8 |
| 1960 | 17,396,000 | 40.9 | 55.2 | 3.9 |
| 1965 | 19,814,000 | 41.9 | 54.2 | 3.9 |
| 1970 | 22,502,000 | 42.1 | 54.5 | 3.4 |
| 1975 | 25,699,000 | 41.9 | 54.9 | 3.2 |
| 1980 | 29,077,000 | 41.5 | 55.3 | 3.1 |
| 1985 | 32,983,000 | 40.5 | 56.4 | 3.1 |
| 1990 | 36,794,000 | 38.9 | 57.9 | 3.2 |
| 1995 | 41,402,000 | 36.0 | 60.6 | 3.4 |
| 2000 | 44,760,000 | 33.7 | 62.6 | 3.7 |
| 2005 | 47,793,000 | 31.7 | 64.2 | 4.1 |
| 2010 | 50,133,000 | 30.1 | 65.2 | 4.6 |
| 2015 | 54,490,000 | 29.2 | 63.0 | 7.7 |
Historical censuses
1904 Census
South African Population Figures for the 1904 Census. Source:[7]
| Colony | Cape Colony | Natal | Transvaal | Orange River Colony |
Total | Percent |
|---|---|---|---|---|---|---|
| Black | 1,424,787 | 904,041 | 937,127 | 225,101 | 3,491,056 | 67.5% |
| White | 579,741 | 97,109 | 297,277 | 142,690 | 1,116,805 | 21.6% |
| Coloured | 395,034 | 6,686 | 24,226 | 19,282 | 445,228 | 8.6% |
| Indian | 10,242 | 100,918 | 11,321 | 253 | 122,734 | 2.4% |
| Total | 2,409,804 | 1,108,754 | 1,269,951 | 387,315 | 5,175,463 | 100.0% |
| % of S. Africa | 46.6% | 21.4% | 24.5% | 7.5% | 100% |
1960 Census
Sources: Statesman's Year-Book 1967–1968;[15] Europa Year Book 1969[16]
| Province | Cape of Good Hope |
Natal | Transvaal | Orange Free State |
Total | Percent |
|---|---|---|---|---|---|---|
| Black Africans | 3,011,080 | 2,199,920 | 4,633,378 | 1,083,886 | 10,928,264 | 68.3% |
| White | 1,003,207 | 340,235 | 1,468,305 | 276,745 | 3,088,492 | 19.3% |
| Coloured | 1,330,089 | 45,253 | 108,007 | 25,909 | 1,509,258 | 9.4% |
| Indian | 18,477 | 394,854 | 63,787 | 7 | 477,125 | 3.0% |
| Total | 5,362,853 | 2,980,262 | 6,273,477 | 1,386,547 | 16,003,139 | 100.0% |
| % of S. Africa | 33.5% | 18.6% | 39.2% | 8.7% | 100.0% |
Fertility rate (The Demographic Health Survey)
Fertility rate (TFR) (Wanted Fertility Rate) and CBR (Crude Birth Rate):[17]
| Year | CBR (Total) | TFR (Total) | CBR (Urban) | TFR (Urban) | CBR (Rural) | TFR (Rural) |
|---|---|---|---|---|---|---|
| 1998 | 21,90 | 2,90 (2,3) | 19,2 | 2,25 (1,8) | 25,4 | 3,92 (2,9) |
| 2003 | 17,5 | 2,1 (1,6) | 18,4 | 2,1 (1,6) | 16,1 | 2,2 (1,6) |
Life expectancy
Life expectancy from 1950 to 2015 (UN World Population Prospects)[18]:
| Period | Life expectancy (years) |
|---|---|
| 1950–1955 | 48.5 |
| 1955–1960 | |
| 1960–1965 | |
| 1965–1970 | |
| 1970–1975 | |
| 1975–1980 | |
| 1980–1985 | |
| 1985–1990 | |
| 1990–1995 | |
| 1995–2000 | |
| 2000–2005 | |
| 2005–2010 | |
| 2010–2015 |
Vital statistics
Registration of vital events in South Africa has improved considerably during the past decade, but still not considered to be complete for black South Africans. The Population Department of the United Nations prepared the following estimates.[14] (Natural increase or decrease over a time period is the difference between that period's live births and deaths, before accounting for inward or outward migration.)
United Nations estimates, 2010
| Period | Live births per year | Deaths per year | Natural Increase per year | Crude Birth Rate (per 1,000 per year) |
Crude Death Rate (per 1,000 per year) |
Natural Increase (per 1,000 per year) |
Total Fertility Rate (over av'ge woman's life) | Infant Mortality Rate (per 100,000 live births) |
|---|---|---|---|---|---|---|---|---|
| 1950–1955 | 629 000 | 295 000 | + 334 000 | 43.3 | 20.3 | + 23.0 | 6.50 | 96 |
| 1955–1960 | 697 000 | 297 000 | + 400 000 | 42.5 | 18.1 | + 24.4 | 6.50 | 91 |
| 1960–1965 | 774 000 | 310 000 | + 464 000 | 41.6 | 16.7 | + 25.0 | 6.30 | 87 |
| 1965–1970 | 808 000 | 312 000 | + 496 000 | 38.2 | 14.7 | + 23.5 | 5.70 | 84 |
| 1970–1975 | 909 000 | 317 000 | + 592 000 | 37.7 | 13.1 | + 24.6 | 5.47 | 77 |
| 1975–1980 | 980 000 | 319 000 | + 661 000 | 35.8 | 11.7 | + 24.1 | 5.00 | 71 |
| 1980–1985 | 1 052 000 | 307 000 | + 745 000 | 33.9 | 9.9 | + 24.0 | 4.56 | 61 |
| 1985–1990 | 1 086 000 | 299 000 | + 787 000 | 31.1 | 8.6 | + 22.5 | 4.00 | 53 |
| 1990–1995 | 1 073 000 | 332 000 | + 742 000 | 27.5 | 8.5 | + 19.0 | 3.34 | 51 |
| 1995–2000 | 1 082 000 | 450 000 | + 632 000 | 25.1 | 10.4 | + 14.7 | 2.95 | 56 |
| 2000–2005 | 1 111 000 | 645 000 | + 466 000 | 24.0 | 13.9 | + 10.1 | 2.80 | 59 |
| 2005–2010 | 1 074 000 | 746 000 | + 328 000 | 21.9 | 15.2 | + 6.7 | 2.55 | 55 |
| 2010–2015 | 21.0 | 12.5 | + 8.5 | 2.40 | 55 | |||
| Total Fertility Rate = average number of children over a woman's lifetime; Infant Mortality Rate per 100,000 live births | ||||||||
| Year | Live births | Deaths | Natural increase | Crude birth rate (per 1,000) |
Crude death rate (per 1,000) |
Natural increase (per 1,000) |
Fertility rates (per woman) |
Average population |
|---|---|---|---|---|---|---|---|---|
| 2002 | 1 118 916 | 608 480 | 510 436 | 24,5 | 13,3 | 11,2 | 2,79 | |
| 2003 | 1 127 380 | 643 285 | 484 095 | 24,4 | 13,9 | 10,5 | 2,77 | |
| 2004 | 1 134 751 | 671 101 | 463 650 | 24,3 | 14,4 | 9,9 | 2,75 | |
| 2005 | 1 141 351 | 682 059 | 459 292 | 24,1 | 14,4 | 9,7 | 2,73 | |
| 2006 | 1 150 015 | 625 210 | 524 805 | 24,0 | 13,0 | 11,0 | 2,71 | |
| 2007 | 1 162 056 | 564 663 | 597 393 | 23,9 | 11,6 | 12,3 | 2,70 | |
| 2008 | 1 175 212 | 542 038 | 633 174 | 23,8 | 11,0 | 12,8 | 2,68 | |
| 2009 | 1 188 662 | 528 342 | 660 320 | 23,7 | 10,5 | 13,2 | 2,66 | |
| 2010 | 1 201 175 | 535 396 | 665 779 | 23,6 | 10,5 | 13,1 | 2,64 | |
| 2011 | 1 211 011 | 556 087 | 654 924 | 23,4 | 10,7 | 12,7 | 2,61 | |
| 2012 | 1 222 324 | 555 921 | 666 403 | 23,2 | 10,6 | 12,6 | 2,60 | |
| 2013 | 1 232 668 | 539 880 | 692 788 | 23,1 | 10,1 | 13,0 | 2,58 | 52 982 000 |
| 2014 | 1 242 070 | 516 929 | 725 141 | 22,9 | 9,5 | 13,4 | 2,57 | |
| 2015 | 1 250 782 | 531 965 | 718 817 | 22,7 | 9,6 | 13,1 | 2,55 | 54 956 900 |
Age and sex distribution
South African National Census of 2011

| Age group | Male | Female percent | Female | Total | percent of S.A. |
|---|---|---|---|---|---|
| under 5 | 2,867,585 | 49.6% | 2,817,867 | 5,685,452 | 11.0% |
| 5–9 | 2,425,181 | 49.7% | 2,394,570 | 4,819,751 | 9.3% |
| 10–14 | 2,344,275 | 49.0% | 2,250,611 | 4,594,886 | 8.9% |
| 15–19 | 2,498,572 | 50.1% | 2,504,905 | 5,003,477 | 9.7% |
| 20–24 | 2,694,646 | 49.9% | 2,679,896 | 5,374,542 | 10.4% |
| 25–29 | 2,542,682 | 49.7% | 2,516,635 | 5,059,317 | 9.8% |
| 30–34 | 2,036,206 | 49.5% | 1,992,804 | 4,029,010 | 7.8% |
| 35–39 | 1,709,347 | 50.7% | 1,758,420 | 3,467,767 | 6.7% |
| 40–44 | 1,402,328 | 52.4% | 1,546,291 | 2,948,619 | 5.7% |
| 45–49 | 1,195,740 | 54.4% | 1,424,543 | 2,620,283 | 5.1% |
| 50–54 | 1,011,349 | 54.4% | 1,206,940 | 2,218,289 | 4.3% |
| 55–59 | 811,950 | 54.8% | 985,458 | 1,797,408 | 3.5% |
| 60–64 | 612,364 | 55.8% | 773,404 | 1,385,768 | 2.7% |
| 65–69 | 401,548 | 58.1% | 556,256 | 957,804 | 1.9% |
| 70–74 | 293,498 | 60.8% | 454,832 | 748,330 | 1.4% |
| 75–79 | 165,283 | 65.7% | 315,984 | 481,267 | 0.9% |
| 80–84 | 100,694 | 68.8% | 222,222 | 322,916 | 0.6% |
| 85-plus | 75,543 | 70.5% | 180,130 | 255,673 | 0.5% |
| TOTAL | 25,188,791 | 51.3% | 26,581,769 | 51,770,560 | 100% |
| Number of children 0–14 | Number of women 15–49 | Proportion | Fertility Rate |
|---|---|---|---|
| 15,812,264 | 13,866,489 | 1.14 | 2.35 |
| Age group | Population | Male | Female | Percent |
|---|---|---|---|---|
| 0–14 | 15,812,268 | 7,969,880 | 7,842,388 | 31.26 |
| 15–64 | 32,235,534 | 15,538,934 | 16,696,600 | 63.72 |
| 65+ | 2,538,955 | 1,006,222 | 1,532,733 | 5.02 |
Age and race distribution
South African National Census of 2011
Age distribution within each racial group
By generation
| Age group | All races | % of All | Black African | % of Blacks | Coloured | % of Col'd | White | % of Whites | Indian or other Asian | % of Asians | Others | % of others |
| 0–14 | 15,100,089 | 29.2% | 12,702,324 | 31.0% | 1,311,811 | 28.4% | 771,187 | 16.8% | 258,602 | 20.1% | 56,164 | 20.0% |
| 15–64 | 33,904,479 | 65.5% | 26,502,329 | 64.6% | 3,085,684 | 66.9% | 3,165,965 | 68.9% | 939,379 | 73.0% | 211,126 | 75.3% |
| 65-plus | 2,765,992 | 5.3% | 1,796,285 | 4.4% | 217,906 | 4.7% | 649,686 | 14.2% | 88,949 | 6.9% | 13,164 | 4.7% |
| All ages | 51,770,560 | 100% | 41,000,938 | (100%) | 4,615,401 | (100%) | 4,586,838 | (100%) | 1,286,930 | (100%) | 280,454 | (100%) |
| % of SA | 100% | 79.20% | 8.92% | 8.86% | 2.49% | 0.54% |
Racial composition of each age group in 2015 (estimates)
| Age group | All races | % of All | Black African | % of Blacks | Coloured | % of Col'd | White | % of Whites | Indian or other Asian | % of Asians |
| 0–14 | 16,612,043 | 30.23% | 14,244,663 | 32.21% | 1,288,601 | 26.66% | 789,492 | 17.41% | 289,285 | 21.24% |
| 15–64 | 35,465,499 | 64.53% | 28,170,797 | 63.69% | 3,299,771 | 68.28% | 3,026,475 | 66.75% | 968,649 | 71.12% |
| 65-plus | 2,879,378 | 5.24% | 1,812,535 | 4.10% | 244,544 | 5.06% | 718,041 | 15.84% | 104.068 | 7.64% |
| All ages | 54,956,920 | 100% | 44,227,995 | (100%) | 4,832,916 | (100%) | 4,534,008 | (100%) | 1,362,002 | (100%) |
| % of SA | 100% | 80.48% | 8.79% | 8.25% | 2.48% |
| Age group | All races | % of All | Black African | % of Blacks | Coloured | % of Col'd | White | % of Whites | Indian or Asian | % of Asians |
| under 5 | 5,936,350 | 10.80% | 5,156,508 | 11.66% | 426,156 | 8.82% | 254,978 | 5.62% | 98,708 | 7.25% |
| 5 to 9 | 5,537,225 | 10.08% | 4,746,115 | 10.73% | 430,666 | 8.91% | 263,378 | 5.81% | 97,065 | 7.13% |
| 10 to 14 | 5,138,468 | 9.35% | 4,342,040 | 9.82% | 431,779 | 8.93% | 271,136 | 5.98% | 93,512 | 6.87% |
| 15 to 19 | 5,124,373 | 9.32% | 4,292,220 | 9.70% | 437,412 | 9.05% | 295,733 | 6.52% | 99,007 | 7.27% |
| 20 to 24 | 5,302,246 | 9.65% | 4,461,515 | 10.09% | 426,013 | 8.81% | 306,415 | 6.76% | 108,304 | 7.95% |
| 25 to 29 | 5,232,254 | 9.52% | 4,437,570 | 10.03% | 389,429 | 8.06% | 287,485 | 6.34% | 117,771 | 8.65% |
| 30 to 34 | 4,307,693 | 7.84% | 3,535,173 | 7.99% | 366,955 | 7.59% | 281,358 | 6.21% | 124,206 | 9.12% |
| 35 to 39 | 3,774,921 | 6.87% | 3,001,989 | 6.79% | 376,488 | 7.79% | 279,439 | 6.16% | 117,005 | 8.59% |
| 40 to 44 | 3,204,952 | 5.83% | 2,444,972 | 5.53% | 368,886 | 7.63% | 288,370 | 6.36% | 102,725 | 7.54% |
| 45 to 49 | 2,738,580 | 4.98% | 2,004,009 | 4.53% | 307,363 | 6.36% | 335,434 | 7.40% | 91,774 | 6.74% |
| 50 to 54 | 2,297,586 | 4.18% | 1,619,249 | 3.66% | 264,593 | 5.47% | 332,977 | 7.34% | 80,767 | 5.93% |
| 55 to 59 | 1,942,942 | 3.54% | 1,334,800 | 3.02% | 209,933 | 4.34% | 328,999 | 7.26% | 69,210 | 5.08% |
| 60 to 64 | 1,539,953 | 2.80% | 1,039,301 | 2.35% | 152,698 | 3.16% | 290,075 | 6.40% | 57,879 | 4.25% |
| 65 to 69 | 1,153,159 | 2.10% | 737,581 | 1.67% | 105,403 | 2.18% | 265,818 | 5.86% | 44,357 | 3.26% |
| 70 to 74 | 805,114 | 1.46% | 511,723 | 1.16% | 65,465 | 1.35% | 198,876 | 4.39% | 28,949 | 2.13 |
| 75 to 79 | 502,005 | 0.91% | 313,800 | 0.71% | 41,978 | 0.87% | 128,675 | 2.84% | 17,552 | 1.29% |
| 80-plus | 419,100 | 0.76% | 249,431 | 0.56% | 31,698 | 0.66% | 124,672 | 2.75% | 13,210 | 0.97% |
| All ages | 54,956,920 | 100% | 44,227,995 | (100%) | 4,832,916 | (100%) | 4,534,008 | (100%) | 1,362,002 | (100%) |
| % of SA | 100% | 80.48% | 8.79% | 8.25% | 2.48% |
| Age group | All races | Black African | % of age grp | Coloured | % of age grp | White | % of age grp | Indian or Asian | % of age grp |
| under 5 | 5,936,350 | 5,156,508 | 86.86% | 426,156 | 7.18% | 254,978 | 4.30% | 98,708 | 1.66% |
| 5 to 9 | 5,537,225 | 4,746,115 | 85.71% | 430,666 | 7.78% | 263,378 | 4.76% | 97,065 | 1.75% |
| 10 to 14 | 5,138,468 | 4,342,040 | 84.50% | 431,779 | 8.40% | 271,136 | 5.28% | 93,512 | 1.82% |
| 15 to 19 | 5,124,373 | 4,292,220 | 83.76% | 437,412 | 8.54% | 295,733 | 5.77% | 99,007 | 1.93% |
| 20 to 24 | 5,302,246 | 4,461,515 | 84.14% | 426,013 | 8.03% | 306,415 | 5.78% | 108,304 | 2.04% |
| 25 to 29 | 5,232,254 | 4,437,570 | 84.81% | 389,429 | 7.44% | 287,485 | 5.49% | 117,771 | 2.25% |
| 30 to 34 | 4,307,693 | 3,535,173 | 82.07% | 366,955 | 8.52% | 281,358 | 6.53% | 124,206 | 2.88% |
| 35 to 39 | 3,774,921 | 3,001,989 | 79.52% | 376,488 | 9.97% | 279,439 | 7.40% | 117,005 | 3.10% |
| 40 to 44 | 3,204,952 | 2,444,972 | 76.29% | 368,886 | 11.51% | 288,370 | 9.00% | 102,725 | 3.21% |
| 45 to 49 | 2,738,580 | 2,004,009 | 73.18% | 307,363 | 11.22% | 335,434 | 12.25% | 91,774 | 3.35% |
| 50 to 54 | 2,297,586 | 1,619,249 | 70.48% | 264,593 | 11.52% | 332,977 | 14.49% | 80,767 | 3.52% |
| 55 to 59 | 1,942,942 | 1,334,800 | 68.70% | 209,933 | 10.80% | 328,999 | 16.93% | 69,210 | 3.56% |
| 60 to 64 | 1,539,953 | 1,039,301 | 67.49% | 152,698 | 9.92% | 290,075 | 18.84% | 57,879 | 3.76% |
| 65 to 69 | 1,153,159 | 737,581 | 63.96% | 105,403 | 9.14% | 265,818 | 23.05% | 44,357 | 3.85% |
| 70 to 74 | 805,114 | 511,723 | 63.56% | 65,465 | 8.13% | 198,876 | 24.70% | 28,949 | 3.60% |
| 75 to 79 | 502,005 | 313,800 | 62.51% | 41,978 | 8.36% | 128,675 | 25.63% | 17,552 | 3.50% |
| 80-plus | 419,100 | 249,431 | 59.52% | 31,698 | 7.56% | 124,672 | 29.75% | 13,210 | 3.15% |
| All ages | 54,956,920 | 44,227,995 | 4,832,916 | 4,534,008 | 1,362,002 | ||||
| % of SA | 80.48% | 8.79% | 8.25% | 2.48% |
Ethnic groups
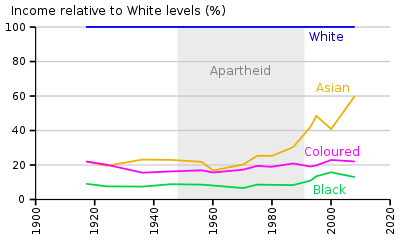

Statistics South Africa asks people to describe themselves in the census in terms of five racial population groups.[19] The 2011 census figures for these groups were Black African at 80.2%, White at 8.4%, Coloured at 8.8%, Indian /Asian at 2.5%, and Other/Unspecified at 0.5%.[20]
The white percentage of the population has sharply declined. The first census in South Africa in 1911 showed that whites made up 22% of the population. This declined to 16% in 1980,[21] and 8.9% in 2011.[22]:21
Languages
South Africa has eleven official languages:[23] IsiZulu[20] 22.7%, IsiXhosa[20] 16%, Afrikaans[20] 13.5%, the English language [20] 9.6%, Sepedi [20] 9.1%, Setswana[20] 8%, Sesotho[20] 7.6%, Xitsonga[20] 4.5%, siSwati[20] 2.5%, Tshivenda[20] 2.4% and isiNdebele[20] 2.1%.
In this regard it is third only to Bolivia and India in number. While all the languages are formally equal, some languages are spoken more than others. According to the 2011 census, the three most spoken first languages are Zulu (22.7%), Xhosa (16.0%), and Afrikaans (13.5%).[22]:23–25 Despite the fact that English is recognised as the language of commerce and science, it ranked fourth, and was spoken by only 9.6% of South Africans as a first language in 2011.[22]:23–25
The country also recognises several unofficial languages, including Fanagalo, Khoe, Lobedu, Nama, Northern Ndebele, Phuthi, San and South African Sign Language.[24] These unofficial languages may be used in certain official uses in limited areas where it has been determined that these languages are prevalent. Nevertheless, their populations are not such that they require nationwide recognition.
Many of the "unofficial languages" of the San and Khoikhoi people contain regional dialects stretching northwards into Namibia and Botswana, and elsewhere. These people, who are a physically distinct population from other Africans, have their own cultural identity based on their hunter-gatherer societies. They have been marginalised to a great extent, and many of their languages are in danger of becoming extinct.
Many white South Africans also speak other European languages, such as Portuguese (also spoken by black Angolans and Mozambicans), German, and Greek, while some Indians and other Asians in South Africa speak South Asian languages, such as Tamil, Hindi, Gujarati, Urdu and Telugu. Although many South Africans are of Huguenot (French) origin, South African French is spoken by fewer than 10,000 individuals country-wide. Congolese French is also spoken in South Africa by migrants.
The primary sign language of Deaf South Africans is South African Sign Language. Other sign languages among indigenous peoples are also used.
By ethnicity
In 2011, the first language was Zulu for 28.1% of Black residents, Xhosa for 19.8%, Northern Sotho for 11.2%, Tswana for 9.7%, Sesotho for 9.3%, Tsonga for 5.5%, Swati for 3.1%, Venda for 2.9%, English for 2.8%, Southern Ndebele for 2.6%, Afrikaans for 1.5%, while 3.4% had another first language.[25]
Among whites, Afrikaans was the first language for 59.1% of the population, compared to 35.0% for English. Other languages accounted for the remaining 5.9%.[25]
Religion
According to the 2001 national census, Christians accounted for 79.7% of the population. This includes Protestant (36.6%), Zionist Christian (11.1%), Pentecostal/Charismatic (8.2%), Roman Catholic (7.1%), Methodist (6.8%), Dutch Reformed (6.7%), Anglican (3.8%); members of other Christian churches accounted for another 36% of the population. Muslims accounted for 1.5% of the population, Other 2.3%, and 1.4% were Unspecified and None 15.1%.[20]
African Indigenous Churches made up the largest of the Christian groups. Some believe that many people claiming no affiliation with any organised religion adhered to traditional indigenous religions. Many people have syncretic religious practices combining Christian and indigenous influences.[26]
Muslims are largely found among the Coloured and Indian ethnic groups. They have been joined by black or white South African converts as well as immigrants from other parts of Africa.[27] South African Muslims claim that their faith is the fastest-growing religion of conversion in the country, with the number of black Muslims growing sixfold, from 12 000 in 1991 to 74 700 in 2004[27][28]
The Hindu population has its roots in the British colonial period, but later waves of immigration from India have also contributed to it. Most Hindus are of South Asian origin, but there are many who come from mixed racial stock. Some are converts due to the efforts of Hindu missionaries such as ISKCON.
Other minority religions in South Africa are Sikhism, Jainism and Bahá'í Faith.[29]
By ethnicity
87.9% of Black residents are Christian, 9.5% have no religion, 0.2% are Muslim, 0.0% are Jewish, 0.0% are Hindu and 2.3% have other or undetermined beliefs.
71.8% of White residents are Christian, 23.8% have no religion, 0.2% are Muslim, 1.4% are Jewish, and 0.0% are Hindu. 2.7% have other or undetermined beliefs.
Immigration

South Africa hosts a sizeable refugee and asylum seeker population. According to the World Refugee Survey 2008, published by the U.S. Committee for Refugees and Immigrants, this population numbered approximately 144,700 in 2007.[30] Groups of refugees and asylum seekers numbering over 10,000 included people from Zimbabwe (48,400), the Democratic Republic of the Congo (24,800), and Somalia (12,900).[30] These populations mainly lived in Johannesburg, Pretoria, Durban, Cape Town, and Port Elizabeth.[30] Many refugees have now also started to work and live in rural areas in provinces such as Mpumalanga and KwaZulu-Natal.
Statistics SA assumes in some of their calculations that there are fewer than 2 million immigrants in South Africa.[31] Other institutions, like the police and Médecins Sans Frontières place estimate the figure at 4 million.[32][33][34][35][36]
Immigration figures
Immigration assumptions by Statistics South Africa to South Africa based on race. Negative numbers represent net migration from South Africa to other countries.[37]
| Year | African | Asian | White |
|---|---|---|---|
| 1985-2000 | 1 135 275 | 14 476 | -304 112 |
| 2001-2005 | 769 038 | 23 335 | -133 782 |
| 2006-2010 | 922 885 | 34 688 | -112 046 |
| 2011-2015 | 1 067 936 | 40 929 | -95 158 |
Urbanization
"Urban areas contain about two-thirds of the population; many of these consist of huge informal or squatter settlements."[38]
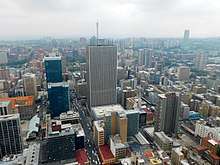
Largest municipalities
| Rank | Name | Province | Pop. | ||||||
|---|---|---|---|---|---|---|---|---|---|
 City of Johannesburg 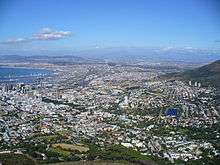 City of Cape Town |
1 | City of Johannesburg | Gauteng | 4,949,347 | 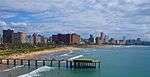 EThekwini Metropolitan Municipality 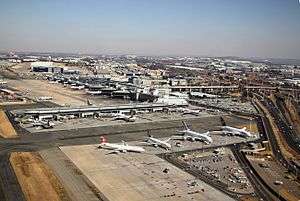 Ekurhuleni | ||||
| 2 | City of Cape Town | Western Cape | 4,004,793 | ||||||
| 3 | EThekwini Metropolitan Municipality | KwaZulu-Natal | 3,661,911 | ||||||
| 4 | Ekurhuleni | Gauteng | 3,379,104 | ||||||
| 5 | City of Tshwane | Gauteng | 3,275,152 | ||||||
| 6 | Nelson Mandela Bay | Eastern Cape | 1,263,051 | ||||||
| 7 | Buffalo City Metropolitan Municipality | Eastern Cape | 810,528 | ||||||
| 8 | Mangaung | Free State | 759,693 | ||||||
| 9 | Emfuleni | Gauteng | 733,445 | ||||||
| 10 | Polokwane Local Municipality | Limpopo | 702,190 | ||||||
Graphs and maps
 Population pyramid by population group, 2011
 Black population
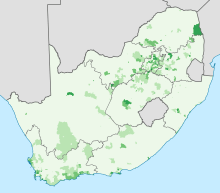 White population
 Coloured population
See also
References
- 1 2 3 "Mid - year population estimates" (PDF). Stats SA. Statistics South Africa. 23 July 2018. Archived (PDF) from the original on 23 July 2018. Retrieved 23 July 2018.
- ↑ "Census 2021 New Methodologies Test". Statistics South Africa (Stats SA). 20 July 2018. Archived from the original on 4 August 2018.
- ↑ "Table 3.5, Statistical release (Revised) P0301.4, Census 2011" (PDF). Statssa.gov.za. Archived from the original (PDF) on 13 November 2015. Retrieved 25 July 2016.
- ↑ "Nowhere left to go". Economist.com. 20 May 2008. Retrieved 29 August 2017 – via The Economist.
- ↑ "Escape From Mugabe: Zimbabwe's Exodus". Archived from the original on 24 January 2016.
- ↑ Angus Maddison (2010). "Statistics on World Population, GDP and Per Capita GDP, 1-2008 AD". University of Groningen. Retrieved 1 March 2016.
- 1 2 Smuts I: The Sanguine Years 1870–1919, W.K. Hancock, Cambridge University Press, 1962, pg 219
- ↑ The Statesman's Year-Book 1977–1978 (ed. John Paxton), St. Martin's Press, New York (& Macmillan, London), 1977, page 1296
- ↑ "City of Cape Town / Isixeko Sasekapa, Stad Kaapstad: Metropolitan Municipality & Main Places – Statistics & Maps on City Population". Citypopulation.de. Retrieved 29 August 2017.
- ↑ "South Africa: Provinces and Major Urban Areas - Population Statistics in Maps and Charts". Citypopulation.de. Retrieved 29 August 2017.
- ↑ Population Division of the Department of Economic and Social Affairs of the United Nations Secretariat (2015). "Total Population - Both Sexes (XLS, 3.74 MB) - 2015 revision". United Nations. Retrieved 1 March 2016.
- ↑ "Mid-year population estimates" (PDF). Statistics South Africa. 23 July 2015. Retrieved 1 March 2016.
- ↑ "World Population Prospects: The 2012 Revision". UN. Retrieved 28 July 2014.
- 1 2 Population Division of the Department of Economic and Social Affairs of the United Nations Secretariat, World Population Prospects: The 2010 Revision Archived 6 May 2011 at the Wayback Machine.
- ↑ The Statesman's Year-Book, 1967–1968 (104th annual edition), edited by S.H. Steinberg, Macmillan, London; St. Martin's Press, New York, 1967, pages 1405–1424
- ↑ The Europa Year Book 1969, Volume II: Africa, The Americas, Asia, Australasia, Europa Publications, London, 1969, page 1286
- ↑ "The DHS Program - Quality information to plan, monitor and improve population, health, and nutrition programs". Dhsprogram.com. Retrieved 29 August 2017.
- ↑ "World Population Prospects – Population Division – United Nations". Retrieved 2017-07-15.
- ↑ Lehohla, Pali (5 May 2005). "Debate over race and censuses not peculiar to SA". Business Report. Archived from the original on 14 August 2007. Retrieved 25 August 2013.
Others pointed out that the repeal of the Population Registration Act in 1991 removed any legal basis for specifying 'race'. The Identification Act of 1997 makes no mention of race. On the other hand, the Employment Equity Act speaks of 'designated groups' being 'black people, women and people with disabilities'. The Act defines 'black' as referring to 'Africans, coloureds and Indians'. Apartheid and the racial identification which underpinned it explicitly linked race with differential access to resources and power. If the post-apartheid order was committed to remedying this, race would have to be included in surveys and censuses, so that progress in eradicating the consequences of apartheid could be measured and monitored. This was the reasoning that led to a 'self-identifying' question about 'race' or 'population group' in both the 1996 and 2001 population censuses, and in Statistics SA's household survey programme.
- 1 2 3 4 5 6 7 8 9 10 11 12 13 "Africa :: SOUTH AFRICA". CIA The World Factbook.
- ↑ Study Commission on U.S. Policy toward Southern Africa (U.S.) (1981). South Africa: time running out : the report of the Study Commission on U.S. Policy Toward Southern Africa. University of California Press. p. 42. ISBN 0-520-04547-5.
- 1 2 3 Census 2011: Census in brief (PDF). Pretoria: Statistics South Africa. 2012. ISBN 9780621413885.
- ↑ "Constitution of South Africa, Chapter 1, Section 6". Fs.gov.za. Archived from the original on 29 July 2009. Retrieved 30 May 2010.
- ↑ "The languages of South Africa". Media Club South Africa. Brand South Africa. December 2011. Retrieved 24 November 2017.
- 1 2 "Community profiles > Census 2011". Statistics South Africa Superweb. Archived from the original on 30 September 2013. Retrieved 21 August 2013.
- ↑ "South Africa". State.gov. Retrieved 29 August 2017.
- 1 2 "In South Africa, many blacks convert to Islam". Csmonitor.com. Retrieved 29 August 2017.
- ↑ "Muslims say their faith growing fast in Africa". Religionnewsblog.com. Retrieved 7 November 2010.
- ↑ "South Africa – Section I. Religious Demography". U.S. Department of State. Retrieved 15 July 2006.
- 1 2 3 "World Refugee Survey 2008". U.S. Committee for Refugees and Immigrants. 19 June 2008. Archived from the original on 5 October 2007.
- ↑ "P03022009_6". Statssa.gov.za. Archived from the original on 5 August 2012. Retrieved 5 January 2014.
- ↑ So where are Zimbabweans going?, BBC News. 8 November 2005.
- ↑ SA population may be much larger than previously thought Beeld 1 June 2009.
- ↑ "Archived copy". Archived from the original on 18 September 2010. Retrieved 6 February 2016.
- ↑ South African Police Service 2009 Annual Report Archived 25 July 2013 at the Wayback Machine. page 9 indicating the number exceeds 3 million
- ↑
- ↑ "Mid-year population estimates 2014" (PDF). Statistics South Africa. 31 July 2014. Retrieved 8 December 2015.
- ↑ "South Africa: Settlement Patterns". Britannica.com. Retrieved 25 October 2017.
- ↑ "Community Survey 2016: Provinces at a Glance" (PDF). Statistics South Africa. Retrieved 28 April 2018.
Further reading
- Alexander, Mary (30 June 2006). "Black, white – or South African?". SAinfo. Retrieved 26 June 2013.
- "A Nation in the Making: A Discussion Document on Macro-Social Trends in South Africa" (PDF). Government of South Africa. 2006. Archived from the original (PDF) on 11 July 2006. Retrieved 26 June 2013.
External links
| Wikimedia Commons has media related to Demographics of South Africa. |
- Sunday Standard article on Zimbabwe Refugee Crisis
- Contains information on the South African middle class
- Middle Class in South Africa-Significance, role and impact
| Religions | |
|---|---|
| Ethnic groups | |
| Foreign nationals | |