Demographics of Cyprus

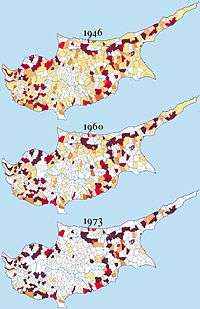
The people of Cyprus are broadly divided into two main ethnic communities, Greek Cypriots and Turkish Cypriots, who share many cultural traits but maintain distinct identities based on ethnicity, religion, language, and close ties with their respective motherlands. Before the dispute started in 1964 the peoples of Cyprus (then 77% Greek Cypriots, 18% Turkish Cypriots, 5% other communities, including Armenians and Maronites)[1] were dispersed over the entire island.
The Turkish invasion of Cyprus in 1974 de facto partitioned the island into two political areas: 99.5% of Greek Cypriots now live in the Republic of Cyprus while 98.7% of Turkish Cypriots live in Northern Cyprus (of other nationalities, 99.2% live in the Greek Cypriot area in the south).[2] Greek is predominantly spoken in the South, where the majority are Greek Cypriots, Turkish in the north, where the majority are Turkish Cypriots. English is widely used throughout the island, as a common language.
The total population of Cyprus as of the end of 2006 is slightly over 1 million, comprising 789,300 in the territory controlled by the government of the Republic of Cyprus[3] and 294,406 in Northern Cyprus. The population of Northern Cyprus includes some 150,000–160,000 Turkish immigrants who are regarded as illegal settlers by the Republic of Cyprus government and are not included in the population statistics of the Republic of Cyprus Statistical Service.[4][5]
Population

- 838,897 in Republic of Cyprus controlled area (October 2011 census preliminary result)[6]
- 294.906 in Northern Cyprus (2011 population census).[7]
- 1,133,803 total population of Cyprus (sum of population in Government controlled area and Northern Cyprus, 2011 data)
Population by citizenship
Republic of Cyprus government controlled area:
- 1992 census: 95.8% Cypriot, 4.2% Non-Cypriot[8]
- 2001 census: 90.6% Cypriot, 9.4% Non-Cypriot[8]
- 2011 census: 78.6% Cypriot, 21.4% Non-Cypriot (preliminary)[6]
Northern Cyprus:[7]
- 2006 census (de facto population): 66.7% NC, 29.3% Turkey, 4.0% other
Vital statistics
Cyprus (1901–1990)
Historical data about main demographic indicators from 1901 to 1990, for the entire island:[9][10][11]
| Average population (x 1000) | Live births1 | Deaths1 | Natural change | Crude birth rate (per 1000) | Crude death rate (per 1000) | Natural change (per 1000) | |
|---|---|---|---|---|---|---|---|
| 1901 | 238 | 7 300 | 4 300 | 3 000 | 30.6 | 18.1 | 12.5 |
| 1902 | 241 | 6 700 | 3 500 | 3 200 | 28.0 | 14.6 | 13.4 |
| 1903 | 245 | 7 000 | 3 600 | 3 400 | 28.6 | 14.6 | 14.0 |
| 1904 | 249 | 7 600 | 3 700 | 3 900 | 30.4 | 14.8 | 15.6 |
| 1905 | 253 | 7 500 | 4 500 | 3 000 | 29.6 | 17.7 | 11.9 |
| 1906 | 257 | 7 900 | 4 100 | 3 800 | 30.7 | 15.8 | 14.9 |
| 1907 | 260 | 8 200 | 4 600 | 3 600 | 31.4 | 17.7 | 13.7 |
| 1908 | 264 | 8 700 | 5 200 | 3 500 | 32.9 | 19.7 | 13.2 |
| 1909 | 268 | 8 000 | 4 500 | 3 500 | 29.8 | 16.9 | 12.9 |
| 1910 | 271 | 8 700 | 4 100 | 4 600 | 32.1 | 15.2 | 16.9 |
| 1911 | 275 | 8 700 | 4 500 | 4 200 | 31.6 | 16.2 | 15.4 |
| 1912 | 279 | 8 000 | 4 900 | 3 100 | 28.5 | 17.7 | 10.8 |
| 1913 | 283 | 8 700 | 5 300 | 3 400 | 30.7 | 18.8 | 11.9 |
| 1914 | 287 | 9 500 | 5 100 | 4 400 | 33.1 | 17.6 | 15.5 |
| 1915 | 291 | 10 000 | 5 800 | 4 200 | 34.3 | 19.8 | 14.5 |
| 1916 | 294 | 5 900 | 5 300 | 600 | 20.0 | 17.9 | 2.1 |
| 1917 | 297 | 8 800 | 5 400 | 3 400 | 29.5 | 18.2 | 11.3 |
| 1918 | 301 | 9 900 | 6 900 | 3 000 | 32.9 | 22.9 | 10.0 |
| 1919 | 305 | 8 900 | 5 200 | 3 700 | 29.2 | 17.2 | 12.0 |
| 1920 | 309 | 9 100 | 7 400 | 1 700 | 29.5 | 23.9 | 5.6 |
| 1921 | 312 | 8 400 | 6 200 | 2 200 | 26.8 | 20.0 | 6.8 |
| 1922 | 315 | 9 000 | 6 200 | 2 800 | 28.6 | 19.6 | 9.0 |
| 1923 | 318 | 8 100 | 5 700 | 2 400 | 25.5 | 18.0 | 7.5 |
| 1924 | 322 | 8 800 | 5 600 | 3 200 | 27.3 | 17.4 | 9.9 |
| 1925 | 326 | 8 300 | 4 700 | 3 600 | 25.6 | 14.4 | 11.2 |
| 1926 | 330 | 8 500 | 5 600 | 2 900 | 25.9 | 17.1 | 8.8 |
| 1927 | 333 | 8 400 | 5 200 | 3 200 | 25.2 | 15.6 | 9.6 |
| 1928 | 337 | 9 700 | 5 100 | 4 600 | 28.9 | 15.2 | 13.7 |
| 1929 | 341 | 10 400 | 4 600 | 5 800 | 30.4 | 13.5 | 16.9 |
| 1930 | 345 | 11 100 | 5 700 | 5 400 | 32.1 | 16.4 | 15.7 |
| 1931 | 349 | 10 500 | 5 900 | 4 600 | 30.2 | 17.0 | 13.2 |
| 1932 | 352 | 10 100 | 5 740 | 4 360 | 28.7 | 16.3 | 12.4 |
| 1933 | 356 | 9 750 | 4 910 | 4 840 | 27.4 | 13.8 | 13.6 |
| 1934 | 360 | 10 852 | 4 757 | 6 095 | 30.1 | 13.2 | 16.9 |
| 1935 | 363 | 11 735 | 4 976 | 6 759 | 32.3 | 13.7 | 18.6 |
| 1936 | 367 | 12 727 | 4 656 | 8 071 | 34.7 | 12.7 | 22.0 |
| 1937 | 371 | 10 954 | 6 334 | 4 620 | 29.5 | 17.1 | 12.5 |
| 1938 | 376 | 11 804 | 5 445 | 6 359 | 31.4 | 14.5 | 16.9 |
| 1939 | 393 | 12 214 | 5 519 | 6 695 | 31.1 | 14.0 | 17.0 |
| 1940 | 401 | 13 254 | 4 678 | 8 576 | 33.1 | 11.7 | 21.4 |
| 1941 | 409 | 11 402 | 5 058 | 6 344 | 27.9 | 12.4 | 15.5 |
| 1942 | 412 | 9 221 | 6 747 | 2 474 | 22.4 | 16.4 | 6.0 |
| 1943 | 416 | 12 405 | 5 155 | 7 250 | 29.8 | 12.4 | 17.4 |
| 1944 | 425 | 14 330 | 4 263 | 10 067 | 33.7 | 10.0 | 23.7 |
| 1945 | 435 | 13 269 | 4 111 | 9 158 | 30.5 | 9.5 | 21.1 |
| 1946 | 447 | 14 482 | 3 793 | 10 689 | 32.4 | 11.0 | 23.9 |
| 1947 | 458 | 15 158 | 3 875 | 11 283 | 33.1 | 11.0 | 24.6 |
| 1948 | 477 | 15 078 | 5 250 | 9 828 | 31.6 | 11.0 | 20.6 |
| 1949 | 485 | 13 234 | 5 290 | 7 944 | 27.3 | 11.0 | 16.4 |
| 1950 | 494 | 14 517 | 5 340 | 9 187 | 29.4 | 11.0 | 18.6 |
| 1951 | 502 | 14 403 | 5 370 | 9 043 | 28.7 | 10.5 | 18.0 |
| 1952 | 508 | 13 358 | 5 380 | 7 968 | 26.3 | 10.5 | 15.7 |
| 1953 | 515 | 13 446 | 5 410 | 8 036 | 26.1 | 10.5 | 15.6 |
| 1954 | 523 | 13 893 | 5 490 | 8 403 | 26.6 | 10.5 | 16.1 |
| 1955 | 530 | 13 747 | 5 570 | 8 177 | 25.9 | 10.5 | 15.4 |
| 1956 | 536 | 13 875 | 5 630 | 8 215 | 25.9 | 10.5 | 15.3 |
| 1957 | 546 | 14 100 | 5 730 | 8 350 | 25.8 | 10.5 | 15.3 |
| 1958 | 558 | 14 320 | 5 860 | 8 480 | 25.7 | 10.5 | 15.2 |
| 1959 | 567 | 14 411 | 5 950 | 8 491 | 25.4 | 10.5 | 15.0 |
| 1960 | 573 | 14 500 | 6 020 | 8 510 | 25.3 | 10.5 | 14.9 |
| 1961 | 575 | 15 059 | 6 206 | 8 853 | 26.2 | 10.8 | 15.4 |
| 1962 | 577 | 14 787 | 6 101 | 8 686 | 25.6 | 10.6 | 15.0 |
| 1963 | 582 | 14 602 | 6 079 | 8 523 | 25.1 | 10.4 | 14.6 |
| 1964 | 587 | 14 224 | 6 206 | 8 018 | 24.2 | 10.6 | 13.7 |
| 1965 | 591 | 13 707 | 6 061 | 7 646 | 23.2 | 10.3 | 12.9 |
| 1966 | 595 | 13 250 | 5 991 | 7 259 | 22.3 | 10.1 | 12.2 |
| 1967 | 599 | 12 788 | 5 971 | 6 817 | 21.3 | 10.0 | 11.4 |
| 1968 | 604 | 12 403 | 5 958 | 6 445 | 20.5 | 9.9 | 10.7 |
| 1969 | 609 | 12 046 | 5 946 | 6 100 | 19.8 | 9.8 | 10.0 |
| 1970 | 614 | 11 801 | 5 998 | 5 803 | 19.2 | 9.8 | 9.4 |
| 1971 | 620 | 11 641 | 5 983 | 5 658 | 18.8 | 9.7 | 9.1 |
| 1972 | 627 | 11 620 | 6 043 | 5 577 | 18.5 | 9.6 | 8.9 |
| 1973 | 634 | 11 600 | 6 047 | 5 553 | 18.3 | 9.5 | 8.8 |
| 1974 | 630 | 10 578 | 6 900 | 3 678 | 16.8 | 11.0 | 5.8 |
| 1975 | 610 | 9 768 | 4 823 | 4 945 | 16.0 | 7.9 | 8.1 |
| 1976 | 599 | 11 194 | 5 148 | 6 046 | 18.7 | 8.6 | 10.1 |
| 1977 | 599 | 10 951 | 5 445 | 5 506 | 18.3 | 9.1 | 9.2 |
| 1978 | 601 | 11 299 | 5 048 | 6 251 | 18.8 | 8.4 | 10.4 |
| 1979 | 605 | 11 920 | 5 083 | 6 837 | 19.7 | 8.4 | 11.3 |
| 1980 | 611 | 12 464 | 5 682 | 6 782 | 20.4 | 9.3 | 11.1 |
| 1981 | 618 | 12 111 | 5 190 | 6 921 | 19.6 | 8.4 | 11.2 |
| 1982 | 625 | 12 985 | 5 307 | 7 678 | 20.8 | 8.5 | 12.3 |
| 1983 | 632 | 13 078 | 5 433 | 7 645 | 20.7 | 8.6 | 12.1 |
| 1984 | 640 | 13 182 | 5 119 | 8 063 | 20.6 | 8.0 | 12.6 |
| 1985 | 648 | 12 622 | 5 502 | 7 120 | 19.5 | 8.5 | 11.0 |
| 1986 | 654 | 12 753 | 5 494 | 7 259 | 19.5 | 8.4 | 11.1 |
| 1987 | 660 | 12 331 | 5 869 | 6 462 | 18.7 | 8.9 | 9.8 |
| 1988 | 665 | 12 753 | 5 845 | 6 908 | 19.2 | 8.8 | 10.4 |
| 1989 | 671 | 12 141 | 5 702 | 6 439 | 18.1 | 8.5 | 9.6 |
1 The numbers of births and deaths 1901–1932 are estimates calculated from the birth and death rates.
Area under the effective control of the Republic of Cyprus
Historical data about main demographic indicators from 1990 to 2013, for the southern part of the island:[11]
| Average population (x 1000) | Live births | Deaths | Natural change | Crude birth rate (per 1000) | Crude death rate (per 1000) | Natural change (per 1000) | Total fertility rate | Infant mortality rate | |
|---|---|---|---|---|---|---|---|---|---|
| 1990 | 581 | 10 622 | 4 844 | 5 778 | 18.3 | 8.3 | 9.9 | 2.4 | 11.0 |
| 1991 | 594 | 9 486 | 4 455 | 5 031 | 16.0 | 7.5 | 8.5 | 2.3 | 11.0 |
| 1992 | 610 | 9 240 | 4 386 | 4 854 | 15.2 | 7.2 | 8.0 | 2.5 | 10.0 |
| 1993 | 626 | 10 514 | 4 789 | 5 725 | 16.8 | 7.6 | 9.1 | 2.3 | 8.6 |
| 1994 | 639 | 10 379 | 4 924 | 5 455 | 16.2 | 7.7 | 8.5 | 2.2 | 8.6 |
| 1995 | 651 | 9 869 | 4 935 | 4 934 | 15.2 | 7.6 | 7.6 | 2.0 | 8.5 |
| 1996 | 661 | 9 638 | 4 958 | 4 680 | 14.6 | 7.5 | 7.1 | 2.0 | 8.3 |
| 1997 | 671 | 9 275 | 5 173 | 4 102 | 13.8 | 7.7 | 6.1 | 1.9 | 8.0 |
| 1998 | 679 | 8 879 | 5 432 | 3 447 | 13.1 | 8.0 | 5.1 | 1.8 | 7.0 |
| 1999 | 687 | 8 505 | 5 070 | 3 435 | 12.4 | 7.4 | 5.0 | 1.7 | 6.0 |
| 2000 | 694 | 8 447 | 5 355 | 3 092 | 12.2 | 7.7 | 4.5 | 1.6 | 5.6 |
| 2001 | 702 | 8 167 | 4 827 | 3 340 | 11.6 | 6.9 | 4.8 | 1.6 | 4.9 |
| 2002 | 710 | 7 883 | 5 168 | 2 715 | 11.1 | 7.3 | 3.8 | 1.5 | 4.7 |
| 2003 | 718 | 8 088 | 5 200 | 2 888 | 11.2 | 7.2 | 4.0 | 1.51 | 4.1 |
| 2004 | 728 | 8 309 | 5 225 | 3 084 | 11.2 | 7.1 | 4.2 | 1.52 | 3.5 |
| 2005 | 739 | 8 243 | 5 420 | 2 823 | 10.9 | 7.2 | 3.7 | 1.48 | 4.6 |
| 2006 | 751 | 8 731 | 5 127 | 3 604 | 11.3 | 6.6 | 4.7 | 1.52 | 3.1 |
| 2007 | 767 | 8 575 | 5 380 | 3 195 | 10.9 | 6.9 | 4.1 | 1.44 | 3.1 |
| 2008 | 787 | 9 205 | 5 194 | 4 011 | 11.6 | 6.5 | 5.1 | 1.48 | 3.5 |
| 2009 | 808 | 9 608 | 5 182 | 4 426 | 12.0 | 6.5 | 5.5 | 1.51 | 3.3 |
| 2010 | 829 | 9 801 | 5 103 | 4 698 | 11.7 | 6.1 | 5.6 | 1.44 | 3.2 |
| 2011 | 851 | 9 622 | 5 504 | 4 118 | 11.2 | 6.4 | 4.8 | 1.35 | 3.1 |
| 2012 | 865 | 10 151 | 5 665 | 4 486 | 11.8 | 6.6 | 5.2 | 1.39 | 3.5 |
| 2013 | 858 | 9 290 | 5 257 | 4 033 | 10.8 | 6.1 | 4.7 | 1.30 | 1.6 |
| 2014 | 847 | 9 258 | 5 141 | 4 117 | 10.8 | 6.0 | 4.8 | 1.31 | 2.1 |
| 2015 | 848 | 9 170 | 5 859 | 3 311 | 10.8 | 6.9 | 3.9 | 1.32 | 2.7 |
| 2016 | 851.55 | 9 455 | 5 471 | 3 984 | 11.1 | 6.4 | 4.7 | 1.37 | |
| 2017 | 864.2 | 9 200 | 6 000 | 3 200 | 10.7 | 7.0 | 3.7 |
Life expectancy
| Period | Life expectancy in Years |
Period | Life expectancy in Years |
|---|---|---|---|
| 1950–1955 | 66.7 | 1985–1990 | 76.1 |
| 1955–1960 | 70.4 | 1990–1995 | 76.9 |
| 1960–1965 | 71.9 | 1995–2000 | 77.7 |
| 1965–1970 | 73.1 | 2000–2005 | 78.3 |
| 1970–1975 | 74.3 | 2005–2010 | 79.0 |
| 1975–1980 | 75.3 | 2010–2015 | 79.9 |
| 1980–1985 | 76.1 |
Source: UN World Population Prospects[12]
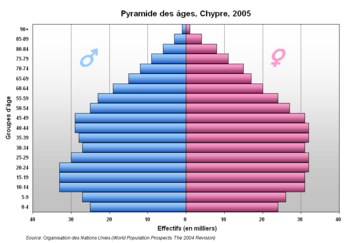
Structure of the population [13]
Structure of the population (01.10.2011) (Census) (Data refer to government controlled areas) :
| Age Group | Male | Female | Total | % |
|---|---|---|---|---|
| Total | 408 780 | 431 627 | 840 407 | 100 |
| 0-4 | 23 061 | 21 954 | 45 015 | 5,36 |
| 5-9 | 21 921 | 20 714 | 42 635 | 5,07 |
| 10-14 | 24 179 | 23 119 | 47 298 | 5,63 |
| 15-19 | 28 683 | 27 135 | 55 818 | 6,64 |
| 20-24 | 33 891 | 32 182 | 66 073 | 7,86 |
| 25-29 | 36 992 | 37 122 | 74 114 | 8,82 |
| 30-34 | 33 149 | 36 685 | 69 834 | 8,31 |
| 35-39 | 27 754 | 34 108 | 61 862 | 7,36 |
| 40-44 | 27 031 | 32 697 | 59 728 | 7,11 |
| 45-49 | 27 059 | 30 181 | 57 240 | 6,81 |
| 50-54 | 27 517 | 28 611 | 56 128 | 6,68 |
| 55-59 | 23 771 | 23 991 | 47 762 | 5,68 |
| 60-64 | 22 057 | 22 977 | 45 034 | 5,36 |
| 65-69 | 17 656 | 18 672 | 36 328 | 4,32 |
| 70-74 | 14 044 | 15 389 | 29 433 | 3,50 |
| 75-79 | 9 647 | 11 411 | 21 058 | 2,51 |
| 80+ | 10 342 | 14 606 | 24 948 | 2,97 |
| unknown | 26 | 73 | 99 | 0,01 |
| Age group | Male | Female | Total | Percent |
|---|---|---|---|---|
| 0-14 | 69 161 | 65 787 | 134 948 | 16,06 |
| 15-64 | 287 904 | 305 689 | 593 593 | 70,63 |
| 65+ | 51 689 | 60 078 | 111 767 | 13,30 |
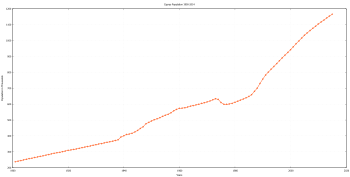
Historical population
Turkish Cypriots were the majority of the population registered for taxation between 1777 and 1800.[14][15] However, it is likely that the Muslim population never exceeded 35-40 per cent of the total population of Cyprus. Rather, many Orthodox Christians registered as Muslims in order to reduce taxation from their occupiers.[16]
| Ethnic group |
census 17771 | census 17902 | census 17933 | census 18004 | ||||||||||||
|---|---|---|---|---|---|---|---|---|---|---|---|---|---|---|---|---|
| Number | % | Number | % | Number | % | Number | % | |||||||||
| Greeks | 37,000 | 44.0 | 47,500 | 41.5 | 46,392 | 39.3 | 30,524 | 31.3 | ||||||||
| Turks | 47,000 | 56.0 | 67,000 | 58.5 | 67,000 | 58.8 | 67,000 | 68.7 | ||||||||
| Armenians | ||||||||||||||||
| Maronites | ||||||||||||||||
| Others | 4,608 | 3.9 | ||||||||||||||
| Total | 84,000 | 114,500 | 118,000 | 97,524 | ||||||||||||
| Ethnic group |
1881 census[17] | 1891 census[17] | 1901 census[17] | 1911 census[17] | 1921 census[17] | 1931 census[17] | 1946 census | 1960 census | 2011 census[18] | |||||||||
|---|---|---|---|---|---|---|---|---|---|---|---|---|---|---|---|---|---|---|
| Number | % | Number | % | Number | % | Number | % | Number | % | Number | % | Number | % | Number | % | Number | % | |
| Greeks | 137,631 | 73.9 | 158,585 | 75.8 | 182,739 | 77.1 | 214,480 | 78.2 | 244,887 | 78.8 | 276,572 | 79.5 | 361,199 | 80.2 | 442,363 | 77.1 | 659,115 | 98,8% |
| Turks | 45,458 | 24.4 | 47,926 | 22.9 | 51,309 | 21.6 | 56,428 | 20.6 | 61,339 | 19.7 | 64,238 | 18.5 | 80,548 | 17.9 | 104,333 | 18.2 | 1,128 | 0,2% |
| Armenians | 174 | 0.1 | 280 | 0.1 | 517 | 0.2 | 558 | 0.2 | 1,197 | 0.4 | 3,377 | 1 | 3,686 | 0.8 | 3,630 | 1,831 | 0,3% | |
| Maronites | 830 | 0.4 | 1,131 | 0.5 | 1,130 | 0.5 | 1,073 | 1,350 | 1,704 | 2,083 | 2,752 | 3,656 | 0,5% | |||||
| Others | 1,738 | 0.9 | 1.364 | 0.7 | 1,327 | 0.6 | 1,569 | 1,942 | 2,068 | 2,598 | 20,488 | 1,460 | 0,2% | |||||
| Total | 186,173 | 209,286 | 237,022 | 274,108 | 310,715 | 347,959 | 450,114 | 573,566 | 667,398 | |||||||||
In the census from 1881 to 1960, all Muslims are counted as Turks, only Greek Orthodox are counted as Greeks. There were small populations of Greek-speaking Muslims and Turkish-speaking Greek Orthodox.[19]
In total, between 1955 and 1973, 16,519 Turks and 71,036 Greeks emigrated from the country. Of the emigrated Turkish Cypriots in this period, only 290 went to Turkey.[20] In the 2011 census, 208 people stated their ethnic origin as being Latin.[18]
Immigration
Large-scale demographic changes have been caused since 1964 by the movements of peoples across the island and the later influx of settlers from Turkey to Northern Cyprus. According to the 2011 Census there are 170,383 non-citizens living in Cyprus, of whom 106,270 are EU citizens and 64,113 are from third countries. The largest EU groups by nationality are Greeks (29,321), British (24,046), Romanians (23,706) and Bulgarians (18,536). The largest non-EU groups are Filipinos (9,413), Russians (8,164), Sri Lankans (7,269) and Vietnamese (7,028).[21] There are an estimated 20–25,000 undocumented migrants from third countries also living in the Republic, though migrant rights groups dispute these figures.[22] The demographic changes in society have led to some racist incidents,[23][24][25] and the formation of the charity KISA in response.
The demographic character of Northern Cyprus changed after the Turkish invasion in 1974 and especially during the last 10–15 years. The so called “TRNC census” carried out in April 2006 showed that out of a total population of 256,644 in Northern Cyprus, 132,635, or 52%, were Turkish Cypriots in the sense that they were born in Cyprus of at least one Cyprus-born parent (for 120,007 of these both parents were Cyprus-born). In addition, 43,062 so called “TRNC citizens” (17%) had at least one non-Cypriot Turkish-born parent, 2,334 so called “TRNC citizens” (1%) had parents born in other countries, 70,525 residents (27%) had Turkish citizenship, and 8,088 (3%) were citizens of other countries (mainly UK, Bulgaria, and Iran).[7]
Based on these census data, it is estimated that 113,687 Northern Cyprus residents, or 44% of the population, are not Turkish Cypriots properly speaking, but are in fact "Turkish immigrants" or "Turkish settlers" from Anatolia. Alternative sources suggest that there are 146,122 Turkish settlers from Anatolia in Northern Cyprus (2007 figures)[26] and that the Turkish Cypriots in Northern Cyprus are today outnumbered by the Turkish settlers,[27] contrary to the picture presented by the 2006 so called “TRNC census”.
Almost one-third of the Turkish settlers in Northern Cyprus have been granted “TRNC citizenship” by the so called “authorities” of Northern Cyprus and have thus been naturalized.[28] The Republic of Cyprus regards settlement in Northern Cyprus, especially if accompanied by naturalization, as a violation of the Geneva Conventions Protocol of 1977, since the Turkish occupation has been declared illegal by the UN. It therefore considers these Turkish immigrants to be "illegal settlers" and does not include them in the population estimates for the entire island published by the Republic of Cyprus Statistical Service.[5]
Emigration
Nationality group
- Greek 98.8%,[29]
- Other 1% (includes Maronite, Armenian, Turkish-Cypriot)
- Uspecified 0.2%
| Ethnic group | % | Inhabitants |
|---|---|---|
| 17.3 | 31,044 | |
| 14.8 | 26,659 | |
| 13.6 | 24,376 | |
| 10.7 | 19,197 | |
| 10.7 | 19,197 | |
| 4.8 | 8,663 | |
| 4.1 | 7,350 | |
| 4.0 | 7,102 | |
| 1.8 | 3,235 | |
| 1.7 | 3,023 | |
| 1.6 | 2,955 | |
| 1.6 | 2,951 | |
| 1.2 | 2,113 | |
| 0.6 | 1,162 | |
| Other EU countries | 4 | 7,035 |
| Other non-EU countries | 12 | 22,938 |
Languages
Greek and Turkish are the official languages according to Article 3 of the Constitution of Cyprus. In Northern Cyprus, the official language is Turkish (Article 2 of the 1983 Constitution of Northern Cyprus). English is widely spoken on the island, and Russian has become fairly widespread in recent years due to the influx of immigrants and investors from CIS countries.
Religion
The Greek Cypriot community adheres to the Autocephalous Greek Orthodox Church of Cyprus and the Turkish Cypriot community adheres to Islam. The religious groups of Armenians, Maronites and Latins (about 9,000 people in total) opted, in accordance with the 1960 constitution, to belong to the Greek Cypriot community.[4]
According to the 2001 census carried out in the Government controlled area,[8] 98.2% of the population are Christians of various denominations. 94.8% of the population are Christian Orthodox, 0.9% Armenians and Maronites, 1.5% Roman Catholics ("Latins"), 1.0% Church of England, and 0.6% Muslims. The remaining 1.3% adhere to other religious denominations or did not state their religion. Cyprus is also the home of a Jewish community with a Synagogue in Larnaca.
Education
Cyprus has a well-developed system of primary and secondary education. The majority of Cypriots earn their higher education at Greek, British, or American universities, while there are also sizeable emigrant communities in the United Kingdom and Australia. Private colleges and state-supported universities have been developed by both the Turkish and Greek communities.
Demographic statistics
The following demographic statistics are from the CIA World Factbook, unless otherwise indicated.[30]
The data in subsections Age structure through Divorce rate are for the area controlled by the Republic of Cyprus government only. The estimates are for 2007 from the Republic of Cyprus Statistical Abstract 2007 (pp. 63–88)[5] unless indicated otherwise.
Age structure
- 0–14 years: 17.47% or 137,900 ( 70,700 males/67,200 females)
- 15–64 years: 70.07% or 553,100 ( 274,300 males/278,800 females)
- 65 years and over: 12.46% or 98,300 ( 44,600 males/53,700 females)
Population growth rate
- 1.4%[31]
Net migration rate
- Total immigrants: 19,142
- Total emigrants: 11,752
- Net migration: +7,390
- Net migration rate: 9.4 migrant(s)/1,000 population
Sex ratio
- At birth: 1.086 male(s)/female
- Under 15 years: 1.05 male(s)/female
- 15–64 years: 0.98 male(s)/female
- 65 years and over: 0.83 male(s)/female
- Total population: 0.99 male(s)/female
Marriage rates
- Estimates for 2006
Number of marriages:
- Marriages of residents of Cyprus: 5,252
- Total marriages (including tourists): 12,617
Marriage rates:
- Residents of Cyprus: 6.8/1,000 population
- Total marriages (including tourists): 16.4/1,000 population
Mean age at marriage:
- Groom 33.7
- Bride 30.5
Divorce rates
- Total Divorces: 200,000
- Divorce Rate: 2.27/1,000 population
Nationality
- Noun: Cypriot(s)
- Adjective: Cypriot
HIV/AIDS
- Adult prevalence rate: 0.1% (2003 est.)
- People living with HIV/AIDS: fewer than 1,000 (1999 est.); 518 cases reported between 1986 and 2006 (58% Cypriots, 42% foreigners/visitors);[32]
- Deaths: 85 reported between 1986 and 2006.[32]
"The information presented here concerns only part of Cyprus, due to an absence of reliable information concerning the island as a whole".[32]
References
![]()
- ↑ Eric Solsten, ed. Cyprus: A Country Study, Library of Congress, Washington, DC, 1991
- ↑ Cyprus Facts on Worldpress.org. Retrieved 29 February 2009
- ↑ Statistical Service of the Republic of Cyprus, DEMOGRAPHIC REPORT 2007 (p. 12)
- 1 2 Cyprus Government web portal: Towns and Population. Retrieved on 28 February 2009
- 1 2 3 Statistical Abstract of the Republic of Cyprus 2007, Statistical Service of Cyprus, pp. 63–88
- 1 2 3 Preliminary Results of the Census of Population, 2011 Preliminary Results of the Census of Population, 2011
- 1 2 3 "Archived copy" (PDF). Archived from the original (PDF) on 2013-09-27. Retrieved 2014-02-14.
- 1 2 3 Statistical Service of Cyprus: Population and Social Statistics Archived 2010-08-21 at the Wayback Machine., Main Results of the 2001 Census. Retrieved on 29 February 2009
- ↑ B.R. Mitchell. European historical statistics. 1750–1975.
- ↑ http://unstats.un.org/unsd/demographic/products/dyb/dybsets/1948%20DYB.pdf United nations. Demographic Yearbook 1948
- 1 2 Statistical Service of Cyprus
- ↑ "World Population Prospects – Population Division – United Nations". Retrieved 2017-07-15.
- ↑ http://unstats.un.org/unsd/demographic/products/dyb/dyb2.htm
- ↑ Claude Delaval Cobham Excerpta Cypria, Cambridge University Press, 1908, p.366-67
- ↑ Archimandrite Kyprianos Istoria Khronoloyiki tis Nisou Kiprou (History and Chronicles of the Island of Cyprus, Ιστορία χρονολογική της νήσου Κύπρου) 1788, p.495
- ↑
- 1 2 3 4 5 6 Alexander-Michael Hadjilyra. The Armenians of Cyprus. p. 21.
- 1 2 "Population - Country of Birth, Citizenship Category, Country of Citizenship, Language, Religion, Ethnic/Religious Group, 2011". Retrieved 12 May 2018.
- ↑ A Handbook of Cyprus, Hutchinson, Joseph Turner, page 57, 1907
- ↑ Hatay, Mete (2007). "Is the Turkish Cypriot population shrinking?: an overview of the ethno-demography of Cyprus in the light of the preliminary results of the 2006 Turkish-Cypriot census" (PDF). International Peace Research Institute. p. 64.
- ↑ "Archived copy". Archived from the original on 2012-07-23. Retrieved 2012-07-20.
- ↑ http://cms.horus.be/files/99907/MediaArchive/Events/Study_Visits/KISA%20Intervention.pdf
- ↑ "My girl thought she was going to die"
- ↑ "Why the Republic of Cyprus is institutionally racist"
- ↑ "Teen says beaten and mocked by police in racist incident"</
- ↑ Çalışma Sosyal Güvenlik Bakanlığı Archived 2016-01-23 at the Wayback Machine.
- ↑ The Turkish Settlers in Northern Cyprus, www.cyprus-conflict.net, quoting "Fresh Tension for Cyprus: Counting the Newcomers" in The New York Times, January 23, 1991."Archived copy". Archived from the original on 2008-03-25. Retrieved 2016-05-15.
- ↑ Today's Zaman Archived 2012-03-02 at the Wayback Machine.
- 1 2 3 "Middle East :: CYPRUS". CIA The World Factbook.
- ↑ CIA – The World Factbook – Cyprus
- ↑ Population of Cyprus: end of 2007, Statistical Service of the Republic of Cyprus, Press Release 06/10/2008. Retrieved 26 February 2009.
- 1 2 3 Cyprus: Sexually transmitted infections/HIV/AIDS Archived 2009-10-28 at the Wayback Machine., World Health Organization Regional Office for Europe, June 2008.
- EU27 population projections 2008–2060, Eurostat Newsrelease 119/2008, 26 August 2008.