Demographics of Botswana
This article is about the demographic features of the population of Botswana, including population density, ethnicity, education level, health of the populace, economic status, religious affiliations and other aspects of the population.

Botswana, like many nations in southern Africa, suffers from a high HIV infection rate, estimated among adults ages 15 to 49 to be 24.8%.[1]
Population
Census results
| Botswana Population and Housing Census | ||
|---|---|---|
| Year | Pop. | ±% p.a. |
| 1904 | 120,776 | — |
| 1911 | 124,350 | +0.42% |
| 1921 | 152,983 | +2.09% |
| 1936 | 265,756 | +3.75% |
| 1946 | 296,310 | +1.09% |
| 1956 | 309,175 | +0.43% |
| 1964 | 549,510 | +7.45% |
| 1971 | 596,994 | +1.19% |
| 1981 | 941,027 | +4.66% |
| 1991 | 1,326,796 | +3.50% |
| 2001 | 1,680,863 | +2.39% |
| 2011 | 2,024,787 | +1.88% |
| [2][3][4] | ||
Bechuanaland Protectorate
The seven censuses of Botswana before its independence happened irregularly. Due to the Anglo-Boer War, the first census of Bechuanaland Protectorate, originally set to occur in 1901, took place on 17 April 1904.[2] The 1931 census was postponed to 1936 because of the Great Depression.[2] The early censuses were unreliable and took several years to tabulate; the results were outdated by the time they were calculated.
Post-independence
There have been five censuses after the independence of Botswana, each occurring every ten years in the year ending in 1 (i.e. 1971, 1981, 1991, 2001, and 2011). The 1971 census was the first census in Botswana to use de facto enumeration; this method counts people based on how many people spent census night at a specific location. Previously, the citizens were counted based on their usual place of residence. The 2001 census was the first census in Botswana to comply with the SADC 2000 Census Project, the guidelines of which unify the demographic statistics in southern Africa. The most recent census was the 2011 Botswana Population and Housing Census, which occurred in August 2011.
UN estimates
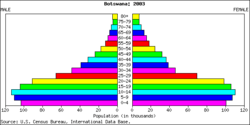
According to the 2017 revision of the World Population Prospects[5] the total population was 2,250,260 in 2016, compared to only 413,000 in 1950. The proportion of children below the age of 15 in 2010 was 32.6%, 63.4% was between 15 and 65 years of age, while 4% was 65 years or older.[6]
| Total population | Population aged 0–14 (%) | Population aged 15–64 (%) | Population aged 65+ (%) | |
|---|---|---|---|---|
| 1950 | 413 000 | 40.9 | 54.8 | 4.4 |
| 1955 | 470 000 | 42.4 | 53.4 | 4.2 |
| 1960 | 524 000 | 45.6 | 50.4 | 4.0 |
| 1965 | 596 000 | 48.4 | 48.2 | 3.5 |
| 1970 | 693 000 | 47.9 | 48.9 | 3.2 |
| 1975 | 822 000 | 47.1 | 50.1 | 2.8 |
| 1980 | 996 000 | 46.5 | 51.0 | 2.5 |
| 1985 | 1 183 000 | 46.3 | 51.2 | 2.4 |
| 1990 | 1 382 000 | 44.8 | 52.6 | 2.6 |
| 1995 | 1 586 000 | 41.6 | 55.7 | 2.7 |
| 2000 | 1 758 000 | 37.9 | 59.0 | 3.0 |
| 2005 | 1 876 000 | 34.9 | 61.6 | 3.5 |
| 2010 | 2 007 000 | 32.6 | 63.4 | 4.0 |
Vital statistics
Registration of vital events is in Botswana not complete. The Population Departement of the United Nations prepared the following estimates. [6]
| Period | Live births per year | Deaths per year | Natural change per year | CBR* | CDR* | NC* | TFR* | IMR* |
|---|---|---|---|---|---|---|---|---|
| 1950–1955 | 21 000 | 8 000 | 12 000 | 47.0 | 18.8 | 28.2 | 6.50 | 135 |
| 1955–1960 | 23 000 | 9 000 | 15 000 | 47.3 | 17.3 | 29.9 | 6.58 | 124 |
| 1960–1965 | 26 000 | 9 000 | 17 000 | 46.6 | 15.6 | 31.0 | 6.65 | 113 |
| 1965–1970 | 30 000 | 9 000 | 21 000 | 46.1 | 14.0 | 32.1 | 6.70 | 104 |
| 1970–1975 | 34 000 | 9 000 | 25 000 | 45.5 | 12.0 | 33.4 | 6.55 | 90 |
| 1975–1980 | 41 000 | 9 000 | 32 000 | 45.0 | 9.9 | 35.1 | 6.37 | 75 |
| 1980–1985 | 46 000 | 9 000 | 37 000 | 42.5 | 8.4 | 34.1 | 5.97 | 63 |
| 1985–1990 | 48 000 | 9 000 | 39 000 | 37.2 | 7.0 | 30.2 | 5.11 | 54 |
| 1990–1995 | 48 000 | 11 000 | 37 000 | 32.2 | 7.2 | 25.0 | 4.32 | 51 |
| 1995–2000 | 48 000 | 18 000 | 30 000 | 28.6 | 11.0 | 17.7 | 3.70 | 61 |
| 2000–2005 | 46 000 | 27 000 | 19 000 | 25.5 | 14.9 | 10.6 | 3.18 | 59 |
| 2005–2010 | 47 000 | 25 000 | 23 000 | 24.2 | 12.6 | 11.6 | 2.90 | 41 |
| * CBR = crude birth rate (per 1000); CDR = crude death rate (per 1000); NC = natural change (per 1000); IMR = infant mortality rate per 1000 births; TFR = total fertility rate (number of children per woman) | ||||||||
Births and deaths [7]
| Year | Population | Live births | Deaths | Natural increase | Crude birth rate | Crude death rate | Rate of natural increase | TFR |
|---|---|---|---|---|---|---|---|---|
| 2012 | 40 856 | 12 270 | 28 586 | |||||
| 2014 | 41 741 | 12 177 | 29 564 | |||||
Source: Vital Statistics Report 2012.
Life expectancy at birth
Life expectancy from 1950 to 2015 (UN World Population Prospects)[8]:
| Period | Life expectancy in
Years |
|---|---|
| 1950–1955 | 47.67 |
| 1955–1960 | |
| 1960–1965 | |
| 1965–1970 | |
| 1970–1975 | |
| 1975–1980 | |
| 1980–1985 | |
| 1985–1990 | |
| 1990–1995 | |
| 1995–2000 | |
| 2000–2005 | |
| 2005–2010 | |
| 2010–2015 |
Ethnic groups
Languages
Religions
CIA World Factbook demographic statistics
The following demographic statistics are from the 2017 CIA World Factbook.
Population
- 2,214,858 (July 2017 est.)
Population growth rate
- 1.55% (2017 est.)
Birth rate
- 22.1 births/1,000 population (2017 est.)
Death rate
- 9.6 deaths/1,000 population (2017 est.)
Median age
- total: 24.5 years
- male: 23.5 years
- female: 25.6 years (2017 est.)
Net migration rate
- 3 migrant(s)/1,000 population (2009 est.)
- note: there is an increasing flow of Zimbabweans into Botswana and South Africa in search of better economic opportunities.
Urbanization
- Urban population: 69.4% of total population (2018)
- Rate of urbanization: 2.87% annual rate of change (2015–20 est.)
Sex ratio
- at birth: 1.03 male(s)/female
- under 15 years: 1.04 male(s)/female
- 15–64 years: 1.02 male(s)/female
- 65 years and over: 0.68 male(s)/female
- total population: 1.01 male(s)/female (2011 est.)
Life expectancy at birth
- Total population: 63.3 years
- Male: 61.2 years
- Female: 65.5 years (2017 est.)
HIV/AIDS
- Adult prevalence rate: 22.8% (2017 est.)
- People living with HIV/AIDS: 380,000 (2017 est.)
- Deaths due to AIDS: 4,100 (2017 est.)
Physicians density
- 0.38 physicians/1,000 population (2012)
Hospital bed density
- 1.8 beds/1,000 population (2010)
Obesity - adult prevalence rate
- 18.9% (2015)
Major infectious diseases
- Degree of risk: high
- Food or waterborne diseases: bacterial diarrhea, hepatitis A, and typhoid fever
- Vectorborne disease: malaria (2009)
Nationality
- Noun: Motswana (singular), Batswana (plural)
- Adjective: Motswana (singular), Batswana (plural)
Literacy
- Definition: age 15 and over can read and write
- Total population: 88.5%
- Male: 88%
- Female: 88.9% (2015 est.)
Education expenditure
- 8.7% of total GDP (2007)
References
| Wikimedia Commons has media related to Demographics of Botswana. |
- ↑ "HIV & Aids in Botswana". AVERT International HIV & Aids Charity. Retrieved 15 January 2013.
- 1 2 3 "History". Central Statistics Office. Archived from the original on 20 July 2012. Retrieved 20 July 2012.
- ↑ "TABLE 1: 1971, 1981, 1991 and 2001 CENSUS DEMOGRAPHIC INDICATORS; BOTSWANA" (PDF). Gaborone: Central Statistics Office. p. 1. Archived from the original (PDF) on 20 July 2012. Retrieved 20 July 2012.
- ↑ "The Population of Towns, Villages and Associated Localities" (PDF). 2011 Population and Housing Census. Gaborone: Statistics Botswana. June 2012. p. 1. Archived from the original (PDF) on 14 June 2012. Retrieved 20 July 2012.
- ↑ "World Population Prospects: The 2017 Revision". ESA.UN.org (custom data acquired via website). United Nations Department of Economic and Social Affairs, Population Division. Retrieved 10 September 2017.
- 1 2 "Population Division of the Department of Economic and Social Affairs of the United Nations Secretariat, World Population Prospects: The 2010 Revision". un.org. Retrieved 15 April 2018.
- ↑ http://unstats.un.org/unsd/demographic/products/dyb/dyb2.htm
- ↑ "World Population Prospects – Population Division – United Nations". Retrieved 2017-07-15.
- 1 2 3 4 5 6 7 8 9 10 11 12 13 "Africa :: BOTSWANA". CIA The World Factbook.
![]()
- Botswana Demographics 2001 Central Statistics Office (Botswana), Census and Demographic Statistics for the year 2001.