Demographics of Vietnam
| Demographics of Vietnam[1] | |
|---|---|
| Population | 96,160,163 (on July, 2017) |
| Growth rate | 0.93% (2017 est.) |
| Birth rate | 15.5 births/1000 population (2017 est.) |
| Death rate | 5.9 deaths/1000 population (2017 est.) |
| Life expectancy | 73.7 years (2017 est.) |
| • male | 71.2 years (2017 est.) |
| • female | 76.4 years (2017 est.) |
| Fertility rate | 1.81 births/woman (2017 est.) |
| Infant mortality rate | 17.3 deaths/1000 live births (2017 est.) |
| Age structure | |
| 0–14 years | 23.55% (male 11,909,326/female 10,735,324) (2017 est.) |
| 15–64 years | 70.33% (2017 est.) |
| 65 and over | 6.12% (male 2,281,923/female 3,601,075) (2017 est.) |
| Sex ratio | |
| At birth | 1.122 male(s)/female |
| Under 15 | 1.1 male(s)/female |
| 15–64 years | 1 male (s)/female |
| 65 and over | 0.62 male(s)/female |
| Nationality | |
| Nationality | noun: Vietnamese (singular and plural) adjective: Vietnamese |
| Major ethnic | Kinh (Viet) (85.7%) |
| Minor ethnic | Tay (1.9%), Thai (1.8%), Muong (1.5%), Khmer (1.5%), Mong (1.2%), Nung (1.1%), others (5.3%) |
| Language | |
| Official | Vietnamese language |
| Spoken | Vietnamese and many minority and mountain area languages |
This article is about the demographic features of the population of Vietnam, including population density, ethnicity, education level, health of the populace, economic status, religious affiliations and other aspects of the population.
Originating in northern Vietnam, the Vietnamese people pushed southward over two millennia to occupy the entire eastern seacoast of the Indochinese Peninsula. Ethnic Vietnamese, or Viet (known officially as Kinh), live in the lowlands and speak the Vietnamese language. This group dominates much of the cultural and political landscape of Vietnam.
Population
UN estimates[2]
| Total population (000's) | Population aged 0–14 (%) | Population aged 15–64 (%) | Population aged 65+ (%) | |
|---|---|---|---|---|
| 1950 | 28 000 | 31.9 | 63.9 | 4.2 |
| 1955 | 31 329 | 35.6 | 60.1 | 4.3 |
| 1960 | 35 173 | 40.1 | 55.5 | 4.4 |
| 1965 | 39 885 | 44.1 | 51.3 | 4.6 |
| 1970 | 44 928 | 44.2 | 50.9 | 4.8 |
| 1975 | 49 896 | 42.9 | 52.3 | 4.8 |
| 1980 | 54 023 | 40.7 | 54.3 | 4.9 |
| 1985 | 60 307 | 39.4 | 55.7 | 4.9 |
| 1990 | 67 102 | 38.0 | 57.0 | 5.0 |
| 1995 | 74 008 | 36.5 | 58.4 | 5.1 |
| 2000 | 78 758 | 32.1 | 62.3 | 5.6 |
| 2005 | 83 161 | 27.3 | 66.8 | 5.9 |
| 2010 | 87 100 | 23.8 | 69.4 | 6.8 |
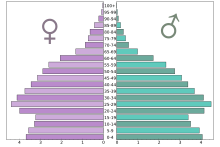
Population pyramids[3]
Census (01/04/2009) :
| Age group | Male | Female | Total | % |
|---|---|---|---|---|
| Total | 42 413 143 | 43 433 854 | 85 846 997 | 100 |
| 0-4 | 3 662 889 | 3 371 255 | 7 034 144 | 7.97 |
| 5-9 | 3 458 159 | 3 252 578 | 6 710 737 | 7.82 |
| 10-14 | 3 725 369 | 3 523 009 | 7 248 378 | 8.44 |
| 15-19 | 4 577 914 | 4 385 988 | 8 963 902 | 10.44 |
| 20-24 | 4 253 618 | 4 179 249 | 8 432 867 | 9.82 |
| 25-29 | 3 904 730 | 3 885 273 | 7 790 003 | 9.07 |
| 30-34 | 3 462 905 | 3 405 253 | 6 868 158 | 8.00 |
| 35-39 | 3 298 266 | 3 233 341 | 6 531 607 | 7.61 |
| 40-44 | 2 967 934 | 2 998 922 | 5 966 856 | 6.95 |
| 45-49 | 2 642 466 | 2 808 462 | 5 450 928 | 6.35 |
| 50-54 | 2 082 098 | 2 329 953 | 4 412 051 | 5.14 |
| 55-59 | 1 364 319 | 1 620 300 | 2 984 619 | 3.48 |
| 60-64 | 861 897 | 1 076 051 | 1 937 948 | 2.26 |
| 65-69 | 653 287 | 901 391 | 1 554 678 | 1.81 |
| 70-74 | 568 312 | 844 226 | 1 412 538 | 1.65 |
| 75-79 | 480 088 | 718 805 | 1 198 893 | 1.40 |
| 80-84 | 264 997 | 460 988 | 725 985 | 0.85 |
| 85+ | 183 895 | 438 810 | 622 705 | 0.73 |
| Age group | Male | Female | Total | Percent |
|---|---|---|---|---|
| 0-14 | 10 846 417 | 10 146 842 | 20 993 259 | 24.45 |
| 15-64 | 29 416 147 | 29 922 792 | 59 338 939 | 69.12 |
| 65+ | 2 150 579 | 3 364 220 | 5 514 799 | 6.42 |
Estimates (01/07/2014) :
| Age group | Male | Female | Total | % |
|---|---|---|---|---|
| Total | 44 758 132 | 45 970 809 | 90 728 941 | 100 |
| 0-4 | 3 806 055 | 3 423 520 | 7 229 575 | 7.97 |
| 5-9 | 3 730 617 | 3 431 843 | 7 162 460 | 7.89 |
| 10-14 | 3 555 440 | 3 344 659 | 6 900 099 | 7.61 |
| 15-19 | 3 580 322 | 3 413 183 | 6 993 505 | 7.71 |
| 20-24 | 4 058 691 | 3 959 579 | 8 018 270 | 8.84 |
| 25-29 | 3 951 220 | 3 888 697 | 7 839 917 | 8.64 |
| 30-34 | 3 689 395 | 3 769 601 | 7 458 996 | 8.22 |
| 35-39 | 3 390 462 | 3 439 787 | 6 830 249 | 7.53 |
| 40-44 | 3 292 933 | 3 295 012 | 6 587 945 | 7.26 |
| 45-49 | 2 980 442 | 3 068 389 | 6 048 831 | 6.67 |
| 50-54 | 2 699 165 | 2 971 459 | 5 670 624 | 6.25 |
| 55-59 | 2 096 032 | 2 405 568 | 4 501 600 | 4.96 |
| 60-64 | 1 376 861 | 1 671 621 | 3 048 482 | 3.36 |
| 65-69 | 832 090 | 1 084 870 | 1 916 960 | 2.11 |
| 70-74 | 600 732 | 862 104 | 1 462 836 | 1.61 |
| 75-79 | 477 293 | 757 242 | 1 234 535 | 1.36 |
| 80+ | 640 382 | 1 183 675 | 1 824 057 | 2.01 |
| Age group | Male | Female | Total | Percent |
|---|---|---|---|---|
| 0-14 | 11 092 112 | 10 200 022 | 21 292 134 | 23.47 |
| 15-64 | 31 115 523 | 31 882 896 | 62 998 419 | 69.44 |
| 65+ | 2 550 497 | 3 887 891 | 6 438 388 | 7.10 |
Vital statistics
UN estimates of births and deaths[2]
| Period | Live births per year | Deaths per year | Natural change per year | CBR1 | CDR1 | NC1 | TFR1 | IMR1 |
|---|---|---|---|---|---|---|---|---|
| 1950-1955 | 1 335 000 | 722 000 | 613 000 | 44.8 | 24.2 | 20.6 | 6.20 | 157.9 |
| 1955-1960 | 1 533 000 | 764 000 | 769 000 | 46.1 | 23.0 | 23.1 | 6.76 | 143.7 |
| 1960-1965 | 1 732 000 | 790 000 | 942 000 | 46.2 | 21.0 | 25.2 | 7.33 | 130.3 |
| 1965-1970 | 1 798 000 | 790 000 | 1 009 000 | 42.4 | 18.6 | 23.8 | 7.38 | 117.8 |
| 1970-1975 | 1 853 000 | 859 000 | 994 000 | 39.1 | 18.1 | 21.0 | 7.15 | 118.4 |
| 1975-1980 | 1 797 000 | 760 000 | 1 036 000 | 34.6 | 14.6 | 20.0 | 5.89 | 97.6 |
| 1980-1985 | 1 952 000 | 630 000 | 1 322 000 | 34.1 | 11.0 | 23.1 | 4.93 | 70.0 |
| 1985-1990 | 2 000 000 | 574 000 | 1 425 000 | 31.4 | 9.0 | 22.4 | 3.96 | 54.8 |
| 1990-1995 | 1 929 000 | 484 000 | 1 444 000 | 27.3 | 6.9 | 20.4 | 3.23 | 37.9 |
| 1995-2000 | 1 448 000 | 441 000 | 1 007 000 | 19.0 | 5.8 | 13.2 | 2.18 | 29.2 |
| 2000-2005 | 1 392 000 | 425 000 | 967 000 | 17.2 | 5.3 | 11.9 | 1.93 | 23.1 |
| 2005-2010 | 1 472 000 | 448 000 | 1 024 000 | 17.2 | 5.2 | 12.0 | 1.89 | 20.4 |
| 1 CBR = crude birth rate (per 1000); CDR = crude death rate (per 1000); NC = natural change (per 1000); TFR = total fertility rate (number of children per woman); IMR = infant mortality rate per 1000 births | ||||||||
| Historical populations | ||
|---|---|---|
| Year | Pop. | ±% |
| 1950 | 28,264,000 | — |
| 1960 | 35,173,000 | +24.4% |
| 1970 | 44,928,000 | +27.7% |
| 1980 | 54,023,000 | +20.2% |
| 1990 | 67,102,000 | +24.2% |
| 2000 | 78,758,000 | +17.4% |
| 2010 | 87,100,000 | +10.6% |
| 2017 | 96,160,163 | +10.4% |
| Source:https://www.cia.gov/library/publications/the-world-factbook/geos/vm.html | ||
Birth, death and fertility rates
The total fertility rate of Vietnam has been influenced by the government's family planning policy, the two-child policy.
| Average population (x 1000) | Live births | Deaths | Natural change | Crude birth rate (per 1000) | Crude death rate (per 1000) | Natural change (per 1000) | Total fertility rate (children per woman) | |
|---|---|---|---|---|---|---|---|---|
| 2001 | 78 620.5 | 18.6 | 5.1 | 13.5 | 2.25 | |||
| 2002 | 79 537.7 | 19.0 | 5.8 | 13.2 | 2.28 | |||
| 2003 | 80 467.4 | 17.5 | 5.8 | 11.7 | 2.12 | |||
| 2004 | 81 436.4 | 19.2 | 5.4 | 13.8 | 2.23 | |||
| 2005 | 82.392,1 | 18.6 | 5.3 | 13.3 | 2.11 | |||
| 2006 | 83 311.2 | 17.4 | 5.3 | 12.1 | 2.09 | |||
| 2007 | 84.218,5 | 16.9 | 5.3 | 11.6 | 2.07 | |||
| 2008 | 85 118.7 | 16.7 | 5.3 | 11.4 | 2.08 | |||
| 2009 | 86 025.0 | 17.6 | 6.8 | 10.8 | 2.03 | |||
| 2010 | 86 932.5 | 17.1 | 6.8 | 10.3 | 2.00 | |||
| 2011 | 87 840.0 | 1 443.0 | 599.8 | 843.2 | 16.6 | 6.9 | 9.7 | 1.99 |
| 2012 | 88 772.9 | 1 484.5 | 621.4 | 863.1 | 16.9 | 7.0 | 9.9 | 2.05 |
| 2013 | 89 759.5 | 1 513.5 | 621.4 | 892.1 | 17.0 | 7.1 | 9.9 | 2.10 |
| 2014 | 90 728.9 | 1 525.9 | 619.3 | 906.6 | 17.2 | 6.9 | 10.3 | 2.09 |
| 2015 | 91 709.8 | 16.2 | 6.8 | 9.4 | 2.10 | |||
| 2016 | 92 695.1 | 15.96 | 6.83 | 9.13 | 2.09 | |||
- preliminary
Fertility rate by region and province
| Province | 2005 | 2007 | 2008 | 2009 | 2010 | 2011[6] |
|---|---|---|---|---|---|---|
| Vietnam | 2.11 | 2.07 | 2.08 | 2.03 | 2.00 | 1.99 |
| Red River Delta | 2.06 | 2.11 | 2.13 | 2.11 | 2.04 | 2.06 |
| Hà Nội | 1.83 | 1.91 | 2.06 | 2.08 | 2.00 | 2.02 |
| Hà Tây | 2.29 | 2.23 | ||||
| Vĩnh Phúc | 2.15 | 2.00 | 2.10 | 2.13 | 2.06 | 2.02 |
| Bắc Ninh | 2.40 | 2.28 | 2.29 | 2.32 | 2.26 | 2.23 |
| Quảng Ninh | 2.24 | 2.12 | 2.12 | 2.20 | 1.99 | 2.07 |
| Hải Dương | 2.10 | 2.04 | 2.13 | 1.99 | 1.98 | 2.01 |
| Hải Phòng | 2.13 | 1.86 | 1.95 | 2.16 | 1.98 | 2.00 |
| Hưng Yên | 2.32 | 2.08 | 2.25 | 2.11 | 2.13 | 2.19 |
| Thái Bình | 2.19 | 2.21 | 2.14 | 2.08 | 2.10 | 2.15 |
| Hà Nam | 2.30 | 2.18 | 2.12 | 2.07 | 2.09 | 2.16 |
| Nam Định | 2.31 | 2.39 | 2.19 | 2.25 | 2.20 | 2.24 |
| Ninh Bình | 2.37 | 2.26 | 2.36 | 2.04 | 1.88 | 1.86 |
| Northern midlands and mountain areas | 2.33 | 2.23 | 2.30 | 2.24 | 2.22 | 2.21 |
| Hà Giang | 3.06 | 2.89 | 2.86 | 3.08 | 3.05 | 2.57 |
| Cao Bằng | 2.55 | 2.28 | 2.26 | 2.18 | 2.09 | 2.15 |
| Bắc Kạn | 2.29 | 2.12 | 2.07 | 1.84 | 1.85 | 1.91 |
| Tuyên Quang | 2.17 | 2.05 | 2.05 | 2.10 | 2.07 | 2.10 |
| Lào Cai | 2.97 | 2.59 | 2.69 | 2.70 | 2.73 | 2.57 |
| Yên Bái | 2.55 | 2.36 | 2.56 | 2.38 | 2.32 | 2.26 |
| Thái Nguyên | 1.99 | 1.99 | 1.95 | 1.89 | 1.90 | 1.96 |
| Lạng Sơn | 2.28 | 2.14 | 2.15 | 1.86 | 1.84 | 1.88 |
| Bắc Giang | 2.21 | 2.07 | 2.22 | 1.94 | 1.86 | 1.94 |
| Phú Thọ | 2.03 | 1.99 | 2.11 | 2.10 | 2.08 | 2.22 |
| Điện Biên | 3.17 | 2.72 | 2.72 | 2.55 | 2.57 | 2.67 |
| Lai Châu | 3.52 | 3.02 | 3.01 | 2.96 | 2.91 | 2.93 |
| Sơn La | 2.76 | 2.36 | 2.29 | 2.61 | 2.58 | 2.43 |
| Hòa Bình | 2.09 | 2.06 | 2.01 | 1.98 | 1.98 | 2.03 |
| North Central and Central coastal areas | 2.37 | 2.27 | 2.30 | 2.21 | 2.21 | 2.21 |
| Thanh Hóa | 2.39 | 2.12 | 2.17 | 1.89 | 1.89 | 2.01 |
| Nghệ An | 2.75 | 2.49 | 2.52 | 2.55 | 2.56 | 2.49 |
| Hà Tĩnh | 2.38 | 2.46 | 2.65 | 2.46 | 2.46 | 2.50 |
| Quảng Bình | 2.58 | 2.57 | 2.57 | 2.37 | 2.39 | 2.41 |
| Quảng Trị | 2.90 | 2.77 | 2.71 | 2.85 | 2.84 | 2.67 |
| Thừa Thiên - Huế | 2.98 | 2.79 | 2.54 | 2.26 | 2.28 | 2.22 |
| Đà Nẵng | 1.87 | 1.90 | 1.92 | 2.14 | 2.16 | 1.99 |
| Quảng Nam | 2.40 | 2.32 | 2.12 | 2.30 | 2.27 | 2.16 |
| Quảng Ngãi | 2.21 | 2.11 | 2.18 | 2.09 | 2.11 | 2.21 |
| Bình Định | 2.25 | 2.17 | 2.09 | 2.22 | 2.17 | 2.28 |
| Phú Yên | 2.25 | 2.18 | 2.32 | 1.96 | 1.98 | 2.11 |
| Khánh Hòa | 2.12 | 2.14 | 2.18 | 2.04 | 2.06 | 1.93 |
| Ninh Thuận | 2.53 | 2.28 | 2.24 | 2.40 | 2.42 | 2.38 |
| Bình Thuận | 2.38 | 2.40 | 2.38 | 2.07 | 2.09 | 2.14 |
| Central Highlands | 3.07 | 2.77 | 2.68 | 2.65 | 2.63 | 2.58 |
| Kon Tum | 3.94 | 3.49 | 3.58 | 3.45 | 3.46 | 3.25 |
| Gia Lai | 3.10 | 2.97 | 2.86 | 2.88 | 2.90 | 2.85 |
| Đắk Lắk | 2.98 | 2.84 | 2.57 | 2.45 | 2.47 | 2.42 |
| Đắk Nông | 3.38 | 3.05 | 2.87 | 2.72 | 2.68 | 2.57 |
| Lâm Đồng | 2.67 | 2.37 | 2.31 | 2.43 | 2.28 | 2.32 |
| South East | 1.85 | 1.74 | 1.73 | 1.69 | 1.68 | 1.59 |
| Bình Phước | 2.61 | 2.47 | 2.38 | 2.45 | 2.43 | 2.31 |
| Tây Ninh | 1.98 | 1.89 | 1.79 | 1.79 | 1.77 | 1.80 |
| Bình Dương | 1.66 | 1.74 | 1.85 | 1.70 | 1.72 | 1.76 |
| Đồng Nai | 1.92 | 1.91 | 1.83 | 2.07 | 2.09 | 1.99 |
| Bà Rịa - Vũng Tàu | 2.06 | 2.09 | 2.13 | 2.01 | 1.88 | 1.82 |
| TP. Hồ Chí Minh | 1.52 | 1.49 | 1.63 | 1.45 | 1.45 | 1.30 |
| Mekong River Delta | 2.00 | 1.87 | 1.87 | 1.84 | 1.80 | 1.80 |
| Long An | 1.95 | 1.91 | 1.95 | 1.85 | 1.87 | 1.83 |
| Tiền Giang | 2.02 | 1.98 | 1.97 | 1.94 | 1.93 | 1.92 |
| Bến Tre | 1.76 | 1.70 | 1.71 | 1.81 | 1.79 | 1.71 |
| Trà Vinh | 2.03 | 1.89 | 1.79 | 1.86 | 1.80 | 1.80 |
| Vĩnh Long | 1.83 | 1.76 | 1.75 | 1.63 | 1.65 | 1.63 |
| Đồng Tháp | 1.98 | 1.77 | 1.74 | 1.87 | 1.89 | 1.83 |
| An Giang | 2.00 | 1.86 | 1.86 | 1.97 | 1.97 | 1.92 |
| Kiên Giang | 2.22 | 2.10 | 2.09 | 1.84 | 1.80 | 1.86 |
| Cần Thơ | 1.70 | 1.64 | 1.75 | 1.72 | 1.62 | 1.62 |
| Hậu Giang | 1.95 | 1.94 | 1.89 | 1.96 | 1.75 | 1.77 |
| Sóc Trăng | 2.02 | 1.90 | 2.06 | 1.79 | 1.81 | 1.83 |
| Bạc Liêu | 2.11 | 2.10 | 2.00 | 1.75 | 1.59 | 1.69 |
| Cà Mau | 2.10 | 2.00 | 2.01 | 1.75 | 1.64 | 1.73 |
Source: General Statistics Office of Vietnam.[7]
Ethnic groups
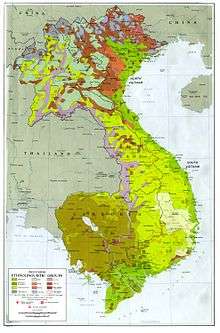
The Vietnamese government recognizes 54 ethnic groups, of which the Viet (Kinh) is the largest; according to official Vietnamese figures (2009 census), ethnic Vietnamese account for 85.7% of the nation's population and the non-Vietnamese ethnic groups account for the remaining percent. The ethnic Vietnamese inhabit a little less than half of Vietnam, while the ethnic minorities inhabit the majority of Vietnam's land (albeit the least fertile parts of the country).
The Khmer Krom are found in the delta of the Mekong River, in the south of Vietnam, where they form in many areas the majority of the rural population. They live in an area which was previously part of Cambodia and which Vietnam conquered in the 17th and 18th centuries. Official Vietnamese figures put the Khmer Krom at 1 million people. Vietnam's approximately 1 million ethnic Chinese, constitute one of Vietnam's largest minority groups. Long important in the Vietnamese economy, Vietnamese of Chinese ancestry have been active in rice trading, milling, real estate, and banking in the south and shopkeeping, stevedoring, and mining in the north. Restrictions on economic activity following reunification in 1975 and the subsequent but unrelated general deterioration in Vietnamese-Chinese relations sent chills through the Chinese-Vietnamese community.
The relation between China and Vietnam also declined in this period, with Vietnam siding with the Soviet Union against China in the Chinese-Soviet split. Tensions peaked when Vietnam invaded Cambodia, an ally of China, to depose Pol Pot, resulting in a Chinese invasion of Vietnam in 1979. In 1978-79, some 450,000 ethnic Chinese left Vietnam by boat as refugees (many officially encouraged and assisted) or were expelled across the land border with China. In recent years the government has performed an about turn and is encouraging overseas Hoa to return and invest, but the ethnic Chinese population has been in continuous decline since the 1970s due to assimilation and low birth rates.
The central highland peoples commonly termed Degar or Montagnards (mountain people) comprise two main ethnolinguistic groups--Malayo-Polynesian and Mon–Khmer. About 30 groups of various cultures and dialects are spread over the highland territory.
Other minority groups include the Cham—remnants of the once-mighty Champa Kingdom, conquered by the Vietnamese in the 15th century, Hmong, and Tai ("Thái").
| Ethnic group |
Language family |
census 1989[8] | census 1999[9] | census 2009[10] | census 2014[11] | ||||
|---|---|---|---|---|---|---|---|---|---|
| Number | % | Number | % | Number | % | ||||
| Kinh | Vietic | 56,101,583 | 87.1 | 65,795,748 | 86.2 | 73,594,427 | 85.7 | ||
| Tày | Tai-Kadai | 1,145,235 | 1.8 | 1,477,514 | 1.9 | 1,626,392 | 1.9 | ||
| Thai | Tai-Kadai | 992,809 | 1.5 | 1,328,725 | 1.7 | 1,550,423 | 1.8 | ||
| Mường | Vietic | 874,195 | 1.4 | 1,137,515 | 1.5 | 1,268,963 | 1.5 | ||
| Khmer | Mon-Khmer | 872,382 | 1.4 | 1,055,174 | 1.4 | 1,260,640 | 1.5 | ||
| Mong | Hmong-Dao | 787,604 | 1.0 | 1,068,189 | 1.2 | ||||
| Nùng | Tai-Kadai | 696,305 | 1.1 | 856,412 | 1.1 | 968,800 | 1.1 | ||
| Hoa | Chinese | 961,702 | 1.5 | 862,371 | 1.1 | 823,071 | 1.0 | ||
| Dao | Hmong-Dao | 620,538 | 0.81 | 751,067 | 0.87 | ||||
| Gia Rai | Malayo-Polynesian | 317,557 | 0.42 | 411,275 | 0.48 | ||||
| Ê Đê | Malayo-Polynesian | 270,348 | 0.35 | 331,194 | 0.39 | ||||
| Ba Na | Mon-Khmer | 174,456 | 0.23 | 227,716 | 0.27 | ||||
| Xơ Đăng | Mon-Khmer | 127,148 | 0.17 | 169,501 | 0.20 | ||||
| Sán Chay | Tai-Kadai | 147,315 | 0.19 | 169,410 | 0.20 | ||||
| Cờ Ho | Mon-Khmer | 128,723 | 0.17 | 166,112 | 0.19 | ||||
| Chăm | Malayo-Polynesian | 132,873 | 0.17 | 161,729 | 0.19 | ||||
| Sán Dìu | Chinese | 126,237 | 0.17 | 146,821 | 0.17 | ||||
| Ra Glai | Malayo-Polynesian | 96,931 | 0.13 | 122,245 | 0.14 | ||||
| M'Nông | Mon-Khmer | 92,451 | 0.12 | 102,741 | 0.12 | ||||
| Xtiêng | Mon-Khmer | 66,788 | 0.09 | 85,436 | 0.10 | ||||
| Bru-Vân Kiều | Mon-Khmer | 55,559 | 0.07 | 74,506 | 0.09 | ||||
| Thổ | Vietic | 68,394 | 0.09 | 74,458 | 0.09 | ||||
| Khơ Mú | Mon-Khmer | 56,542 | 0.07 | 72,929 | 0.08 | ||||
| Hrê | Mon-Khmer | 113,111 | 0.15 | 63,012 | 0.07 | ||||
| Cơ Tu | Mon-Khmer | 50,458 | 0.07 | 61,588 | 0.07 | ||||
| Giáy | Tai-Kadai | 49,098 | 0.06 | 58,617 | 0.07 | ||||
| Giẻ Triêng | Mon-Khmer | 30,243 | 0.04 | 50,962 | 0.06 | ||||
| Tà Ôi | Mon-Khmer | 34,960 | 0.05 | 43,886 | 0.05 | ||||
| Mạ | Mon-Khmer | 33,338 | 0.04 | 41,405 | 0.05 | ||||
| Co | Mon-Khmer | 27,766 | 0.04 | 33,817 | 0.04 | ||||
| Chơ Ro | Mon-Khmer | 22,567 | 0.03 | 26,855 | 0.03 | ||||
| Xinh Mun | Mon-Khmer | 18,018 | 0.02 | 23,278 | 0.03 | ||||
| Chu Ru | Malayo-Polynesian | 14,978 | 0.02 | 19,314 | 0.02 | ||||
| Lao | Tai-Kadai | 11,611 | 0.02 | 14,928 | 0.02 | ||||
| Kháng | Mon-Khmer | 10,272 | 0.01 | 13,840 | 0.02 | ||||
| La Chí | Tai-Kadai | 10,765 | 0.01 | 13,158 | 0.02 | ||||
| Hà Nhì | Tibeto-Burman | 17,535 | 0.02 | 10,923 | 0.01 | ||||
| La Hủ | Tibeto-Burman | 6,874 | 0.01 | 9,651 | 0.01 | ||||
| La Ha | Tai-Kadai | 5,686 | 0.01 | 8,177 | 0.01 | ||||
| Pà Thẻn | Hmong-Dao | 5,569 | 0.01 | 6,811 | 0.01 | ||||
| Chứt | Vietic | 3,829 | 0.01 | 6,022 | 0.01 | ||||
| Lự | Tai-Kadai | 4,964 | 0.01 | 5,601 | 0.01 | ||||
| Phù Lá | Tibeto-Burman | 9,046 | 0.01 | 5,535 | 0.01 | ||||
| Mảng | Mon-Khmer | 2,663 | 0.00 | 3,700 | 0.00 | ||||
| Cờ Lao | Tai-Kadai | 1,865 | 0.00 | 2,636 | 0.00 | ||||
| Bố Y | Tai-Kadai | 1,864 | 0.00 | 2,273 | 0.00 | ||||
| Lô Lô | Tibeto-Burman | 3,307 | 0.00 | 2,218 | 0.00 | ||||
| Cống | Tibeto-Burman | 1,676 | 0.00 | 2,029 | 0.00 | ||||
| Ngái | Chinese | 4,841 | 0.01 | 1,035 | 0.00 | ||||
| Si La | Tibeto-Burman | 840 | 0.00 | 709 | 0.00 | ||||
| Pu Péo | Tai-Kadai | 705 | 0.00 | 687 | 0.00 | ||||
| Rơ Măm | Mon-Khmer | 352 | 0.00 | 436 | 0.00 | ||||
| Brâu | Mon-Khmer | 313 | 0.00 | 397 | 0.00 | ||||
| Ơ Đu | Mon-Khmer | 301 | 0.00 | 376 | 0.00 | ||||
| Foreigners | 39,532 | 0.05 | 2,134 | 0.00 | |||||
| Others | 2,767,512 | 4.3 | 1,333 | 0.0 | 82,942 | 0.0 | |||
| Total | 64,411,713 | 76,323,173 | 85,846,997 | 90,493,352 | |||||
Language
Vietnamese is the official language of the country. It belongs to the Austroasiatic language family, which also includes languages such as Khmer and Mon. Vietnamese was spoken by 85-90 million people in Vietnam at the 1999 census. In the early 21st century, around another four million Vietnamese speakers are found outside of Vietnam. Thus Vietnamese is the most spoken language of the Austroasiatic family, being spoken by three times more people than the second most spoken language of the family, Khmer. Both languages, however, are extremely different: Vietnamese is a tonal, monosyllabic, phonetic language while Khmer has remained non-tonal. Vietnamese was heavily influenced by Chinese and a small part of the Vietnamese vocabulary is Chinese, while Khmer was heavily influenced by Sanskrit and Pali and a great part of its vocabulary is now made up of Indian words, so that both languages look very dissimilar on the surface. Since the early 20th century, the Vietnamese have used a Romanized script introduced by the French. (See Vietnamese language and Vietnamese alphabet).
Religions
Only a small fraction of the Vietnamese adheres to institutional religions, according to the 2009 official census.[12]
- Vietnamese Folk Religion, 34.7%
- Buddhism, 57.5%
- Christianity, 6.2%
- Roman Catholic, 5.7%
- Protestant, 0.5%
- Hòa Hảo, 1.5%
- Cao Đài, 1.1%
Estimates for the year 2010 published by the Pew Research Center:[13]
- Vietnamese folk religion, 34.0%
- Buddhism, 59.2%
- Christianity, 6.8%
CIA World Factbook demographic statistics
The following demographic statistics are from the CIA World Factbook, unless otherwise indicated.
Sex ratio
- at birth: 1.07 male(s)/female
- under 15 years: 1.08 male(s)/female
- 15–64 years: 0.98 male(s)/female
- 65 years and over: 0.63 male(s)/female
- total population: 0.98 male(s)/female
(2008 est.)
Life expectancy
| Period | Life expectancy in Years |
Period | Life expectancy in Years |
|---|---|---|---|
| 1950–1955 | 53.5 | 1985–1990 | 69.8 |
| 1955–1960 | 57.3 | 1990–1995 | 71.2 |
| 1960–1965 | 60.5 | 1995–2000 | 72.7 |
| 1965–1970 | 62.3 | 2000–2005 | 73.8 |
| 1970–1975 | 57.8 | 2005–2010 | 74.7 |
| 1975–1980 | 66.1 | 2010–2015 | 75.6 |
| 1980–1985 | 68.1 |
Source: UN World Population Prospects[14]
Literacy
- definition: age 15 and over can read and write
- total population: 95.6% (2014 census)
- male: 96.9%
- female: 91.9% (2012)
See also
Sources
References
- ↑ , 28 December 2015.
- 1 2 Population Division of the Department of Economic and Social Affairs of the United Nations Secretariat, World Population Prospects: The 2010 Revision Archived May 6, 2011, at the Wayback Machine.
- ↑ "Demographic Yearbook". UN Data. United Nations. Retrieved 4 December 2015.
- ↑ General Statistics Office of Vietnam: Population and employment
- ↑ Socio-economic situation in 2013
- ↑ Preliminary
- ↑ Total fertility rate by province
- ↑ United Nations 1993 Demographic Yearbook
- ↑ 1999 Population and Housing Census Vietnam
- ↑ 2009 Vietnam Population and Housing Census
- ↑ VN population reaches 90.4 million, with 7.95 million in HCM City
- ↑ Vietnam 2009 Census Results Archived October 18, 2013, at the Wayback Machine.
- ↑ Pew Research Center: Religious Composition by Country.
- ↑ "World Population Prospects – Population Division – United Nations". Retrieved 2017-07-15.
| History | |||||||||||||
|---|---|---|---|---|---|---|---|---|---|---|---|---|---|
| Geography | |||||||||||||
| Politics |
| ||||||||||||
| Economy |
| ||||||||||||
| Society |
| ||||||||||||