Demographics of Togo
The demographics of Togo include ethnicity, population density, age, education level, health, economic status and religious affiliation.
Language and ethnicity
Togo's population of 7.61 million people (2016 est.) is composed of about 21 ethnic groups, the two biggest being the Ewe in the South (about 21% of the population) and the Kabye in the North (12% of the population). Dagomba is the second most common language in the north, where other Gur languages such as Mossi and Gourma are also found.
The ethnic groups of the coastal region, particularly Ewe and Gen language (or Mina) (the two major African languages in the south), constitute the bulk of the civil servants, professionals, and merchants, due in part to the former colonial administrations which provided greater infrastructure development in the south. Most of the southern peoples use these two closely related languages, which are spoken in commercial sectors throughout Togo.
The Kabye live on marginal land and traditionally have emigrated south from their home area in the Kara region to seek employment. Their historical means of social advancement has been through the military and law enforcement forces, and they continue to dominate these services.
Other groups include the Akposso on the Central Plateau, the Ana people who are related to the Yoruba, and live in the center of the country, in the strip between Atakpame and Tchamba, the Bassar in the Centre-West, the Cotocoli, the Tchamba and the Komkombas around Sokodé, the Lambas in the Kandé region, the Hausa, the Tamberma, the Losso and the Ouachi.
White African settlers descended from the original French and German colonials make up less than 1% of the total population along with Togo's minute Lebanese community. The remaining 99% are indigenous: most people in this category hail from one of thirty-seven different tribes.
Population
Population distribution is very uneven due to soil and terrain variations. The population is generally concentrated in the south and along the major north-south highway connecting the coast to the Sahel. Age distribution is also uneven; nearly one-half of Togolese are less than fifteen years old.
French, the official language, is used in administration and documentation. The public primary schools combine French with Ewe or Kabye as languages of instruction, depending on the region. English is spoken in neighboring Ghana and is taught in Togolese secondary schools. As a result, many Togolese, especially in the south and along the Ghana border, speak some English.
| Census date | Population | Average annual growth (%) |
Population density/km2 |
Proportion urban (%) |
|---|---|---|---|---|
| 1-11-1958 | 1,444,481 | . | 25 | 9.4 |
| 1-3-1970 | 1,950,646 | 2.7 | 34 | 21.2 |
| 22-11-1981 | 2,719,567 | 2.9 | 48 | 25.2 |
| 6-11-2010 | 6,191,155 | 2.9 | 109 | 37.7 |
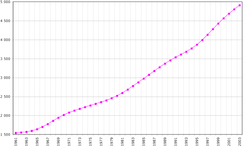
According to the 2017 revision of the World Population Prospects[2] the total population was 7,606,374 in 2016, compared to only 1 395 000 in 1950. The proportion of children below the age of 15 in 2010 was 39.6%, 56.9% was between 15 and 65 years of age, while 3.4% was 65 years or older .[3]
| Total population (x 1000) | Population aged 0–14 (%) | Population aged 15–64 (%) | Population aged 65+ (%) | |
|---|---|---|---|---|
| 1950 | 1 395 | 41.3 | 54.4 | 4.3 |
| 1955 | 1 475 | 41.9 | 54.1 | 3.9 |
| 1960 | 1 578 | 42.6 | 53.8 | 3.6 |
| 1965 | 1 700 | 43.6 | 53.1 | 3.3 |
| 1970 | 2 097 | 44.8 | 52.1 | 3.1 |
| 1975 | 2 380 | 45.9 | 51.1 | 3.1 |
| 1980 | 2 667 | 46.6 | 50.3 | 3.1 |
| 1985 | 3 161 | 46.7 | 50.2 | 3.1 |
| 1990 | 3 666 | 46.0 | 50.9 | 3.1 |
| 1995 | 4 085 | 44.8 | 52.1 | 3.1 |
| 2000 | 4 794 | 43.2 | 53.6 | 3.1 |
| 2005 | 5 408 | 41.5 | 55.2 | 3.3 |
| 2010 | 6 028 | 39.6 | 56.9 | 3.4 |
Vital statistics
Registration of vital events is in Togo not complete. The Population Departement of the United Nations prepared the following estimates. [3]
| Period | Live births per year | Deaths per year | Natural change per year | CBR* | CDR* | NC* | TFR* | IMR* |
|---|---|---|---|---|---|---|---|---|
| 1950-1955 | 68 000 | 43 000 | 25 000 | 47.2 | 29.7 | 17.6 | 6.33 | 191 |
| 1955-1960 | 72 000 | 40 000 | 32 000 | 47.4 | 26.4 | 21.0 | 6.42 | 172 |
| 1960-1965 | 79 000 | 39 000 | 40 000 | 48.0 | 23.6 | 24.4 | 6.65 | 154 |
| 1965-1970 | 92 000 | 40 000 | 52 000 | 48.5 | 21.2 | 27.3 | 6.94 | 138 |
| 1970-1975 | 109 000 | 42 000 | 66 000 | 48.6 | 18.9 | 29.7 | 7.20 | 124 |
| 1975-1980 | 121 000 | 44 000 | 77 000 | 48.0 | 17.3 | 30.7 | 7.28 | 113 |
| 1980-1985 | 135 000 | 46 000 | 89 000 | 46.2 | 15.7 | 30.5 | 7.06 | 105 |
| 1985-1990 | 149 000 | 49 000 | 101 000 | 43.8 | 14.3 | 29.5 | 6.58 | 97 |
| 1990-1995 | 159 000 | 51 000 | 108 000 | 41.1 | 13.1 | 28.0 | 5.99 | 91 |
| 1995-2000 | 171 000 | 55 000 | 116 000 | 38.5 | 12.3 | 26.1 | 5.38 | 84 |
| 2000-2005 | 183 000 | 60 000 | 124 000 | 35.9 | 11.7 | 24.2 | 4.83 | 77 |
| 2005-2010 | 190 000 | 65 000 | 125 000 | 33.2 | 11.3 | 21.9 | 4.30 | 74 |
| * CBR = crude birth rate (per 1000); CDR = crude death rate (per 1000); NC = natural change (per 1000); IMR = infant mortality rate per 1000 births; TFR = total fertility rate (number of children per woman) | ||||||||
Fertility and births
Total Fertility Rate (TFR) (Wanted Fertility Rate) and Crude Birth Rate (CBR):[4] [5]
| Year | CBR (Total) | TFR (Total) | CBR (Urban) | TFR (Urban) | CBR (Rural) | TFR (Rural) |
|---|---|---|---|---|---|---|
| 1998 | 35,5 | 5,2 (4,2) | 27,7 | 3,2 (2,6) | 38,6 | 6,3 (5,2) |
| 2013 | 32,9 | 4,8 (4,1) | 32,2 | 3,7 (3,1) | 33,2 | 5,7 (4,9) |
Fertility data as of 2013-2014 (DHS Program):[6]
| Region | Total fertility rate | Percentage of women age 15-49 currently pregnant | Mean number of children ever born to women age 40-49 |
|---|---|---|---|
| Lomé | 3.5 | 6.2 | 3.7 |
| Maritime (except Lomé) | 5.2 | 9.5 | 5.1 |
| Plateaux | 5.2 | 10.6 | 5.4 |
| Centrale | 5.1 | 7.2 | 5.7 |
| Kara | 5.3 | 9.7 | 6.1 |
| Savanes | 6.0 | 9.3 | 7.3 |
Life expectancy at birth
| Period | Life expectancy in Years[7] |
|---|---|
| 1950–1955 | 35.30 |
| 1955–1960 | |
| 1960–1965 | |
| 1965–1970 | |
| 1970–1975 | |
| 1975–1980 | |
| 1980–1985 | |
| 1985–1990 | |
| 1990–1995 | |
| 1995–2000 | |
| 2000–2005 | |
| 2005–2010 | |
| 2010–2015 |
CIA World Factbook demographic statistics
The following demographic statistics are from the CIA World Factbook, unless otherwise indicated.
Sex ratio
at birth:
1.03 male(s)/female
under 15 years:
1.01 male(s)/female
15-64 years:
0.95 male(s)/female
65 years and over:
0.78 male(s)/female
total population:
0.97 male(s)/female (2000 est.)
Life expectancy at birth
total population:
54.69 years
male:
52.75 years
female:
56.7 years (2000 est.)
HIV Prevalence
Adult infection rate 4.2% (2003)
People living with HIV/Aids 110,000 (2003)
Death rate 10,000 (2003)
Religions
- Christian 29%
- Islam 20%
- Indigenous beliefs 51%
Ethnic groups
Literacy
definition:
age 15 and over can read and write
total population:
51.7%
male:
67%
female:
37% (1995 est.)
References
| Wikimedia Commons has media related to Demographics of Togo. |
- ↑ "INSEED - Statistique Togo". Stat-togo.org. Retrieved 27 August 2017.
- ↑ "World Population Prospects: The 2017 Revision". ESA.UN.org (custom data acquired via website). United Nations Department of Economic and Social Affairs, Population Division. Retrieved 10 September 2017.
- 1 2 Population Division of the Department of Economic and Social Affairs of the United Nations Secretariat, World Population Prospects: The 2010 Revision Archived May 6, 2011, at the Wayback Machine.
- ↑ "TROISIÈME ENQUÊTE DÉMOGRAPHIQUE ET DE SANTÉ (EDST-III 2013-2014)" (PDF). Dhsprogram.com. Retrieved 2017-08-27.
- ↑ "1998 Census" (PDF). Dhsprogram.com. Retrieved 2017-08-27.
- ↑ "TROISIÈME ENQUÊTE DÉMOGRAPHIQUE ET DE SANTÉ (EDST-III 2013-2014)" (PDF). Dhsprogram.com. Retrieved 2017-08-27.
- ↑ "World Population Prospects - Population Division - United Nations". esa.un.org. Retrieved 2018-08-26.
- 1 2 "Africa :: TOGO". CIA The World Factbook. Retrieved 2017-08-27.