Demographics of Jordan
| Demographics of Jordan | |
|---|---|
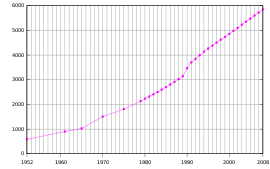 Population of Jordan (1952 - 2008) | |
| Population | 9,531,712 (92th) |
| Growth rate | 2.05% (2017 est.) |
| Birth rate | 23.9 births/1,000 population (2017 est.) |
| Death rate | 3.4 deaths/1,000 population |
| Life expectancy | 74.8 years (2017 est.) |
| • male | 73.4 years |
| • female | 76.3 years |
| Fertility rate | 3.19 children born/woman (2017 est.) |
| Age structure | |
| 0–14 years | 34.68% |
| 15–64 years | 61.87% |
| 65 and over | 3.45% |
| Sex ratio | |
| Total | 1.02 male(s)/female (2016 est.) |
| At birth | 1.06 male(s)/female |
| Under 15 | 1.05 male(s)/female |
| 15–64 years | 1.00 male(s)/female |
| 65 and over | 0.89 male(s)/female |
| Nationality | |
| Nationality | Jordanians |
| Major ethnic | Arab |
| Minor ethnic | Armenians, Circassians |
| Language | |
| Official | Arabic |
| Spoken | English |
Jordanians (Arabic: أردنيون), also known as the Jordanian people (Arabic: الشعب الأردني ALA-LC: al-sha‘ab al-ūrdunī) are the citizens of Jordan, who share a common Levantine Semitic ancestry. Some 98% percent of Jordanians are Arabs, while the remaining 2% are other ethnic minorities.[1]
Jordan has a population of approximately 9,531,712 inhabitants (Female: 47%; Males: 53%) as of 2015. Around 2.9 million were non-citizens, a figure including refugees, legal and illegal immigrants.[2] Jordan's annual population growth rate stood at 2.05% in 2017, with an average of three children per woman. There were 1,977,534 households in Jordan in 2015, with an average of 4.8 persons per household.[2]
The official language is Arabic, while English is the second most widely spoken language by Jordanians. It is also widely used in commerce and government. In 2016, about 84% of Jordan's population live in urban towns and cities.[1] Many Jordanians and people of Jordanian descent live across the world, mainly in the United States, United Arab Emirates, Canada, France, Sweden and Spain.
In 2016, Jordan was named as the largest refugee hosting country per capita in the world, followed by Turkey, Pakistan and Lebanon.[3] The kingdom of Jordan hosts refugees mainly from Palestine, Syria, Iraq and many other countries. There are also hundreds of thousands of workers from Egypt, Indonesia and South Asia, who work as domestic and construction workers.
Definition
The territory of Jordan can be defined by the history of its creation after the end of World War I, the League of Nations and redrawing of the borders of the Eastern Mediterranean littoral. The ensuing decisions, most notably the Sykes–Picot Agreement, which created the Mandatory Palestine. In September 1922, Transjordan was formally identified as a subdivision of the Mandate Palestine after the League of Nations approved the British Transjordan memorandum which stated that the Mandate east of the Jordan River would be excluded from all the provisions dealing with Jewish settlement west of the Jordan River.[4]
Ethnic and religious groups
Arab
Arab Jordanians are descended from prominent families in the historical cities and towns in Transjordan. Most notably in the governorates of Jerash, Ajlun, Balqa, Irbid, Madaba, Al Karak, Aqaba, Amman and some other towns in the country. Most of the native Christian population in the country belongs to this ethnicity or to the Bedouin ethnicity.
Druze
The Druze people are believed to constitute about 0.5% of the total population of Jordan, which is around 32,000.[6] The Druze, who refer to themselves as al-Muwahhideen, or "believers in one God," are concentrated in the rural, mountainous areas west and north of Amman.
Bedouin
The other group of Jordanians is descended from Bedouins (of which, less than 1% live a nomadic lifestyle). Bedouin settlements are concentrated in the wasteland south and east of the country.
Armenians
There were an estimated 5,000 Armenians living within the country in 2009.[7] An estimated 4,500 of these are members of the Armenian Apostolic Church,[7] and predominantly speak the Western dialect[8] of the Armenian language. This population makes up the majority of non-Arab Christians in the country.[9]
Assyrians
There is an Assyrian refugee population in Jordan. Many Assyrians have arrived in Jordan as refugees since the invasion of Iraq, making up a large part of the Iraqi refugees.
Circassians
By the end of the 19th century, the Ottoman Authorities directed the Circassian immigrants to settle in Jordan. The Circassians are Sunni Muslims and are estimated to number 20,000 to 80,000 persons.
Chechens
There are about 10,000 Chechens estimated to reside in Jordan.
Refugees
Jordan is a home to more than 2 million Palestinians refugees by 2015 who came after the 1948 & 1967 wars, and most of them, but not all, were granted Jordanian citizenship.[10] Jordan also hosts around 1.4 million Syrian refugees who fled to the country due to the Syrian Civil War since 2011. About 31,163 Yemenis and 22,700 Libyan refugees live in Jordan as of January 2015.[2] There are thousands of Lebanese refugees who came to Jordan when civil strife and war and the 2006 war broke out in their native country. Up to 1 million Iraqis came to Jordan following the Iraq War in 2003.[11] In 2015, their number was 130,911. About 2,500 Iraqi Mandaean refugees have been resettled in Jordan.
Religion
Health and Education
Jordan prides itself on its health services, some of the best in the region.[12] Qualified medics, favourable investment climate and Jordan's stability have contributed to the success of this sector.[13]
Jordan has a very advanced education system. The school education system comprises 2 years of pre-school education, 10 years of compulsory basic education, and two years of secondary academic or vocational education, after which the students sit for the General Certificate of Secondary Education Exam (Tawjihi).[14] Scholars may attend either private or public schools.
Access to higher education is open to holders of the General Secondary Education Certificate, who can then choose between private Community Colleges, public Community Colleges or universities (public and private). The credit-hour system, which entitles students to select courses according to a study plan, is implemented at universities. The number of public universities has reached (10), besides (17) universities that are private, and (51) community colleges. Numbers of universities accompanied by significant increase in number of students enrolled to study in these universities, where the number of enrolled students in both public and private universities is estimated at nearly (236) thousand; (28) thousand out of the total are from Arab or foreign nationalities.[15]
| Period | Life expectancy in Years |
Period | Life expectancy in Years |
|---|---|---|---|
| 1950–1955 | 46.5 | 1985–1990 | 69.2 |
| 1955–1960 | 50.7 | 1990–1995 | 70.4 |
| 1960–1965 | 54.6 | 1995–2000 | 71.3 |
| 1965–1970 | 58.4 | 2000–2005 | 72.2 |
| 1970–1975 | 61.9 | 2005–2010 | 73.0 |
| 1975–1980 | 64.9 | 2010–2015 | 73.8 |
| 1980–1985 | 67.2 |
Source: UN World Population Prospects[16]
Statistics
| Historical population | ||
|---|---|---|
| Year | Pop. | ±% |
| 1952 | 586,200 | — |
| 1961 | 900,800 | +53.7% |
| 1970 | 1,508,200 | +67.4% |
| 1980 | 2,233,200 | +48.1% |
| 1990 | 3,468,000 | +55.3% |
| 2000 | 4,857,000 | +40.1% |
| 2010 | 6,698,000 | +37.9% |
| 2017 | 10,053,000 | +50.1% |
| Source:[17] [18] | ||
The following demographic statistics are from the CIA World Factbook, unless otherwise indicated.
Total population
10,086,876 (According to the Population Clock as of February 14, 2018).[19]
Gender ratio
- at birth: 1.06 male(s)/female
- 0-14 years: 1.05 male(s)/female
- 15-24 years: 1.05 male(s)/female
- 25-54 years: 1 male(s)/female
- 55-64 years: 0.95 male(s)/female
- 65 years and over: 0.89 male(s)/female
- total population: 1.02 male(s)/female (2016 est.)
Age structure
- 0-14 years: 34.68% (male 1,827,554/female 1,726,691)
- 15-24 years: 20.07% (male 1,103,042/female 953,704)
- 25-54 years: 37.36% (male 2,073,211/female 1,755,290)
- 55-64 years: 4.44% (male 236,435/female 218,469)
- 65 years and over: 3.45% (male 174,470/female 179,203) (2017 est.)
Structure of the population [20]
Structure of the population (01.10.2004) (Census)
| Age Group | Male | Female | Total | % |
|---|---|---|---|---|
| Total | 2 626 287 | 2 477 352 | 5 103 639 | 100 |
| 0-4 | 333 216 | 317 115 | 650 331 | 12,74 |
| 5-9 | 329 133 | 313 738 | 642 871 | 12,60 |
| 10-14 | 313 083 | 297 046 | 610 129 | 11,95 |
| 15-19 | 287 693 | 272 145 | 559 838 | 10,97 |
| 20-24 | 279 600 | 260 593 | 540 193 | 10,58 |
| 25-29 | 239 774 | 216 487 | 456 261 | 8,94 |
| 30-34 | 207 178 | 191 991 | 399 169 | 7,82 |
| 35-39 | 167 737 | 155 689 | 323 426 | 6,34 |
| 40-44 | 123 945 | 117 455 | 241 400 | 4,73 |
| 45-49 | 87 098 | 83 358 | 170 456 | 3,34 |
| 50-54 | 64 607 | 63 633 | 128 240 | 2,51 |
| 55-59 | 55 765 | 57 956 | 113 721 | 2,23 |
| 60-64 | 52 084 | 46 703 | 98 787 | 1,94 |
| 65-69 | 37 095 | 34 728 | 71 823 | 1,41 |
| 70-74 | 23 467 | 23 353 | 46 820 | 0,92 |
| 75-79 | 12 651 | 11 617 | 24 268 | 0,48 |
| 80+ | 10 137 | 11 923 | 22 060 | 0,43 |
| 80-84 | 6 144 | 7 441 | 13 585 | 0,27 |
| 85-89 | 2 444 | 2 588 | 5 032 | 0,10 |
| 90-94 | 1 012 | 1 304 | 2 316 | 0,05 |
| 95-99 | 537 | 590 | 1 127 | 0,02 |
| unknown | 2 024 | 1 822 | 3 846 | 0,08 |
| Age group | Male | Female | Total | Percent |
|---|---|---|---|---|
| 0-14 | 975 432 | 927 899 | 1 903 331 | 37,29 |
| 15-64 | 1 565 481 | 1 466 010 | 3 031 491 | 59,40 |
| 65+ | 83 350 | 81 621 | 164 971 | 3,23 |
Structure of the population (31.12.2013) (Estimates) (Excluding foreigners, including registered Palestinian): refugees. :
| Age Group | Male | Female | Total | % |
|---|---|---|---|---|
| Total | 3 366 000 | 3 174 000 | 6 530 000 | 100 |
| 0-4 | 427 485 | 405 300 | 832 785 | 12,75 |
| 5-9 | 422 095 | 400 880 | 822 975 | 12,60 |
| 10-14 | 401 900 | 379 680 | 781 580 | 11,97 |
| 15-19 | 368 915 | 347 720 | 716 635 | 10,97 |
| 20-24 | 358 485 | 333 170 | 691 655 | 10,59 |
| 25-29 | 307 650 | 276 855 | 584 505 | 8,95 |
| 30-34 | 265 915 | 245 520 | 511 435 | 7,83 |
| 35-39 | 215 425 | 199 015 | 414 440 | 6,35 |
| 40-44 | 158 875 | 149 975 | 308 850 | 4,73 |
| 45-49 | 111 750 | 106 630 | 218 380 | 3,34 |
| 50-54 | 82 805 | 81 320 | 164 125 | 2,51 |
| 55-59 | 71 360 | 74 040 | 145 400 | 2,23 |
| 60-64 | 66 645 | 59 800 | 126 445 | 1,94 |
| 65-69 | 47 485 | 44 280 | 91 765 | 1,41 |
| 70-74 | 30 040 | 29 785 | 59 825 | 0,92 |
| 75-79 | 16 195 | 14 815 | 31 010 | 0,48 |
| 80-84 | 7 865 | 9 495 | 17 360 | 0,27 |
| 85-89 | 3 130 | 3 300 | 6 430 | 0,10 |
| 90-94 | 1 295 | 1 665 | 2 960 | 0,05 |
| 95+ | 685 | 755 | 1 440 | 0,02 |
| Age group | Male | Female | Total | Percent |
|---|---|---|---|---|
| 0-14 | 1 251 480 | 1 185 860 | 2 437 340 | 37,33 |
| 15-64 | 2 007 825 | 1 874 045 | 3 881 870 | 59,45 |
| 65+ | 106 695 | 104 095 | 210 790 | 3,23 |
Median age
- total: 22.5 years
- male: 22.9 years
- female: 22 years (2017 est.)
Population growth rate
- 2.05% (2017 est.)
Birth rate
- 23.9 births/1,000 population (2017 est.)
| Average population
(x 1000) |
Live births | Deaths | Natural change | Crude birth rate (per 1000) | Crude death rate (per 1000) | Natural change (per 1000) | Total fertility rate (TFR) | |
|---|---|---|---|---|---|---|---|---|
| 2001 | 4 918 | 142 956 | 16 164 | 126 792 | 29.1 | 3.3 | 25.8 | |
| 2002 | 5 038 | 146 077 | 17 220 | 128 857 | 29.0 | 3.4 | 25.6 | |
| 2003 | 5 164 | 148 294 | 16 937 | 131 357 | 28.7 | 3.3 | 25.4 | |
| 2004 | 5 414 | 150 248 | 17 011 | 133 237 | 27.8 | 3.1 | 24.6 | |
| 2005 | 5 678 | 152 276 | 17 883 | 134 393 | 26.8 | 3.1 | 23.7 | |
| 2006 | 5 843 | 162 972 | 20 397 | 142 575 | 27.9 | 3.5 | 24.4 | |
| 2007 | 6 017 | 185 011 | 20 924 | 164 087 | 30.7 | 3.5 | 27.3 | 3.6 |
| 2008 | 6 200 | 181 328 | 19 403 | 161 925 | 29.2 | 3.1 | 26.1 | 3.6 |
| 2009 | 6 392 | 179 872 | 20 251 | 159 621 | 28.1 | 3.2 | 25.0 | 3.6 |
| 2010 | 6 594 | 183 948 | 21 550 | 162 398 | 27.9 | 3.3 | 24.6 | 3.8 |
| 2011 | 6 846 | 178 435 | 21 730 | 156 705 | 26.1 | 3.2 | 22.9 | 3.8 |
| 2012 | 7 210 | 177 695 | 22 785 | 154 910 | 24.6 | 3.2 | 21.5 | 3.5 |
| 2013 | 7 771 | 178 143 | 23 898 | 154 245 | 22.9 | 3.1 | 19.9 | 3.5 |
| 2014 | 8 459 | 188 902 | 25 782 | 163 120 | 22.3 | 3.0 | 19.3 | |
| 2015 | 9 182 | 198 018 | 26 640 | 171 378 | 21.6 | 2.9 | 18.7 | |
| 2016 | 9 798 | 197 789 | 27 608 | 170 181 | 20.4 | 2.9 | 17.6 | |
| 2017 | 10 053 | 211 441 | 27 516 | 183 925 | 21.0 | 2.7 | 18.3 | |
Death rate
- 3.4 deaths/1,000 population (2017 est.)
Net migration rate
- 0 migrant(s)/1,000 population (2017 est.)
Urbanization
- urban population: 84.1% of total population (2017)
- rate of urbanization: 1.26% annual rate of change (2015-20 est.)
Maternal mortality rate
- 58 deaths/100,000 live births (2015 est.)
Life expectancy at birth
- total population: 80.18 years
- male: 78.82 years
- female: 81.61 years (2012 est.)
-
- total population: 74.8 years
- male: 73.4 years
- female: 76.3 years (2017 est.)
Total fertility rate
- 3.19 children born/woman (2017 est.)
Fertility Rate (The Demographic Health Survey) [23] Fertility Rate (TFR) (Wanted Fertility Rate) and CBR (Crude Birth Rate):
| Year | CBR (Total) | TFR (Total) | CBR (Urban) | TFR (Urban) | CBR (Rural) | TFR (Rural) |
|---|---|---|---|---|---|---|
| 1976 | 7.4 | |||||
| 1983 | 6.6 | |||||
| 1990 | 36.1 | 5.57 (3.94) | 33.9 | 4.75 (3.36) | 39.0 | 6.85 (4.76) |
| 1997 | 33.1 | 4.35 (2.9) | 32.5 | 4.22 (2.9) | 35.5 | 5.00 (3.1) |
| 2002 | 29.0 | 3.7 (2.6) | 28.4 | 3.5 (2.5) | 31.3 | 4.2 (2.8) |
| 2007 | 28.1 | 3.6 (2.8) | 28.1 | 3.6 (2.8) | 28.2 | 3.7 (2.8) |
| 2009 | 30.6 | 3.8 (3.0) | 30.6 | 3.8 (2.9) | 30.7 | 4.0 (3.1) |
| 2012 | 27.2 | 3.5 (2.4) | 26.7 | 3.4 (2.4) | 29.8 | 3.9 (2.7) |
| 2017-18 | 21.6 | 2.7 | 21.3 | 2.7 | 23.7 | 3.1 |
Health expenditures
- 7.5% of GDP (2014)
Physicians density
- 2.65 physicians/1,000 population (2014)
Hospital bed density
- 1.8 beds/1,000 population (2012)
Obesity - adult prevalence rate
- 35.5% (2016)
Children under the age of 5 years underweight
- 3% (2012)
Literacy rate
15–24 years (in 2015):[24]
- Total: 99.23%
- Male: 99.11%
- Female: 99.37%
15 years and older (in 2015):[24]
- Total: 98.01%
- Male: 98.51%
- Female: 97.49%
UN estimates[25]
| Period | Live births per year | Deaths per year | Natural change per year | CBR1 | CDR1 | NC1 | TFR1 | IMR1 |
|---|---|---|---|---|---|---|---|---|
| 1950–1955 | 26 000 | 11 000 | 15 000 | 47.4 | 19.3 | 28.1 | 7.38 | 160.9 |
| 1955–1960 | 38 000 | 13 000 | 25 000 | 49.4 | 16.5 | 32.9 | 7.38 | 128.9 |
| 1960–1965 | 54 000 | 15 000 | 40 000 | 53.6 | 14.5 | 39.1 | 8.00 | 103.2 |
| 1965–1970 | 73 000 | 16 000 | 57 000 | 52.3 | 11.8 | 40.5 | 8.00 | 82.8 |
| 1970–1975 | 90 000 | 17 000 | 73 000 | 49.0 | 9.4 | 39.6 | 7.79 | 68.3 |
| 1975–1980 | 92 000 | 16 000 | 76 000 | 42.8 | 7.5 | 35.3 | 7.38 | 56.5 |
| 1980–1985 | 101 000 | 17 000 | 85 000 | 39.7 | 6.5 | 33.2 | 7.05 | 44.4 |
| 1985–1990 | 117 000 | 18 000 | 99 000 | 37.5 | 5.7 | 31.8 | 6.44 | 36.0 |
| 1990–1995 | 132 000 | 19 000 | 113 000 | 33.9 | 4.9 | 29.0 | 5.14 | 30.6 |
| 1995–2000 | 147 000 | 21 000 | 127 000 | 32.0 | 4.5 | 27.5 | 4.34 | 26.7 |
| 2000–2005 | 143 000 | 21 000 | 122 000 | 28.1 | 4.2 | 23.9 | 3.60 | 23.6 |
| 2005–2010 | 152 000 | 23 000 | 128 000 | 26.4 | 4.1 | 22.3 | 3.27 | 21.0 |
| 1 CBR = crude birth rate (per 1000); CDR = crude death rate (per 1000); NC = natural change (per 1000); TFR = total fertility rate (number of children per woman); IMR = infant mortality rate per 1000 births | ||||||||
References
- 1 2 "The World Fact book – Jordan". CIA World Factbook. Retrieved 11 December 2016.
- 1 2 3 Ghazal, Mohammad (22 January 2016). "Population stands at around 9.5 million, including 2.9 million guests". The Jordan Times. Retrieved 22 January 2016.
- ↑ "Jordan tops list of refugee-host countries — Amnesty". Jordan Times. 2016-10-04. Retrieved 2018-01-30.
- ↑ "American Jewish Yearbook p.528" (PDF). Retrieved 2010-12-22.
- 1 2 "Middle East :: JORDAN". CIA The World Factbook.
- ↑ International Religious Freedom Report, US State Department, 2005
- 1 2 "Jordan: Religions & Peoples". i-cias.com.
- ↑ "Ethnologue 14 report for language code:ARM". ethnologue.com.
- ↑ "Jordan - history - geography". britannica.com.
- ↑ "Jordan". UNRWA. 1 December 2015. Retrieved 14 June 2016.
- ↑ "Doors closing on fleeing Iraqis". 2007. Retrieved 2018-02-13.
- ↑ "Jordan profile – Overview". BBC. 18 November 2012. Retrieved 11 December 2016.
- ↑ Malkawi, Khetam (30 May 2015). "Sector leaders highlight potential for further growth in medical tourism". The Jordan Times. Retrieved 13 March 2016.
- ↑ "المملكة الاردنية الهاشمية - وزارة التربية و التعليم Ministry of Education - Hashemit Kingdom of Jordan". www.moe.gov.jo. Retrieved 2018-02-13.
- ↑ "Brief on Higher Education Sector in Jordan". www.mohe.gov.jo. Retrieved 2018-02-13.
- ↑ "World Population Prospects – Population Division – United Nations". Retrieved 2017-07-15.
- ↑ "World Population Prospects - Population Division - United Nations". esa.un.org.
- ↑ "Population - Estimated population of 2017 and some of selected data". Department of Statistics. Retrieved 9 August 2018.
- ↑ "Department of Statistics". dosweb.dos.gov.jo. Retrieved 2018-02-14.
- ↑ http://unstats.un.org/unsd/demographic/products/dyb/dyb2.htm
- ↑ "كتاب الاحصائي السنوي 2011". www.dos.gov.jo.
- ↑ "Department of Statistics". dosweb.dos.gov.jo. Retrieved 2018-02-27.
- ↑ "The DHS Program - Quality information to plan, monitor and improve population, health, and nutrition programs". www.dhsprogram.com.
- 1 2 Learning, UNESCO Institute for Lifelong (2017-09-08). "Effective Literacy Programmes". litbase.uil.unesco.org. Retrieved 2018-01-27.
- ↑ "World Population Prospects: The 2010 Revision". un.org.
| Religions | |
|---|---|
| Ethnic groups | |
| Foreign nationals | |