Demographics of Indonesia
The population of Indonesia according to the 2010 national census was 237.64 million,[1] and it was estimated to reach 255.4 million in 2015.[2] 58% live on the island of Java,[1] the world's most populous island.[3]
Despite a fairly effective family planning program that has been in place since 1967,[4] for the decade ending in 2010, Indonesia's population growth was 1.49 percent. At that rate, Indonesia's population is projected to surpass the present population of the United States.[5] Some say family planning should be revitalised based on the 1967 program to avoid Indonesia becoming the world's third most populous country, but this aim has faced a hurdle of religiously-based opinion that to follow family planning is equivalent to not being grateful to God.[6]
Indonesia has a relatively young population compared to Western nations, though it is aging as the country's birth rate has slowed and its life expectancy has increased. Indonesia's median age was 30.2 years in 2017[7]. Indonesia includes numerous ethnic, cultural and linguistic groups, some of which are related to each other. Since independence, Indonesian (a form of Malay and the official national language) is the language of most written communication, education, government, and business. Many local ethnic languages are the first language of most Indonesians and are still important.
Population
| Historical population of Indonesia | ||
|---|---|---|
| Year | Pop. | ±% p.a. |
| 1955 | 77,473,268 | — |
| 1961 | 97,085,348 | +3.83% |
| 1971 | 119,208,229 | +2.07% |
| 1976 | 141,862,419 | +3.54% |
| 1980 | 147,490,298 | +0.98% |
| 1990 | 179,378,946 | +1.98% |
| 2000 | 206,264,595 | +1.41% |
| 2010 | 237,641,326 | +1.43% |
| Source: Statistics Indonesia,[8] Wertheim (1959) [9], Geografi dan Kependudukan (1976) [10] | ||
Population by province
| Province | Population (2010 Census) |
Proportion in cities (%) |
Proportion TFR |
|---|---|---|---|
| Aceh | 4,486,570 | 23.6 | 2.79 |
| North Sumatra | 12,985,075 | 42.4 | 3.01 |
| West Sumatra | 4,845,998 | 29.0 | 2.91 |
| Riau | 5,543,031 | 43.7 | 2.82 |
| Jambi | 3,088,618 | 28.3 | 2.51 |
| South Sumatra | 7,446,401 | 34.4 | 2.56 |
| Bengkulu | 1,713,393 | 29.4 | 2.51 |
| Lampung | 7,596,115 | 21.0 | 2.45 |
| Bangka Belitung | 1,223,048 | 43.0 | 2.54 |
| Riau Islands | 1,685,698 | 67.4 | 2.38 |
| Banten | 10,644,030 | 52.2 | 2.35 |
| Jakarta | 9,588,198 | 100.0 | 1.82 |
| West Java | 43,021,826 | 50.3 | 2.43 |
| Central Java | 32,380,687 | 40.4 | 2.20 |
| Yogyakarta | 3,452,390 | 57.7 | 1.94 |
| East Java | 37,476,011 | 40.9 | 2.00 |
| Bali | 3,891,428 | 49.8 | 2.13 |
| West Nusa Tenggara | 4,496,855 | 34.8 | 2.59 |
| East Nusa Tenggara | 4,679,316 | 15.9 | 3.82 |
| West Kalimantan | 4,393,239 | 25.1 | 2.64 |
| Central Kalimantan | 2,202,599 | 27.5 | 2.56 |
| South Kalimantan | 3,626,119 | 36.3 | 2.35 |
| East Kalimantan | 3,550,586 | 57.6 | 2.61 |
| North Sulawesi | 2,265,937 | 37.0 | 2.43 |
| Gorontalo | 1,038,585 | 25.5 | 2.76 |
| Central Sulawesi | 2,633,420 | 19.7 | 2.94 |
| South Sulawesi | 8,032,551 | 29.4 | 2.55 |
| Southeast Sulawesi | 2,230,569 | 20.8 | 3.20 |
| West Sulawesi | 1,158,336 | -- | 3.33 |
| Maluku | 1,531,402 | 25.9 | 3.56 |
| North Maluku | 1,035,478 | 29.5 | 3.35 |
| Papua | 2,851,999 | 22.2 | 2.87 |
| West Papua | 760,855 | -- | 3.18 |
| Indonesia | 237,641,326 | 2.41 | |
| Source: Population Census 2010[1] | |||
Largest cities
| Rank | Name | Province | Pop. | Rank | Name | Province | Pop. | ||
|---|---|---|---|---|---|---|---|---|---|
 Jakarta  Surabaya |
1 | Jakarta | Jakarta | 10,075,310 | 11 | Makassar | South Sulawesi | 1,429,242 |  Bekasi .jpg) Bandung |
| 2 | Surabaya | East Java | 2,853,661 | 12 | Bogor | West Java | 1,030,720 | ||
| 3 | Bekasi | West Java | 2,663,011 | 13 | Batam | Riau Islands | 1,030,528 | ||
| 4 | Bandung | West Java | 2,470,802 | 14 | Pekanbaru | Riau | 1,005,014 | ||
| 5 | Medan | North Sumatra | 2,191,140 | 15 | Bandar Lampung | Lampung | 960,695 | ||
| 6 | Depok | West Java | 2,033,508 | 16 | Padang | West Sumatra | 880,646 | ||
| 7 | Tangerang | Banten | 1,999,894 | 17 | Denpasar | Bali | 863,600 | ||
| 8 | Semarang | Central Java | 1,584,881 | 18 | Malang | East Java | 845,973 | ||
| 9 | Palembang | South Sumatra | 1,558,494 | 19 | Samarinda | East Kalimantan | 797,006 | ||
| 10 | South Tangerang | Banten | 1,492,999 | 20 | Banjarmasin | South Kalimantan | 666,223 | ||
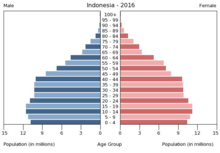
Age structure
Age structure in Indonesia (2010)[12]
Indonesia demographic composition has a relatively young population. According to 2011 estimate, total median age of Indonesia is 28.2 years.[12]
Vital statistics
|
3,5 - 4
3 - 3,5
2,5 – 3
2 – 2,5
1,5 – 2 |
UN estimates[13]
| Period | Live births per year | Deaths per year | Natural change per year | CBR1 | CDR1 | NC1 | TFR1 | IMR1 |
|---|---|---|---|---|---|---|---|---|
| 1950–1955 | 3,347,000 | 1,933,000 | 1,414,000 | 42.7 | 21.4 | 21.3 | 5.49 | 191.9 |
| 1955–1960 | 3,897,000 | 1,888,000 | 2,009,000 | 44.8 | 19.2 | 25.6 | 5.67 | 163.8 |
| 1960–1965 | 4,280,000 | 1,820,000 | 2,461,000 | 43.6 | 16.8 | 26.8 | 5.62 | 139.3 |
| 1965–1970 | 4,628,000 | 1,768,000 | 2,860,000 | 41.5 | 14.4 | 27.1 | 5.57 | 117.4 |
| 1970–1975 | 4,842,000 | 1,691,000 | 3,151,000 | 38.2 | 12.2 | 26.0 | 5.30 | 98.9 |
| 1975–1980 | 4,985,000 | 1,630,000 | 3,356,000 | 34.9 | 10.5 | 24.4 | 4.73 | 83.2 |
| 1980–1985 | 5,065,000 | 1,590,000 | 3,475,000 | 31.7 | 9.2 | 22.5 | 4.11 | 69.8 |
| 1985–1990 | 4,853,000 | 1,555,000 | 3,298,000 | 27.5 | 8.3 | 19.2 | 3.40 | 58.5 |
| 1990–1995 | 4,702,000 | 1,547,000 | 3,155,000 | 24.4 | 7.6 | 16.8 | 2.90 | 49.1 |
| 1995–2000 | 4,518,000 | 1,564,000 | 2,954,000 | 21.8 | 7.2 | 14.6 | 2.55 | 41.1 |
| 2000–2005 | 4,638,000 | 1,620,000 | 3,018,000 | 22.0 | 7.4 | 13.7 | 2.52 | 34.5 |
| 2005–2010 | 4,464,000 | 1,692,000 | 2,772,000 | 21.3 | 7.2 | 11.9 | 2.50 | 28.8 |
| 2010–2015 | 20.2 | 7.1 | 13.1 | 2.45 | 28.8 | |||
| 2015–2020 | 18.4 | 7.2 | 11.2 | 2.32 | 28.8 | |||
| 2020–2025 | 17.0 | 7.5 | 9.5 | 2.21 | 28.8 | |||
| 2025–2030 | 15.9 | 7.9 | 8.0 | 2.12 | 28.8 | |||
| 1 CBR = crude birth rate (per 1000); CDR = crude death rate (per 1000); NC = natural change (per 1000); TFR = total fertility rate (number of children per woman); IMR = infant mortality rate per 1000 births | ||||||||
| Average population (in millions) | Live births | Deaths | Natural change | Crude birth rate (per 1,000) | Crude death rate (per 1,000) | Natural change (per 1,000) | Fertility rates | |
|---|---|---|---|---|---|---|---|---|
| 2003 | 213,6 | 13.4 | 2.3 | |||||
| 2004 | 216,4 | 13.3 | 2.3 | |||||
| 2005 | 219,8 | 13.2 | 2.2 | |||||
| 2006 | 222,7 | 13.0 | 2.2 | |||||
| 2007 | 225,6 | 12.8 | 2.18 | |||||
| 2008 | 228,5 | 12.5 | 2.17 | |||||
| 2009 | 231,4 | 12.2 | 2.16 | |||||
| 2010 | 238,5 | 6,028,921 | 1,236,154 | 4,792,767 | 25.3 | 5.2 | 13.1 | 2.39 |
| 2011 | 241,0 | 13.2 | 2,37 | |||||
| 2012 | 244,2 | 13.1 | 2,35 |
Fertility and Births (Demographic and Health Surveys)
Total Fertility Rate (TFR) (Wanted Fertility Rate) and Crude Birth Rate (CBR):[14]
| Year | CBR (Total) | TFR (Total) | CBR (Urban) | TFR (Urban) | CBR (Rural) | TFR (Rural) |
|---|---|---|---|---|---|---|
| 1981-1983 | 4,3 | |||||
| 1987 | 3,4 (3,1) | 2,9 (2,6) | 3,7 (3,4) | |||
| 1991 | 25,1 | 3,02 (2,50) | 24,0 | 2,60 (2,03) | 25,6 | 3,24 (2,73) |
| 1994 | 2,9 (2,4) | 2,3 (1,8) | 3,2 (2,7) | |||
| 1997 | 2,8 (2,4) | 2,4 (2,0) | 3,0 (2,6) | |||
| 2002-2003 | 21,9 | 2,6 (2,2) | 22,1 | 2,4 (2,1) | 21,7 | 2,7 (2,3) |
| 2007 | 20,9 | 2,6 (2,2) | 20,2 | 2,3 (2,0) | 21,5 | 2,8 (2,4) |
| 2012 | 20,4 | 2,6 (2,0) | 20,1 | 2,4 (1,9) | 20,7 | 2,8 (2,2) |
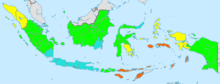
Fertility rate and aging population (by province)
Total fertility rate (TFR) and population over age 60 by region as of 2010:[15]
| Province | Total fertility rate (2010) | Population over age 60 (2010) |
|---|---|---|
| North Sumatera | 3.01 | 5.9 |
| West Sumatera | 2.91 | 8.1 |
| Riau | 2.82 | 4.0 |
| Jambi | 2.51 | 5.5 |
| South Sumatera | 2.56 | 6.2 |
| Bengkulu | 2.51 | 5.8 |
| Lampung | 2.45 | 7.2 |
| Bangka Belitung | 2.54 | 5.8 |
| Kepulauan Riau | 2.38 | 3.4 |
| Jakarta | 1.82 | 5.1 |
| West Java | 2.43 | 7.0 |
| Central Java | 2.20 | 10.3 |
| Yogyakarta | 1.94 | 12.9 |
| East Java | 2.00 | 10.4 |
| Banten | 2.35 | 4.6 |
| Bali | 2.13 | 9.7 |
| East Nusa Tenggara | 3.82 | 7.4 |
| West Kalimantan | 2.64 | 5.8 |
| Central Kalimantan | 2.56 | 4.6 |
| South Kalimantan | 2.35 | 5.8 |
| East Kalimantan | 2.61 | 4.0 |
| North Sulawesi | 2.43 | 8.4 |
| Central Sulawesi | 2.94 | 6.6 |
| South Sulawesi | 2.55 | 8.2 |
| Southeast Sulawesi | 3.20 | 5.8 |
| Gorontalo | 2.76 | 5.9 |
| West Sulawesi | 3.33 | 6.2 |
| Maluku | 3.56 | 6.2 |
| North Maluku | 3.35 | 4.8 |
| West Papua | 3.18 | 3.2 |
| Papua | 2.87 | 2.4 |
Life expectancy
| Period | Life expectancy in Years |
Period | Life expectancy in Years |
|---|---|---|---|
| 1950–1955 | 43.5 | 1985–1990 | 62.4 |
| 1955–1960 | 47.0 | 1990–1995 | 64.2 |
| 1960–1965 | 50.2 | 1995–2000 | 65.8 |
| 1965–1970 | 53.1 | 2000–2005 | 66.7 |
| 1970–1975 | 55.9 | 2005–2010 | 68.6 |
| 1975–1980 | 58.5 | 2010–2015 | 69.4 |
| 1980–1985 | 60.7 |
Source: UN World Population Prospects[16]
Ethnic groups
There are over 300 ethnic groups in Indonesia. 95% of those are of Native Indonesian ancestry. Javanese is the largest group with 100 million people (42%), followed by Sundanese who number nearly 40 million (15%).
Religions
Indonesia is the world's most populous Muslim-majority nation; almost 87.18% of Indonesians declared themselves Muslim in the 2010 census.[17] 9.87% of the population adhered to Christianity (of which more than 70% were Protestant), 1.69% were Hindu, 0.72% Buddhist, and 0.56 of other faiths. Most Indonesian Hindus are Balinese[18] and most Buddhists in modern-day Indonesia are Tionghoa.[19]
Languages
Indonesian is the official language but there are many different languages native to Indonesia. According to Ethnologue, there are currently 737 living languages spoken in Indonesia,[20] the most widely spoken being Javanese.
A number of Chinese varieties, most prominently Min Nan, are also spoken. The public use of Chinese, especially Chinese characters, was officially discouraged between 1966 and 1998.
Dutch is spoken by older generations.
Literacy
definition: age 15 and over can read and write
total population: 92.81%
male: 95.5%
female: 90.4% (2011 est.)
Education is not free; however, it is compulsory for children through to grade 9. Although about 92% of eligible children are enrolled in primary school, a much smaller percentage attends full-time. About 44% of secondary school-age children attend junior high school, and some others of this age group attend vocational schools.
CIA World Factbook demographic statistics
The following demographic statistics are from the CIA World Factbook,[21] unless otherwise indicated.
Age structure
- 0-14 years: 25.02% (male 33,205,805/female 31,994,844)
- 15-24 years: 16.99% (male 22,537,842/female 21,738,210)
- 25-54 years: 42.4% (male 56,493,414/female 53,980,979)
- 55-64 years: 8.58% (male 10,192,430/female 12,177,931)
- 65 years and over: 7.01% (male 7,954,795/female 10,304,489) (2017 est.)
Median age
- total: 30.2 years
- male: 29.6 years
- female: 30.8 years (2017 est.)
Birth rate
- 16.2 births/1,000 population (2017 est.)
Death rate
- 6.5 deaths/1,000 population (2017 est.)
Population growth rate
- 1.097% (2010 est.)
- 1.04% (2012 est.)
- 0.86% (2017 est.)
Urbanization
- urban population: 55.3% of total population (2018)
- rate of urbanisation: 2.27% annual rate of change (2015-20 est.)
Sex ratio
- at birth: 1.04 male(s)/female
- 0-14 years: 1.04 male(s)/female
- 15-24 years: 1.04 male(s)/female
- 25-54 years: 1.04 male(s)/female
- 55-64 years: 0.84 male(s)/female
- 65 years and over: 0.77 male(s)/female
- total population: 1 male(s)/female (2017 est.)
Infant mortality rate
- total: 22.7 deaths/1,000 live births
- male: 26.6 deaths/1,000 live births
- female: 18.6 deaths/1,000 live births (2017 est.)
Life expectancy at birth
- total population: 73 years
- male: 70.4 years
- female: 75.7 years (2017 est.)
HIV/AIDS
- Adult prevalence rate: 0.4% (2017 est.)
- People living with HIV/AIDS: 630,000 (2017 est.)
- HIV/AIDS deaths: 39,000 (2017 est.)
Obesity - adult prevalence rate
- 6.9% (2016)
Children under the age of 5 years underweight
- 19.9% (2013)
Nationality
- noun: Indonesian(s)
- adjective: Indonesian
- Ethnic groups: Javanese 40.1%, Sundanese 15.5%, Malay 3.7%, Batak 3.6%, Madurese 3%, Betawi 2.9%, Minangkabau 2.7%, Buginese 2.7%, Bantenese 2%, Banjarese 1.7%, Balinese 1.7%, Acehnese 1.4%, Dayak 1.4%, Sasak 1.3%, Chinese 1.2%, other 15% (2010 est.)
Religions
- Muslim 87.2%, Protestant 7%, Roman Catholic 2.9%, Hindu 1.7%, other 0.9% (includes Buddhist and Confucian), unspecified 0.4% (2010 est.)
Languages
- Indonesian (official, a form of Malay influenced by other languages of Indonesia), local languages (the most widely spoken of which is Javanese).
School life expectancy (primary to tertiary education)
- total: 11 years
- male: 12 years
- female: 11 years (2005)
Education expenditures
- 2.8% of GDP (2014)
See also
References
- 1 2 3 "Population of Indonesia by Province 1971, 1980, 1990, 1995, 2000 and 2010". Central Bureau of Statistics. Retrieved 18 May 2015.
- ↑ "Population Projection by Province, 2010-2035". Central Bureau of Statistics. Retrieved 18 May 2015.
- ↑ Calder, Joshua (3 May 2006). "Most Populous Islands". World Island Information. Retrieved 26 September 2006.
- ↑ Witton, Patrick (2003). Indonesia. Melbourne: Lonely Planet. p. 47. ISBN 1-74059-154-2.
- ↑ Shamim Adam; Berni Moestafa; Novrida Manurung (28 January 2014). "Indonesia Population Approaching U.S. Revives Birth Control". Bloomberg.com. Retrieved 18 May 2015.
- ↑ "Indonesia Facing Populace Larger Than US Revives Birth Control". 28 January 2014.
- ↑ https://www.indexmundi.com/indonesia/demographics_profile.html
- ↑ "Population of Indonesia by Province 1971, 1980, 1990, 1995, 2000 and 2010". Central Bureau of Statistics. Retrieved 20 July 2015.
- ↑ Wertheim, W. F. (1959). Indonesian Society in Transition (Second (revised) ed.). 's-Gravenhage: Uitgeverij W. van Hoeve. p. 370.
- ↑ Geografi dan Kependudukan untuk SMP kelas 2 [Geography and Demographics for High School Grade 2] (in Indonesian). FA. Hasmar. 1976.
- ↑ "Badan Pusat Statistik (multiple subsites)" (in Indonesian). Badan Pusat Statistik. Retrieved 15 August 2017.
- 1 2 "Population of Indonesia". Indonesia Investment.
- ↑ World Population Prospects: The 2017 Revision
- ↑ http://microdata.worldbank.org/index.php/catalog/dhs#_r=&collection=&country=&dtype=&from=1890&page=8&ps=&sk=&sort_by=nation&sort_order=&to=2014&topic=&view=s&vk=
- ↑ http://www.ifa-fiv.org/wp-content/2014/09/Indonesian_Ageing_Monograph-print-version1.pdf
- ↑ "World Population Prospects – Population Division – United Nations". Retrieved 2017-07-15.
- ↑ Penduduk Menurut Wilayah dan Agama yang Dianut
- ↑ Oey, Eric (1997). "Bali" (3rd ed.). Singapore: Periplus Editions. ISBN 962-593-028-0.
- ↑ "Indonesia - Buddhism". U.S. Library of Congress. Retrieved 15 October 2006.
- ↑ ethnologue.com
- ↑ Central Intelligence Agency (2012). "Indonesia". The World Factbook. Retrieved 6 April 2012.
External links
- Indonesian Central Bureau of Statistics (in Indonesian)
- CIA World Factbook article on Indonesia
- On Indonesians of Arab descent
- United Nations "World Population Prospects": Country Profile - Indonesia
| History |  | ||||||
|---|---|---|---|---|---|---|---|
| Geography |
| ||||||
| Politics | |||||||
| Economy | |||||||
| Culture |
| ||||||