Demographics of the Palestinian territories
This article is about the demographic features of the population of the area which is commonly described as Palestinian territories and includes information on ethnicity, education level, health of the populace, economic status, religious affiliations and other aspects of that population.
| Part of a series on |
| Palestinians |
|---|
 |
| Demographics |
| Politics |
|
| Religion / religious sites |
| Culture |
| List of Palestinians |
According to a commonly used definition as relating to an application of the 1949 Armistice Agreement green line, the Palestinian territories have contributory parts of the West Bank (including East Jerusalem) and the Gaza Strip.
The Palestinian National Authority, the United Nations Security Council,[1] the United Nations General Assembly,[2] the European Union,[3] the International Court of Justice,[4] and the International Committee of the Red Cross[5] use the terminology "Palestinian territories" or "occupied Palestinian territories". Israel refers to the administrative division encompassing Israeli-controlled Jewish-majority civilian areas of Area C of the West Bank, excluding East Jerusalem, as Judea and Samaria Area (Hebrew: אֵזוֹר יְהוּדָה וְשׁוֹמְרוֹן, Ezor Yehuda VeShomron).[6]
Overview
The demographic statistics of the CIA World Factbook and the Israel Central Bureau of Statistics estimated that the collective Palestinian Arab population in the region of Palestine, including Israel, the West Bank, and the Gaza Strip, amounted to 5,79 million people in 2017.[7][8] Thereof, 2.16 million Arabs live in the West Bank, 1.84 million Arabs live in Israel, and 1.79 million Arabs live in the Gaza Strip.[7][8]
The demographic statistics of the CIA World Factbook and the Israel Central Bureau of Statistics estimated (2017) that the collective population in the Palestinian territories amounted to 4,543,126 million people in 2017. Thereof, 2,155,743 Arabs live in the West Bank, 1,795,183 Arabs live in the Gaza Strip, and 391,000 Jews live in the West Bank.[8] Approximately 201,200 Jews live in East Jerusalem.[8] East Jerusalem, once occupied illegally by Jordan, came under Israeli rule after the 1967 Six-Day War.[9] In the Palestinian territories, c. 86% of the population is Arab (predominantly Sunni), c. 13% is Jewish, other <1% (cf. Israel: Jewish 74%, Arab 21%, other 5%).[8]
According to the UN, the population in the State of Palestine was c. 4.9 million in 2017, resulting in an estimated population density of 817 capita per km2.[10] According to the Palestinian Central Bureau of Statistics (PCBS), the number of Palestinians in the Palestinian Territory was 3,935,249 in 2009, resulting in a calculated population density of 654 capita per km2, of which 433 capita/km2 in the West Bank including Jerusalem and 4,073 capita/km2 in Gaza Strip.[11] In the mid-2009, the share of population less than 15 years was 41.9% and above 65 years 3%.[11]
Out of 224 listed countries and territories, the West Bank ranked 48th with a total fertility rate (TFR) of 3.27, and the Gaza Strip ranked 31st with a TFR of 4.13 (2017 est.), according to the CIA World Factbook 2017.[12] In 2017, the West Bank had an estimated population growth rate of 1.84% (country comparison to the world: 56th) and the Gaza Strip had a population growth rate of 2.33% (31th).[13][14][15]
| Population (mid-year)[16][17][18] | |||
|---|---|---|---|
| Year | West Bank | Gaza | Total |
| 1970 | 0.69 | 0.34 | 1.03 |
| 1980 | 0.90 | 0.46 | 1.36 |
| 1990 | 1.25 | 0.65 | 1.90 |
| 2000 | 1.98 | 1.13 | 3.11 |
| 2010 | 2.52 | 1.60 | 4.12 |
| 2014 | 2.73 | 1.82 | 4.55 |
| Source: U.S. Census Bureau | |||
| 2006 | 2.5 | 1.5 | 4.0 |
| 2009 | 2.48 | 1.45 | 3.94 |
| Source: Palestinian Central Bureau of Statistics | |||
| Name | Population (2017) | Area (km2) | Pop. density (capita per km2) |
|---|---|---|---|
| West Bank [14] | 2,747,943 | 5,860 | 469 [19] |
| Gaza Strip [13] | 1,795,183 | 360 | 4,987 [20] |
| Total | 4,543,126 | 6,220 | 730[21] |
|
|
|
|||||||||||||||||||||||||||||||||||||||||||||||||||||||||||||||||||||||||||||||||||||||||||||||||||||||||||||||||||||||
Vital statistics
UN estimates [23]
| Period | Live births per year | Deaths per year | Natural change per year | CBR1 | CDR1 | NC1 | TFR1 | IMR1 |
|---|---|---|---|---|---|---|---|---|
| 1950–1955 | 44 000 | 19 000 | 25 000 | 46.7 | 20.0 | 26.7 | 7.38 | 158.2 |
| 1955–1960 | 49 000 | 19 000 | 30 000 | 46.7 | 18.5 | 28.2 | 7.38 | 147.0 |
| 1960–1965 | 59 000 | 19 000 | 40 000 | 52.5 | 16.8 | 35.7 | 8.00 | 129.9 |
| 1965–1970 | 60 000 | 16 000 | 43 000 | 52.5 | 14.0 | 38.5 | 8.00 | 109.1 |
| 1970–1975 | 60 000 | 14 000 | 46 000 | 46.6 | 11.2 | 35.4 | 7.69 | 89.8 |
| 1975–1980 | 67 000 | 13 000 | 54 000 | 47.8 | 8.9 | 38.9 | 7.50 | 70.6 |
| 1980–1985 | 73 000 | 11 000 | 62 000 | 44.6 | 6.8 | 37.8 | 7.05 | 53.0 |
| 1985–1990 | 83 000 | 11 000 | 72 000 | 45.1 | 5.5 | 39.6 | 6.43 | 40.0 |
| 1990–1995 | 107 000 | 11 000 | 96 000 | 45.6 | 4.8 | 40.8 | 6.59 | 32.9 |
| 1995–2000 | 118 000 | 12 000 | 106 000 | 42.0 | 4.1 | 37.9 | 5.77 | 27.6 |
| 2000–2005 | 122 000 | 13 000 | 109 000 | 39.1 | 3.8 | 35.3 | 5.05 | 24.6 |
| 2005–2010 | 128 000 | 14 000 | 115 000 | 35.9 | 3.6 | 32.3 | 4.65 | 22.2 |
| 2010–2015 | 144 000 | 16 000 | 128 000 | 4.28 | ||||
| 1 CBR = crude birth rate (per 1000); CDR = crude death rate (per 1000); NC = natural change (per 1000); TFR = total fertility rate (number of children per woman); IMR = infant mortality rate per 1000 births | ||||||||
Births and deaths [24]
| Year | Population (x1000) | Live births | Deaths | Natural increase | Crude birth rate | Crude death rate | Rate of natural increase | TFR |
|---|---|---|---|---|---|---|---|---|
| 2010 | 137 085 | 10 764 | 126 231 | 4.4 | ||||
| 2011 | 131 430 | 11 333 | 120 097 | |||||
| 2012 | 129 826 | 11 676 | 118 150 | |||||
| 2013 | 126 912 | 11 013 | 115 899 | 4.1 | ||||
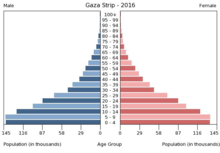
Population pyramids[25]
Census (01/12/2007) :
| Age group | Male | Female | Total | % |
|---|---|---|---|---|
| Total | 1 747 284 | 1 696 544 | 3 443 828 | 100 |
| 0-4 | 266 052 | 253 883 | 519 935 | 15.10 |
| 5-9 | 239 156 | 227 724 | 466 880 | 13.56 |
| 10-14 | 238 306 | 227 967 | 466 273 | 13.54 |
| 15-19 | 211 464 | 202 975 | 414 439 | 12.03 |
| 20-24 | 158 374 | 151 561 | 309 935 | 9.00 |
| 25-29 | 128 068 | 124 159 | 252 227 | 7.32 |
| 30-34 | 108 945 | 106 343 | 215 288 | 6.25 |
| 35-39 | 90 155 | 86 905 | 177 060 | 5.14 |
| 40-44 | 81 186 | 75 328 | 156 514 | 4.54 |
| 45-49 | 60 832 | 56 748 | 117 580 | 3.41 |
| 50-54 | 41 606 | 41 695 | 83 301 | 2.42 |
| 55-59 | 32 011 | 30 999 | 63 010 | 1.83 |
| 60-64 | 22 060 | 25 769 | 47 829 | 1.39 |
| 65-69 | 13 853 | 19 844 | 33 697 | 0.98 |
| 70-74 | 12 689 | 16 627 | 29 316 | 0.85 |
| 75-79 | 8 599 | 12 536 | 21 135 | 0.61 |
| 80-84 | 4 861 | 6 888 | 11 749 | 0.34 |
| 85-89 | 2 318 | 3 026 | 5 344 | 0.16 |
| 90-94 | 871 | 1 133 | 2 004 | 0.06 |
| 95+ | 464 | 597 | 1 061 | 0.03 |
| unknown | 25 414 | 23 837 | 49 251 | 0.14 |
| Age group | Male | Female | Total | Percent |
|---|---|---|---|---|
| 0-14 | 743 514 | 709 574 | 1 453 088 | 42.19 |
| 15-64 | 934 701 | 902 482 | 1 837 183 | 53.35 |
| 65+ | 43 655 | 60 651 | 104 306 | 3.03 |
Estimates (01/07/2013) :
| Age group | Male | Female | Total | % |
|---|---|---|---|---|
| Total | 2 245 400 | 2 175 149 | 4 420 549 | 100 |
| 0-4 | 333 246 | 319 213 | 652 459 | 14.76 |
| 5-9 | 295 678 | 283 886 | 579 564 | 13.11 |
| 10-14 | 275 428 | 263 679 | 539 107 | 12.20 |
| 15-19 | 262 267 | 251 710 | 513 977 | 11.63 |
| 20-24 | 230 888 | 221 790 | 452 678 | 10.24 |
| 25-29 | 182 448 | 174 730 | 357 178 | 8.08 |
| 30-34 | 144 721 | 138 652 | 283 373 | 6.41 |
| 35-39 | 122 846 | 119 333 | 242 179 | 5.48 |
| 40-44 | 103 233 | 100 276 | 203 509 | 4.60 |
| 45-49 | 87 969 | 82 580 | 170 549 | 3.86 |
| 50-54 | 70 535 | 65 239 | 135 774 | 3.07 |
| 55-59 | 48 912 | 46 910 | 95 822 | 2.17 |
| 60-64 | 32 353 | 33 581 | 65 934 | 1.49 |
| 65-69 | 21 985 | 26 414 | 48 399 | 1.09 |
| 70-74 | 14 201 | 19 831 | 34 032 | 0.77 |
| 75-79 | 9 344 | 13 728 | 23 072 | 0.52 |
| 80+ | 9 346 | 13 597 | 22 943 | 0.52 |
| Age group | Male | Female | Total | Percent |
|---|---|---|---|---|
| 0-14 | 904 352 | 866 778 | 1 771 130 | 40.07 |
| 15-64 | 1 286 172 | 1 234 801 | 2 520 973 | 57.03 |
| 65+ | 54 876 | 73 570 | 128 446 | 2.91 |
Palestinian Central Bureau [26]
| fertility rate (Gaza) | birth rate (Gaza) | death rate (Gaza) | Natural change(Gaza) | |
|---|---|---|---|---|
| 1997 | 45.4 | 4.7 | 40.7 | |
| 2000 | 44.5 | 4.3 | 40.2 | |
| 2005 | 42.2 | 3.9 | 39.3 | |
| 2009 | 36.9 | 4.1 | 32.8 | |
| 2010 | 4.9 | 37.1 | 4.0 | 33.1 |
| 2011 | 37.2 | 3.9 | 34.3 | |
| 2013 | 37.1 | 3.7 | 34.4 |
| fertility rate (West Bank) | birth rate (West Bank) | death rate (West Bank) | Natural change(West Bank) | |
|---|---|---|---|---|
| 1997 | 41.2 | 5.1 | 36.1 | |
| 2000 | 38.8 | 4.6 | 34.2 | |
| 2005 | 34.5 | 4.1 | 30.4 | |
| 2009 | 30.1 | 4.4 | 25.7 | |
| 2010 | 3.8 | 30.1 | 4.2 | 25.9 |
| 2011 | 30.1 | 4.1 | 26.0 | |
| 2013 | 29.7 | 4.0 | 25.7 |
Life expectancy
Average life expectancy at age 0 of the total population.[27]
| Period | Life expectancy in Years |
Period | Life expectancy in Years |
|---|---|---|---|
| 1950–1955 | 46.6 | 1985–1990 | 67.1 |
| 1955–1960 | 48.2 | 1990–1995 | 68.9 |
| 1960–1965 | 50.8 | 1995–2000 | 70.3 |
| 1965–1970 | 54.1 | 2000–2005 | 71.2 |
| 1970–1975 | 57.5 | 2005–2010 | 72.0 |
| 1975–1980 | 61.0 | 2010–2015 | 72.9 |
| 1980–1985 | 64.4 |
Demographics of the West Bank
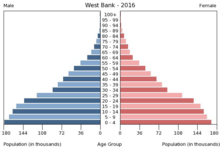
The following demographic statistics are from the CIA World Factbook, unless otherwise indicated.
Population
Total 2,747,943 (July 2017 est.); 78% of the population is Arab (predominantly Sunni), 21% is Jewish[8] (cf. Israel: Jewish 74%, Arab 21%, other 5%; and Gaza: Arab 99%)[28]
Age structure
0–14 years: 33.7% (male 472,476/female 448,078)
15–24 years: 21.7% (male 303,578/female 289,119)
25–54 years: 36.4% (male 511,443/female 483,276)
55–64 years: 3.8% (male 59,762/female 59,372)
65 years and over: 3.8% (male 43,629/female 60,315) (2014 est.)
Population growth rate
1.99% (2014 est.)
Birth rate
24.56 births/1,000 population (2011 est.)
Mortality rate
3.51 deaths/1,000 population (2014 est.)
Net migration rate
0 migrant(s)/1,000 population (2008 est.)
Sex ratio
at birth: 1.06 male(s)/female
under 15 years: 1.05 male(s)/female
15–64 years: 1.05 male(s)/female
65 years and over: 0.71 male(s)/female
total population: 1.04 male(s)/female (2011 est.)
Infant mortality rate
total: 14.92 deaths/1,000 live births
male: 16.73 deaths/1,000 live births
female: 13.01 deaths/1,000 live births (2011 est.)
Life expectancy at birth
total population: 75.01 years
male: 72.97 years
female: 77.17 years (2011 est.)
Total fertility rate
2.83 children born/woman (2014 est.)
- Jewish population: 5.07 children born/woman (West Bank alone)[29]
Nationality
noun: Arabs: Palestinian
Ethnic groups
Arab (Palestinian): 83%
Israeli Jewish and other: 17%
Religions
Muslim 80–85% (predominantly Sunni; also non-denominational), Christian 1.0–2.5%, Jewish 12–14%[8]
Languages
Arabic, English (compulsory in schools, widely spoken by Palestinians), and Hebrew (spoken by Israeli Jews in the West Bank, and spoken by many Palestinians) are commonly known.
Literacy
definition: age 15 and over can read and write
total population: 92.4%
male: 96.7%
female: 88% (2011 est.)
Demographics of the Gaza Strip
The following demographic statistics come from the CIA World Factbook (2006-2014), unless otherwise indicated.
Population
Current: 1,816,379 (July 2014 est.)[30]
In 2010 approximately 1.6 million Palestinians lived in the Gaza Strip[31], almost 1.0 million of them UN-registered refugees.[32]
The Strip's population has continued to increase since that time, one of the main reasons being a total fertility rate of 4.24 children per woman (2014 est). In a ranking by total fertility rate, this places Gaza 34th of 224 regions.[33]
Age structure
0–14 years:
44.7% (male 343,988/female 325,856)
15–64 years:
52.7% (male 403,855/female 386,681)
65 years and over:
2.7% (male 16,196/female 23,626) (2008 est.)
Population growth rate
3.422% (2008 est.)
Birth rate
39.45 births/1,000 population (2006 est.)
Mortality rate
3.8 deaths/1,000 population (2006 est.)
Net migration rate
0 migrant(s)/1,000 population (2008 est.)
Sex ratio
at birth:
1.05 male(s)/female
under 15 years:
1.05 male(s)/female
15–64 years:
1.04 male(s)/female
65 years and over:
0.71 male(s)/female
total population:
1.04 male(s)/female (2006 est.)
Infant mortality rate
total population:
22.4/1,000 live births
male:
23.48/1,000 live births
female:
21.27/1,000 live births (2006 est.)
Life expectancy at birth
total population:
71.97 years
male:
70.67 years
female:
73.34 years (2006 est.)
Total fertility rate
4.18 children born/woman (2013 est.)
Nationality
noun:
Palestinians
adjective:
Palestinian
Ethnic groups
Arab (Palestinian) 98.7%
Religions
Sunni Muslim 98–99 %, Arab Christians 0.2% (2,000 to 3,000 est.), other, unaffiliated, unspecified <1.0% (2012 est.).[34][35]
Languages
Arabic, Hebrew (spoken by many Palestinians), English (widely understood)
Literacy
definition:
age 15 and over can read and write
total population:
91.9%
male:
96.3%
female:
87.4% (2003 est.)
See also
References
- ↑ Resolution 446, Resolution 465, Resolution 484, among others
- ↑ "Applicability of the Geneva Convention relative to the Protection of Civilian Persons in Time of War, of 12 August 1949, to the Occupied Palestinian Territory, including Jerusalem, and the other occupied Arab territories". United Nations. 17 December 2003. Archived from the original on 3 June 2007. Retrieved 27 September 2006.
- ↑ "EU-Settlements Watch" (PDF). 1 February – 31 July 2002.
- ↑ "Legal Consequences of the Construction of a Wall in the Occupied Palestinian Territory". International Court of Justice. 9 July 2004. Archived from the original on 28 August 2007. Retrieved 27 September 2006.
- ↑ "Conference of High Contracting Parties to the Fourth Geneva Convention: statement by the International Committee of the Red Cross". International Committee of the Red Cross. 5 December 2001. Archived from the original on 7 February 2011. Retrieved 27 September 2006.
- ↑ "Statistical Abstract of Israel 2012" (PDF). Archived from the original (PDF) on 15 December 2013. Retrieved 15 January 2013.
- 1 2 "Population of Israel on the Eve of 2018 - 8.8 Million". Press Release. Israel Central Bureau of Statistics. 31 December 2017. Retrieved 2 January 2018.
- 1 2 3 4 5 6 7 8 9 "CIA – The World Factbook: West Bank". Cia.gov. Retrieved 2018-03-08.
- ↑ Ian S. Lustick, "Has Israel Annexed East Jerusalem?", Middle East Policy, Vol. V, No. 1, pp. 34-45, January 1997; accessed 25 November 2014.
- ↑ "State of Palestine - General Information". data.un.org. United Nations. Retrieved 8 March 2018.
- 1 2 Palestine in Figures 2009 Palestinian Central Bureau of Statistics, May 2010
- ↑ "COUNTRY COMPARISON :: TOTAL FERTILITY RATE". The World Factbook. CIA. Retrieved 8 March 2018.
- 1 2 "Middle East :: WEST BANK". The World Fact Book. CIA. Retrieved 8 March 2018.
- 1 2 "Middle East :: GAZA STRIP". The World Fact Book. CIA. Retrieved 8 March 2018.
- ↑ "COUNTRY COMPARISON :: POPULATION GROWTH RATE". The World Fact Book. CIA. Retrieved 8 March 2018.
- ↑ US Census Bureau International Programs International Data Base IDB West Bank and Gaza
- ↑ Palestinians in figures 2009 Palestinian Central Bureau of Statistics May 2010
- ↑ Palestinians at the End of Year 2006 Palestinian Central Bureau of Statistics
- ↑ cf. South Korea 507 capita per km2
- ↑ cf. Hong Kong 6,544 capita per km2
- ↑ cf. Guernsey 965 capita per km2 and Taiwan 650 cap. per km2
- 1 2 3 Palestinian Central Bureau of Statistics
- ↑ World Population Prospects: The 2010 Revision Archived May 6, 2011, at the Wayback Machine.
- ↑ http://unstats.un.org/unsd/demographic/products/vitstats/serATab3.pdf
- ↑ "Demographic Yearbook". UN Data. United Nations. Retrieved 4 December 2015.
- ↑
- ↑ "World Population Prospects - Population Division - United Nations". esa.un.org. Retrieved 2018-08-26.
- ↑ "CIA – The World Factbook: Israel". Cia.gov. Retrieved 2018-03-08.
- ↑ Israeli CBS 2011 data
- ↑ "CIA – The World Factbook". Cia.gov. Retrieved 2011-09-27.
- ↑ "CIA – The World Factbook". Cia.gov. Retrieved 2011-09-27.
- ↑ "UNRWA: Palestine refugees". Un.org. Archived from the original on 17 December 2007. Retrieved 1 June 2010.
- ↑ "CIA – The World Factbook". Cia.gov. Retrieved 2011-09-27.
- ↑ Middle East Christians: Gaza pastor BBC News, 21 December 2005
- ↑ https://www.cia.gov/library/publications/the-world-factbook/geos/gz.html
External links
- CIA World Factbook
- Forbes, Andrew, and Henley, David, People of Palestine (Chiang Mai: Cognoscenti Books, 2012), ASIN: B0094TU8VY
- Demography of the Palestinian population with special emphasis on the occupied territories, 1995 paper by Arjun L. Adlakha, Kevin G. Kinsella and Marwan Khawaja. Available at Population Bulletin of ESCWA's website.