Demographics of Equatorial Guinea
This article is about the demographic features of the population of Equatorial Guinea, including population density, ethnicity, education level, health of the populace, economic status, religious affiliations and other aspects of the population.
Population
According to the 2017 revision of the World Population Prospects[1] the total population was 1,221,490 in 2016, compared to only 226 000 in 1950. The proportion of children between the ages of 0 and 14 in 2010 was 39.2%, 57.9% was between 15 and 64 years of age, while 2.9% was 65 years or older .[2]
| Total population (x 1000) | Population aged 0–14 (%) | Population aged 15–64 (%) | Population aged 65+ (%) | |
|---|---|---|---|---|
| 1950 | 226 | 34.2 | 60.1 | 5.6 |
| 1955 | 238 | 35.7 | 59.0 | 5.3 |
| 1960 | 252 | 37.0 | 57.9 | 5.0 |
| 1965 | 269 | 38.3 | 56.9 | 4.8 |
| 1970 | 291 | 38.7 | 56.7 | 4.6 |
| 1975 | 238 | 44.8 | 49.8 | 5.4 |
| 1980 | 221 | 43.7 | 50.3 | 6.0 |
| 1985 | 313 | 34.7 | 60.4 | 4.9 |
| 1990 | 374 | 37.7 | 57.8 | 4.5 |
| 1995 | 443 | 41.9 | 54.1 | 4.1 |
| 2000 | 520 | 42.6 | 53.8 | 3.7 |
| 2005 | 608 | 40.5 | 56.2 | 3.2 |
| 2010 | 700 | 39.2 | 57.9 | 2.9 |
Structure of the population (DHS 2011) (Males 9 043, Females 9 702 = 18 745) :
| Age Group | Male (%) | Female (%) | Total (%) |
|---|---|---|---|
| 0-4 | 16,1 | 15,2 | 15,7 |
| 5-9 | 13,2 | 12,5 | 12,8 |
| 10-14 | 11,7 | 10,4 | 11,1 |
| 15-19 | 8,7 | 8,4 | 8,6 |
| 20-24 | 7,3 | 8,6 | 8,0 |
| 25-29 | 6,7 | 6,9 | 6,8 |
| 30-34 | 5,5 | 5,7 | 5,6 |
| 35-39 | 5,1 | 4,4 | 4,7 |
| 40-44 | 4,3 | 4,5 | 4,4 |
| 45-49 | 4,2 | 3,7 | 3,9 |
| 50-54 | 3,8 | 6,2 | 5,1 |
| 55-59 | 3,3 | 3,3 | 3,3 |
| 60-64 | 3,4 | 3,3 | 3,4 |
| 65-69 | 2,2 | 2,1 | 2,2 |
| 70-74 | 1,7 | 1,6 | 1,6 |
| 75-79 | 1,3 | 1,1 | 1,2 |
| 80+ | 1,2 | 1,8 | 1,5 |
| unknown | 0,4 | 0,1 | 0,2 |
| Age group | Male (%) | Female (%) | Total (%) |
|---|---|---|---|
| 0-14 | 41,0 | 38,1 | 39,6 |
| 15-64 | 52,2 | 55,2 | 53,7 |
| 65+ | 6,4 | 6,6 | 6,5 |
Vital statistics
Registration of vital events is in Equatorial Guinea not complete. The Population Departement of the United Nations prepared the following estimates. [2]
| Period | Live births per year | Deaths per year | Natural change per year | CBR* | CDR* | NC* | TFR* | IMR* |
|---|---|---|---|---|---|---|---|---|
| 1950–1955 | 9 000 | 7 000 | 2 000 | 40.9 | 30.4 | 10.5 | 5.50 | 196 |
| 1955–1960 | 10 000 | 7 000 | 3 000 | 40.5 | 28.7 | 11.8 | 5.50 | 186 |
| 1960–1965 | 10 000 | 7 000 | 3 000 | 40.1 | 26.9 | 13.3 | 5.53 | 176 |
| 1965–1970 | 11 000 | 7 000 | 4 000 | 40.7 | 25.3 | 15.3 | 5.66 | 167 |
| 1970–1975 | 10 000 | 6 000 | 3 000 | 36.8 | 23.7 | 13.1 | 5.68 | 157 |
| 1975–1980 | 8 000 | 5 000 | 2 000 | 32.9 | 22.2 | 10.8 | 5.68 | 149 |
| 1980–1985 | 11 000 | 6 000 | 5 000 | 41.7 | 21.4 | 20.3 | 5.79 | 138 |
| 1985–1990 | 16 000 | 7 000 | 9 000 | 47.4 | 20.4 | 26.9 | 5.89 | 128 |
| 1990–1995 | 18 000 | 8 000 | 11 000 | 45.0 | 18.7 | 26.3 | 5.89 | 118 |
| 1995–2000 | 20 000 | 8 000 | 12 000 | 41.3 | 17.2 | 24.0 | 5.87 | 114 |
| 2000–2005 | 22 000 | 9 000 | 12 000 | 38.4 | 16.3 | 22.1 | 5.64 | 111 |
| 2005–2010 | 24 000 | 10 000 | 15 000 | 37.3 | 15.1 | 22.2 | 5.36 | 102 |
| * CBR = crude birth rate (per 1000); CDR = crude death rate (per 1000); NC = natural change (per 1000); IMR = infant mortality rate per 1000 births; TFR = total fertility rate (number of children per woman) | ||||||||
Fertility and births
Total Fertility Rate (TFR) (Wanted Fertility Rate) and Crude Birth Rate (CBR):[3]
| Year | CBR (Total) | TFR (Total) | CBR (Urban) | TFR (Urban) | CBR (Rural) | TFR (Rural) |
|---|---|---|---|---|---|---|
| 2011 | 36,3 | 5,1 (4,4) | 36,5 | 4,4 (3,8) | 36,0 | 5,9 (5,1) |
Fertility data as of 2011 (DHS Program):[3]
| Region | Total fertility rate | Percentage of women age 15-49 currently pregnant | Mean number of children ever born to women age 40-49 |
|---|---|---|---|
| Insular | 4.3 | 8.4 | 5.0 |
| Continental | 5.4 | 9.2 | 6.0 |
Life expectancy
| Period | Life expectancy in Years[4] |
|---|---|
| 1950–1955 | 34.48 |
| 1955–1960 | |
| 1960–1965 | |
| 1965–1970 | |
| 1970–1975 | |
| 1975–1980 | |
| 1980–1985 | |
| 1985–1990 | |
| 1990–1995 | |
| 1995–2000 | |
| 2000–2005 | |
| 2005–2010 | |
| 2010–2015 |
Ethnic groups
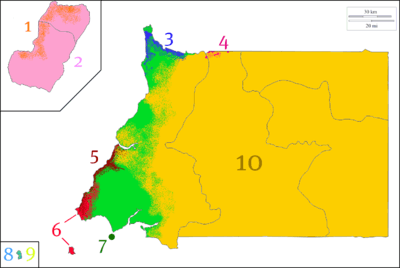
2. Bubi (Bioko Island)
3. Igbo (far northwest)
4. Baka (Acot area)
5. Kwasio (Bujeba)
6. Benga (Playeros)
7. Gabonese (Cocobeach City)
8. Annobonese (mixed Portuguese, Angolan, Spanish)
9. Annobonese Creoles (Annobon Island)
10. Fang
Peoples considered as natives
The majority of the people of Equatorial Guinea are of Bantu origin. The largest ethnic group, the Fang, are indigenous to the mainland, but substantial migration to Bioko Island has resulted in Fang dominance over the earlier Bubi inhabitants. The Fang constitute 80% of the population and are themselves divided into 67 clans. Those in the northern part of Rio Muni speak Fang-Ntumu, while those in the south speak Fang-Okah; the two dialects are mutually unintelligible. The Bubi, who constitute 15% of the population, are indigenous to Bioko Island.
In addition, there are coastal ethnic groups, collectively referred to as Ndowe or "Playeros" ("Beach People" in Spanish): Combes, Bujebas, Balengues and Bengas on the mainland and small islands and a Fernandino community of Krio descended people on Bioko. Together, these groups compose 5% of the population.
Two small groups of Pygmies also inhabit the country, the Beyele and the Bokuign,[6] the former being located in the Altos de Nsork region.[7] Their population is dwindling, them being subjected to heavy pressure from their neighbours, who don't even consider them as human.[8]
Recently immigrated peoples
Some Europeans (largely of Spanish or Portuguese descent) – among them mixed with African ethnicity – also live in the nation. Most Spaniards left after independence.There is a growing number of foreigners from neighboring Cameroon, Nigeria, and Gabon. Equatorial Guinea received Asians and black Africans from other countries as workers on cocoa and coffee plantations.In the late 20th century, Equatorial Guinea became home to more than 80,000 Hispanics from Mexico, Central America, and other Spanish speaking nations in the Americas.Other black Africans came from Liberia, Angola, and Mozambique, and Asians are mostly Chinese with small numbers of Indians. Equatorial Guinea also allowed many fortune-seeking European settlers of other nationalities, including British, French and Germans. After independence, thousands of Equatorial Guineans went to Spain. Another 100,000 Equatorial Guineans went to Cameroon, Gabon, and Nigeria because of dictatorship of Francisco Macías Nguema. Some of its communities also live in Brazil, United States, Portugal, and France.
Languages
Spanish, French and Portuguese are the official languages and spoken as second languages. Spanish is the language of education, and for this reason a majority of the population (about 88%) can speak it, though only about 10–15% have a high competence in the language.[9] Annobonese speak a Portuguese Creole, named Annobonese, as their first language. Asian migrants and descendants of Europeans settlers (mostly Spaniards, Britons and Portuguese) usually speak their ancestral languages along with Spanish. Non-Equatorial Africans usually speak their native languages and their nation's official languages – English and Igbo[10][11] for Nigerians; English for Cameroonians and Liberians; French for Cameroonians and Gabonese; and Portuguese for Angolans and Mozambicans. The latter was made an official language since July 13, 2007. 82% of first foreign language learners choose the French language and 18% the English language.[12] The Roman Catholic Church has greatly influenced both religion and education.
Languages of traditional names
Equatoguineans tend to have both a Spanish first name and an African first and last name. When written, the Spanish and African first names are followed by the father's first name (which becomes the principal surname) and the mother's first name. Thus people may have up to four names, with a different surname for each generation.
CIA World Factbook demographic statistics
The following demographic statistics are from the CIA World Factbook, unless otherwise indicated.
note: 2002 census results claim 1,015,000 residents, although this most likely was inflated in anticipation for the December election.[13]
Population growth rate: 2.703% (2010 est.)
Sex ratio:
at birth:
1.03 male(s)/female
under 15 years:
1.01 male(s)/female
15–64 years:
0.93 male(s)/female
65 years and over:
0.77 male(s)/female
total population:
0.96 male(s)/female (2006 est.)
Life expectancy at birth:
total population:
61.61 years
male:
60.71 years
female:
62.54 years (2010 est.)
Religions: nominally Christian and predominantly Roman Catholic, pagan practices
Literacy:
definition:
age 15 and over can read and write
total population:
87%
male:
93.4%
female:
80.5% (2000 est.)
See also
| Wikimedia Commons has media related to Demographics of Equatorial Guinea. |
References
- ↑ "World Population Prospects: The 2017 Revision". ESA.UN.org (custom data acquired via website). United Nations Department of Economic and Social Affairs, Population Division. Retrieved 10 September 2017.
- 1 2 "Population Division of the Department of Economic and Social Affairs of the United Nations Secretariat, World Population Prospects: The 2010 Revision". Esa.un.org. Retrieved 7 November 2017.
- 1 2 "Encuesta Demográfi ca y de Salud (EDSGE-I) 2011" (PDF). Dhsprogram.com. Retrieved 7 November 2017.
- ↑ "World Population Prospects - Population Division - United Nations". esa.un.org. Retrieved 2018-08-26.
- ↑ "Africa :: EQUATORIAL GUINEA". CIA The World Factbook. Retrieved 7 November 2017.
- ↑ "Archived copy". Archived from the original on 2011-09-14. Retrieved 2011-09-20.
- ↑ Monte Alén-Monts de Cristal Landscape: Ethnic groups. In: Observatoire des Fôrets de l'Afrique Centrale (2006). The Forests of the Congo Basin. The State of the Forest 2006, p. 117.
- ↑ "La página solicitada no existe - Foros". Foroguineoecuatorian.mforos.com. Retrieved 7 November 2017.
- ↑ Gloria Nistal Rosique: El caso del español en Guinea Ecuatorial (in Spanish)
- ↑ "World Directory of Minorities and Indigenous Peoples – Equatorial Guinea : Overview". UNHCR. 20 May 2008. Retrieved 2012-12-18.
- ↑ Dickovick, James Tyler (2012). Africa 2012. Stryker Post. p. 180. ISBN 1-61048-882-2. Retrieved 2012-12-18.
- ↑ "Archived copy". Archived from the original on 2015-04-02. Retrieved 2015-03-27.
- ↑ "Equatorial Guinea". State.gov. Retrieved 7 November 2017.
![]()