Demographics of Tunisia
Tunisia's population was estimated to be just under 10.8 million in 2013.[1] The government has supported a successful family planning program that has reduced the population growth rate to just over 1% per annum, contributing to Tunisia's economic and social stability.[1] The population of Tunisia is primarily of Berber ancestral origin (>60%).[2]
Nearly all Tunisians, around 99 percent of the population, are Muslim adherents.[3] There is a Jewish population on the southern island of Djerba and Tunis. There also exists a small autochthonous group of Christian adherents.[4]
Population
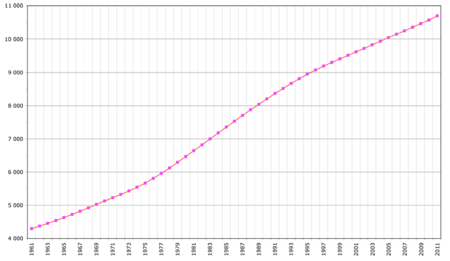
| Historical population | ||
|---|---|---|
| Year | Pop. | ±% |
| 1960 | 4,220,701 | — |
| 1970 | 5,127,000 | +21.5% |
| 1980 | 6,384,000 | +24.5% |
| 1990 | 8,154,400 | +27.7% |
| 2000 | 9,563,500 | +17.3% |
| 2010 | 10,547,000 | +10.3% |
| 2016 | 11,299,400 | +7.1% |
Source: National Institute of Statistics[5] and United Nations Statistics Division[6]
Vital statistics
| Average population | Live births | Deaths | Natural change | Crude birth rate (per 1,000) | Crude death rate (per 1,000) | Natural change (per 1,000) | Fertility rates | |
|---|---|---|---|---|---|---|---|---|
| 1990 | 25.2 | 5.6 | 19.6 | 3.38 | ||||
| 1991 | 24.9 | 5.6 | 19.3 | 3.31 | ||||
| 1992 | 24.9 | 5.5 | 19.5 | 3.27 | ||||
| 1993 | 8 572 200 | 24.0 | 5.7 | 18.3 | 3.12 | |||
| 1994 | 8 785 700 | 22.7 | 5.7 | 17.0 | 2.90 | |||
| 1995 | 8 957 500 | 20.8 | 5.8 | 15.0 | 2.67 | |||
| 1996 | 9 089 300 | 19.7 | 5.5 | 14.2 | 2.51 | |||
| 1997 | 9 214 900 | 18.9 | 5.6 | 13.2 | 2.38 | |||
| 1998 | 9 333 300 | 17.9 | 5.6 | 12.3 | 2.23 | |||
| 1999 | 9 455 900 | 16.9 | 5.7 | 11.2 | 2.09 | |||
| 2000 | 9 552 500 | 17.1 | 5.6 | 11.4 | 2.08 | |||
| 2001 | 9 650 600 | 16.9 | 5.6 | 11.4 | 2.05 | |||
| 2002 | 9 748 900 | 163 011 | 16.7 | 5.8 | 10.8 | 2.00 | ||
| 2003 | 9 839 800 | 168 022 | 17.1 | 6.1 | 11.0 | 2.06 | ||
| 2004 | 9 932 400 | 166 551 | 16.8 | 6.0 | 10.8 | 2.02 | ||
| 2005 | 10 029 000 | 170 999 | 58 673 | 112 326 | 17.1 | 5.9 | 11.2 | 2.04 |
| 2006 | 10 127 900 | 173 390 | 57 000 | 116 390 | 17.1 | 5.6 | 11.5 | 2.03 |
| 2007 | 10 225 100 | 177 503 | 56 741 | 120 762 | 17.4 | 5.5 | 11.8 | 2.04 |
| 2008 | 10 328 900 | 182 990 | 59 975 | 123 015 | 17.7 | 5.8 | 11.9 | 2.06 |
| 2009 | 10 439 600 | 184 282 | 59 499 | 124 783 | 17.7 | 5.7 | 12.0 | 2.05 |
| 2010 | 10 547 100 | 196 039 | 60 438 | 135 601 | 18.6 | 5.7 | 12.9 | 2.13 |
| 2011 | 10 673 800 | 201 120 | 63 258 | 137 862 | 18.8 | 5.9 | 12.9 | 2.15 |
| 2012 | 10 777 500 | 217 738 | 63 257 | 154 481 | 20.2 | 5.9 | 14.3 | 2.4 |
| 2013 | 10 886 500 | 222 962 | 61 730 | 161 232 | 20.5 | 5.7 | 14.8 | 2.4 |
| 2014 | 10 982 754 | 225 887 | 62 785 | 163 102 | 20.5 | 5.7 | 14.8 | 2.42 |
| 2015 | 11 154 370 | 222 530 | 65 743 | 156 787 | 20.0 | 5.9 | 14.1 | 2.3 |
| 2016 | 219 013 | 62 433 | 156 580 | 19.4 | 5.7 | 13.7 | 2.31 |
Structure of the population
Structure of the population (Census 23.IV.2014):[7]
| Age Group | Male | Female | Total | Percent |
|---|---|---|---|---|
| Total | 5 472 333 | 5 510 420 | 10 982 753 | 100 |
| 0–4 | 505 509 | 466 662 | 972 171 | 8.85 |
| 5–9 | 440 644 | 408 362 | 849 006 | 7.73 |
| 10–14 | 407 938 | 381 684 | 789 622 | 7.19 |
| 15–19 | 421 716 | 405 792 | 827 508 | 7.53 |
| 20–24 | 459 814 | 465 595 | 925 409 | 8.43 |
| 25–29 | 449 932 | 484 685 | 934 617 | 8.51 |
| 30–34 | 477 322 | 506 459 | 983 781 | 8.96 |
| 35–39 | 397 594 | 419 392 | 816 986 | 7.44 |
| 40–44 | 357 353 | 370 495 | 727 848 | 6.63 |
| 45–49 | 331 283 | 351 673 | 682 956 | 6.22 |
| 50–54 | 324 423 | 326 185 | 650 608 | 5.92 |
| 55–59 | 268 380 | 266 788 | 535 168 | 4.87 |
| 60–64 | 212 900 | 212 524 | 425 424 | 3.87 |
| 65–69 | 127 168 | 135 135 | 262 303 | 2.39 |
| 70–74 | 107 097 | 113 584 | 220 681 | 2.01 |
| 75–79 | 81 732 | 85 164 | 166 896 | 1.52 |
| 80+ | 101 528 | 110 241 | 211 769 | 1.93 |
| Age group | Male | Female | Total | Percent |
|---|---|---|---|---|
| 0–14 | 1 354 091 | 1 256 708 | 2 610 799 | 23.77 |
| 15–64 | 3 700 717 | 3 809 588 | 7 510 305 | 68.38 |
| 65+ | 417 525 | 444 124 | 861 649 | 7.85 |
Population
The population of Tunisia is primarily of Berber ancestral origin (>60%).[2] Whilst the Ottoman influence has been particularly significant in forming the Turco-Tunisian community, other peoples have also migrated to Tunisia during different periods of time, including Sub-Saharan Africans, Greeks, Romans, Phoenicians (Punics), Jews, and French settlers. The Tunisian , by 1870 the distinction between the Arabic-speaking mass and the Turkish elite had blurred[8] and today the overwhelming majority, of about 98%,[3][9] simply identify themselves collectively as Arabs.[10] There is also a small purely Berber (1% at most)[11] population located in the Dahar mountains and on the island of Djerba in the south-east and in the Khroumire mountainous region in the north-west.
From the late 19th century to after World War II, Tunisia was home to large populations of French and Italians (255,000 Europeans in 1956),[12] although nearly all of them, along with the Jewish population, left after Tunisia became independent. The history of the Jews in Tunisia goes back some 2,000 years. In 1948 the Jewish population was an estimated 105,000, but by 2013 only about 900 remained.[13]
The first people known to history in what is now Tunisia were the Berbers. Numerous civilizations and peoples have invaded, migrated to, or have been assimilated into the population over the millennia, with influences of population from Phoenicians/Carthaginians, Romans, Vandals, Arabs, Spaniards, Ottoman Turks and Janissaries, and French. There was a continuing inflow of nomadic Arab tribes from Arabia.[14]
After the Reconquista and expulsion of non-Christians and Moriscos from Spain, many Spanish Muslims and Jews also arrived. According to Matthew Carr, "As many as eighty thousand Moriscos settled in Tunisia, most of them in and around the capital, Tunis, which still contains a quarter known as Zuqaq al-Andalus, or Andalusia Alley."[15]
Life expectancy
| Period | Life expectancy in Years |
Period | Life expectancy in Years |
|---|---|---|---|
| 1950–1955 | 38.8 | 1985–1990 | 67.1 |
| 1955–1960 | 40.7 | 1990–1995 | 70.3 |
| 1960–1965 | 43.7 | 1995–2000 | 72.4 |
| 1965–1970 | 48.3 | 2000–2005 | 73.7 |
| 1970–1975 | 54.1 | 2005–2010 | 74.6 |
| 1975–1980 | 59.4 | 2010–2015 | 75.0 |
| 1980–1985 | 64.3 |
Source: UN World Population Prospects[16]
Genetic
While the many modern Tunisians identify themselves as Arab, they are predominantly genetically descended from Berber groups, with substantial Phoenician/Punic, Arab and Western European input. Tunisians are also descended, to a much lesser extent, from other African, Middle Eastern and/or European peoples. In sum, a little less than 20 percent of their genetic material (Y-chromosome analysis) comes from the present day Levant, Arabia, Europe or West Africa.[17][18]
"In fact, the Tunisian genetic distances to European samples are smaller than those to North African groups. (...) This could be explained by the history of the Tunisian population, reflecting the influence of the ancient Punic settlers of Carthage followed, among others, by Roman, Byzantine, Arab and French occupations, according to historical records. Notwithstanding, other explanations cannot be discarded, such as the relative heterogeneity within current Tunisian populations, and/or the limited sub-Saharan genetic influence in this region as compared with other North African areas, without excluding the possibility of the genetic drift, whose effect might be particularly amplified on the X chromosome.",[19][20] This suggests a fairly significant Middle Eastern and European input to Tunisian genetics compared to other neighbouring populations.
However, later research has suggested instead that Tunisians exhibit a mostly indigenous North African genetic make up similar to other Northwest African populations; characterized by a high amount of native Northwest African genes, but with higher Middle Eastern input than in Algeria or Morocco.[21]
Y-Chromosome
Listed here are the human Y-chromosome DNA haplogroups in Tunisia.[22]
| Haplogroup | n | B | E1a | E1b1a | E1b1b1 | E1b1b1a3 | E1b1b1a4 | E1b1b1b | E1b1b1c | F | G | I | J1 | J2 | K | P,R | R1a1 | R1b1a | R1b1b | T |
| Marker | M33 | M2 | M35 | V22 | V65 | M81 | M34 | M89 | M201 | V88 | M269 | M70 | ||||||||
| Tunisia | 601 | 0.17 | 0.5 | 0.67 | 1.66 | 3 | 3.16 | 62.73 | 1.16 | 2.66 | 0.17 | 0.17 | 16.64 | 2.83 | 0.33 | 0.33 | 0.5 | 1.83 | 0.33 | 1.16 |
CIA World Factbook demographic statistics
The following demographic statistics are from the CIA World Factbook, unless otherwise indicated.
Nationality
- noun:Tunisian(s)
- adjective:Tunisian
Vital Statistics
Age structure
- 0–14 years: 22.2% (male 1,213,664/female 1,137,084)
- 15–64 years: 70.5% (male 3,759,955/female 3,704,677)
- 65 years and over: 7.3% (male 358,447/female 415,198) (2010 est.)
- 0-14 years: 23.2% (male 1,274,348/female 1,193,131)
- 15-64 years: 69.3% (male 3,638,014/female 3,728,294)
- 65 years and over: 7.5% (male 390,055/female 405,344) (2011 est.)
Net migration rate
- -0.41 migrant(s)/1,000 population (2010 est.)
- -1.78 migrant(s)/1,000 population (2012 est.)
Urbanization
- urban population: 67% of total population (2010)
- rate of urbanization: 1.5% annual rate of change (2010-15 est.)
Sex ratio
- at birth: 1.07 male(s)/female
- under 15 years: 1.07 male(s)/female
- 15-64 years: 0.97 male(s)/female
- 65 years and over: 0.96 male(s)/female
- total population: 0.99 male(s)/female (2012 est.)
Infant mortality rate
- 22.5 deaths/1,000 live births (2010 est.)
Life expectancy at birth
- total population: 75.24 years
- male: 73.2 years
- female: 77.42 years (2012 est.)
Ethnic groups
Languages
Literacy
definition:
age 15 and over can read and write
total population:
81.8%
male:
89.6%
female:
74.2% (2015 est.)
The literacy rate among the Tunisian population increased greatly after its independence from France. According to the 1996 census data,[24] the literacy rate of the last generation of Tunisian men educated under the French rule (those born 1945-49) was less than 65%. For the first generation educated after independence (born 1950-1954), literacy in Arabic among males had increased to nearly 80%. (Sixty-two percent were also literate in French and 15 percent literate in English). Among the youngest generation included in the census (those born 1980-1984), 96.6% were literate in Arabic.
Among Tunisian women, the increase in literacy was even greater. The literacy rate among the last generation of women educated under the French was less than 30%. In the first generation educated after independence, this increased to just over 40%. For the youngest generation of women cited (born 1980-1984), literacy in Arabic had increased to slightly over 90%; over 70% of women were also literate in French.[25]
References
- 1 2 "Tunisia (03/09/12)". US Department of State. 9 March 2012. Archived from the original on 13 October 2012.
- 1 2 3 Tej K. Bhatia, William C. Ritchie (2006). The Handbook of Bilingualism. John Wiley & Sons. p. 860. ISBN 0631227350. Retrieved 15 August 2017.
- 1 2 "CIA – The World Factbook — Tunisia". Retrieved 2007-01-13.
- 1 2 International Religious Freedom Report 2007: Tunisia. United States Bureau of Democracy, Human Rights and Labor (September 14, 2007). This article incorporates text from this source, which is in the public domain.
- ↑ National Institute of Statistics - Tunisia
- ↑ "United Nations Statistics Division - Demographic and Social Statistics". United Nations Statistics Division. Retrieved 28 March 2016.
- ↑ Division, United Nations Statistics. "UNSD — Demographic and Social Statistics". unstats.un.org. Retrieved 18 April 2018.
- ↑ Green, Arnold H. (1978), The Tunisian Ulama 1873–1915: Social Structure and Response to Ideological Currents, BRILL, p. 69, ISBN 90-04-05687-4
- ↑ Turchi, C; Buscemi, L; Giacchino, E; Onofri, V; Fendt, L; Parson, W; Tagliabracci, A (2009). "Polymorphisms of mtDNA control region in Tunisian and Moroccan populations: An enrichment of forensic mtDNA databases with Northern Africa data". Forensic Science International: Genetics. 3 (3): 166–72. doi:10.1016/j.fsigen.2009.01.014. PMID 19414164.
- ↑ Bouhadiba, M.A. (28 January 2010). "Le Tunisien: une dimension méditerranéenne qu'atteste la génétique" (in French). Lapresse.tn. Archived from the original on 22 July 2012. Retrieved 19 January 2013.
- ↑ "Q&A: The Berbers". BBC News. 12 March 2004. Retrieved 19 January 2013.
- ↑ Angus Maddison (20 September 2007). Contours of the World Economy 1–2030 AD:Essays in Macro-Economic History: Essays in Macro-Economic History. OUP Oxford. p. 214. ISBN 978-0-19-922721-1. Retrieved 26 January 2013.
- ↑ "The Jews of Tunisia". Jewish Virtual Library. Retrieved 11 July 2014.
- ↑ Stearns, Peter N.; Leonard Langer, William (2001). The Encyclopedia of World History: Ancient, Medieval, and Modern, Chronologically Arranged (6 ed.). Houghton Mifflin Harcourt. pp. 129–131. ISBN 0-395-65237-5.
- ↑ Carr, Matthew (2009). Blood and faith: the purging of Muslim Spain. The New Press. p. 290. ISBN 1-59558-361-0.
- ↑ "World Population Prospects – Population Division – United Nations". Retrieved 2017-07-15.
- ↑ "Archived copy" (PDF). Archived from the original (PDF) on 2012-04-14. Retrieved 2016-05-24.
- ↑ Cruciani, Fulvio; et al. (May 2004). "Phylogeographic Analysis of Haplogroup E3b (E-M215) Y Chromosomes Reveals Multiple Migratory Events Within and Out Of Africa". The American Journal of Human Genetics. 74 (5): 1014–1022. doi:10.1086/386294. PMC 1181964. PMID 15042509. Retrieved 24 May 2016.
- ↑ The X chromosome Alu insertions as a tool for human population genetics: data from European and African human groups, Athanasiadis et al. 2007
- ↑ Tomas C, Sanchez JJ, Barbaro A, et al. (2008). "X-chromosome SNP analyses in 11 human Mediterranean populations show a high overall genetic homogeneity except in North-west Africans (Moroccans)". BMC Evol. Biol. 8: 75. doi:10.1186/1471-2148-8-75. PMC 2315647. PMID 18312628.
Tunisians did not show a significant level of differentiation with northern populations as mentioned by others
- ↑ "Mitochondrial DNA and Y-chromosome microstructure in Tunisia".
- ↑ Bekada, A; Fregel, R; Cabrera, VM; Larruga, JM; Pestano, J; et al. (2013). "Introducing the Algerian Mitochondrial DNA and Y-Chromosome Profiles into the North African Landscape". PLoS ONE. 8 (2): e56775. doi:10.1371/journal.pone.0056775. PMC 3576335. PMID 23431392.
- 1 2 3 4 5 "Africa :: TUNISIA". CIA The World Factbook. Archived from the original on 2012-10-16.
- ↑ As , Walters Keith (2003). "Fergie's prescience: the changing nature of diglossia in Tunisia". International Journal of the Society of Language. 163: 85–87.
- ↑ The children born in the early 1980s had not yet begun English instruction by the time of the 1996 census, so no literacy rate in English is given. However, the children born between 1970-74 (who had completed their education) had a literacy in English of 20%. It's highly likely that the younger generation's literacy in English was even higher at the conclusion of their schooling. Walters 86.