Demographics of the Republic of the Congo
This article is about the demographic features of the population of the Republic of the Congo, including population density, ethnicity, education level, health of the populace, economic status, religious affiliations and other aspects of the population.
The Republic of the Congo's sparse population is concentrated in the southwestern portion of the country, leaving the vast areas of tropical jungle in the north virtually uninhabited. Thus, Congo is one of the most urbanized countries in Africa, with 85% of its total population living in a few urban areas, namely in Brazzaville, Pointe-Noire, or one of the small cities or villages lining the 534-kilometre (332 mi) railway which connects the two cities. In rural areas, industrial and commercial activity has declined rapidly in recent years, leaving rural economies dependent on the government for support and subsistence. Before the 1997 war, about 15,000 Europeans and other non-Africans lived in Congo, most of whom were French. Presently, only about 9,500 remain. Pygmies make up 2% of Congo's population.[1]
Population
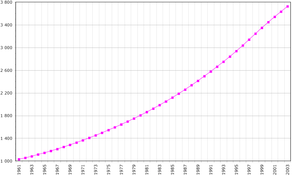
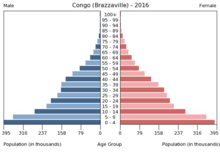
According to the 2017 revision of the World Population Prospects[2] the total population was 5,125,821 in 2016, compared to only 808 000 in 1950. The proportion of children below the age of 15 in 2010 was 40.6%, 55.7% was between 15 and 65 years of age, while 3.7% was 65 years or older .[3]
| Total population | Population aged 0–14 (%) | Population aged 15–64 (%) | Population aged 65+ (%) | |
|---|---|---|---|---|
| 1950 | 808 000 | 40.1 | 56.4 | 3.5 |
| 1955 | 899 000 | 40.5 | 55.9 | 3.6 |
| 1960 | 1 014 000 | 41.4 | 55.0 | 3.7 |
| 1965 | 1 158 000 | 42.5 | 53.7 | 3.8 |
| 1970 | 1 335 000 | 43.5 | 52.7 | 3.8 |
| 1975 | 1 555 000 | 44.2 | 52.0 | 3.8 |
| 1980 | 1 798 000 | 44.8 | 51.4 | 3.8 |
| 1985 | 2 081 000 | 44.6 | 51.7 | 3.7 |
| 1990 | 2 389 000 | 43.7 | 52.5 | 3.7 |
| 1995 | 2 733 000 | 42.5 | 53.7 | 3.7 |
| 2000 | 3 136 000 | 41.5 | 54.7 | 3.7 |
| 2005 | 3 533 000 | 41.3 | 55.0 | 3.7 |
| 2010 | 4 043 000 | 40.6 | 55.7 | 3.7 |
Vital statistics
Registration of vital events in the Republic of the Congo is incomplete. The Population Departement of the United Nations prepared the following estimates. [3]
| Period | Live births per year | Deaths per year | Natural change per year | CBR* | CDR* | NC* | TFR* | IMR* |
|---|---|---|---|---|---|---|---|---|
| 1950-1955 | 36 000 | 18 000 | 18 000 | 42.2 | 20.9 | 21.4 | 5.68 | 142 |
| 1955-1960 | 40 000 | 17 000 | 23 000 | 42.3 | 18.3 | 24.0 | 5.79 | 123 |
| 1960-1965 | 46 000 | 18 000 | 29 000 | 42.8 | 16.2 | 26.6 | 5.99 | 107 |
| 1965-1970 | 54 000 | 18 000 | 35 000 | 43.1 | 14.8 | 28.3 | 6.19 | 97 |
| 1970-1975 | 62 000 | 20 000 | 43 000 | 43.1 | 13.7 | 29.4 | 6.29 | 89 |
| 1975-1980 | 72 000 | 21 000 | 50 000 | 42.7 | 12.8 | 29.9 | 6.29 | 83 |
| 1980-1985 | 79 000 | 23 000 | 56 000 | 40.9 | 12.0 | 29.0 | 5.99 | 78 |
| 1985-1990 | 87 000 | 26 000 | 61 000 | 38.9 | 11.4 | 27.4 | 5.55 | 73 |
| 1990-1995 | 97 000 | 31 000 | 66 000 | 37.8 | 12.1 | 25.6 | 5.21 | 74 |
| 1995-2000 | 111 000 | 37 000 | 74 000 | 37.7 | 12.6 | 25.1 | 5.01 | 75 |
| 2000-2005 | 124 000 | 42 000 | 82 000 | 37.2 | 12.5 | 24.6 | 4.85 | 75 |
| 2005-2010 | 136 000 | 44 000 | 92 000 | 36.0 | 11.7 | 24.3 | 4.64 | 72 |
| * CBR = crude birth rate (per 1000); CDR = crude death rate (per 1000); NC = natural change (per 1000); IMR = infant mortality rate per 1000 births; TFR = total fertility rate (number of children per woman) | ||||||||
Fertility and Births
Total Fertility Rate (TFR) (Wanted Fertility Rate) and Crude Birth Rate (CBR):[4]
| Year | CBR (Total) | TFR (Total) | CBR (Urban) | TFR (Urban) | CBR (Rural) | TFR (Rural) |
|---|---|---|---|---|---|---|
| 2005 | 40,0 | 4,8 (4,4) | 34,6 | 3,8 (3,5) | 46,1 | 6,1 (5,7) |
| 2011-2012 | 41,4 | 5,1 (4,5) | 40,6 | 4,5 (4,1) | 42,8 | 6,5 (5,5) |
Fertility data as of 2011-2012 (DHS Program):[5]
| Department | Total fertility rate | Percentage of women age 15-49 currently pregnant | Mean number of children ever born to women age 40-49 |
|---|---|---|---|
| Kouilou | 6.8 | 11.4 | 6.2 |
| Niari | 5.9 | 11.9 | 5.4 |
| Lékoumou | 6.5 | 9.9 | 5.7 |
| Bouenza | 5.7 | 8.5 | 5.6 |
| Pool | 6.4 | 10.2 | 5.5 |
| Plateaux | 6.3 | 11.4 | 5.6 |
| Cuvette | 6.4 | 12.5 | 5.6 |
| Cuvette-Ouest | 6.0 | 10.1 | 6.1 |
| Sangha | 5.8 | 11.9 | 5.4 |
| Likouala | 7.0 | 11.7 | 6.4 |
| Brazzaville | 4.3 | 8.7 | 4.3 |
| Pointe-Noire | 4.6 | 9.2 | 4.5 |
Ethnic groups
Languages
- French (official), Lingala and Monokutuba (lingua franca trade languages), many local languages and dialects (of which Kikongo is the most widespread)
- The majority of the population is concentrated along the railroad between Pointe-Noire and Brazzaville in the south where Kituba (a creole language based on Kikongo) is the primary language. Lingala is influential in the sparsely inhabited northern half of the country.
Religion
- Roman Catholic 33.1%, Awakening Churches/Christian Revival 22.3%, Protestant 19.9%, Salutiste 2.2%, Islam 1.6%, Kimbanguiste 1.5%, Other 8.1%, None 11.3% (2010 est.)[6]
Health
Life expectancy for the population was estimated at 54.91 years in 2011: 53.62 for males and 56.25 for females. The adult prevalence rate for HIV/AIDS was 3.4% as of 2009, representing 77,000 people living with the disease and 5,100 deaths. The Republic of Congo is considered to have a high degree of risk of infectious diseases, particularly bacterial diarrhea, hepatitis A and typhoid fever (all food- or waterborne), and malaria (vectorborne).
| Period | Life expectancy in Years[7] |
|---|---|
| 1950–1955 | 43.15 |
| 1955–1960 | |
| 1960–1965 | |
| 1965–1970 | |
| 1970–1975 | |
| 1975–1980 | |
| 1980–1985 | |
| 1985–1990 | |
| 1990–1995 | |
| 1995–2000 | |
| 2000–2005 | |
| 2005–2010 | |
| 2010–2015 |
Education
As of 2003, 83.8% of the adult population was considered literate, consisting 89.3% of males and 78.4% of females.
CIA World Factbook demographic statistics
The following demographic statistics are from the CIA World Factbook,[8] unless otherwise indicated.
Age structure
- 0-14 years: 41.67% (male 1,041,761/female 1,022,763)
- 15-24 years: 17.1% (male 424,521/female 422,755)
- 25-54 years: 33.89% (male 843,856/female 835,041)
- 55-64 years: 4.29% (male 106,776/female 105,573)
- 65 years and over: 3.06% (male 66,962/female 84,666) (2017 est.)
Median age
- total: 19.7 years
- male: 19.5 years
- female: 19.8 years (2017 est.)
Birth rate
- 34.4 births/1,000 population (2017 est.)
Death rate
- 9.5 deaths/1,000 population (2017 est.)
Population growth rate
- 2.11% (2017 est.)
Urbanization
- urban population: 66.9% of total population (2018)
- rate of urbanisation: 3.28% annual rate of change (2015-20 est.)
Sex ratio
- at birth: 1.02 male(s)/female
- 0-14 years: 1.02 male(s)/female
- 15-24 years: 1 male(s)/female
- 25-54 years: 1.01 male(s)/female
- 55-64 years: 0.99 male(s)/female
- 65 years and over: 0.78 male(s)/female
- total population: 1.01 male(s)/female (2017 est.)
Infant mortality rate
- total: 54.9 deaths/1,000 live births
- male: 59.8 deaths/1,000 live births
- female: 49.9 deaths/1,000 live births (2017 est.)
Life expectancy at birth
- total population: 59.8 years
- male: 58.6 years
- female: 61.1 years (2017 est.)
HIV/AIDS
- Adult prevalence rate: 3.1% (2017 est.)
- People living with HIV/AIDS: 100,000 (2017 est.)
- HIV/AIDS deaths: 4,900(2017 est.)
Obesity - adult prevalence rate
- 9.6% (2016)
Children under the age of 5 years underweight
- 12.3% (2015)
References
| Wikimedia Commons has media related to Demographics of the Republic of the Congo. |
- ↑ "Les pygmées du Congo en "danger d'extinction"". 5 August 2011 – via Le Monde.
- ↑ "World Population Prospects: The 2017 Revision". ESA.UN.org (custom data acquired via website). United Nations Department of Economic and Social Affairs, Population Division. Retrieved 10 September 2017.
- 1 2 Population Division of the Department of Economic and Social Affairs of the United Nations Secretariat, World Population Prospects: The 2010 Revision Archived May 6, 2011, at the Wayback Machine.
- ↑ "MEASURE DHS: Demographic and Health Surveys". microdata.worldbank.org.
- ↑ "Enquête Démographique et de Santé 2011-2012" (PDF). Dhsprogram.com. Retrieved 7 November 2017.
- 1 2 "Africa :: CONGO, REPUBLIC OF THE". CIA The World Factbook.
- ↑ "World Population Prospects - Population Division - United Nations". esa.un.org. Retrieved 2018-08-26.
- ↑ "The World Factbook — Central Intelligence Agency". www.cia.gov. Retrieved 2018-09-24.
![]()