Demographics of Mauritania
This article is about the demographic features of the population of Mauritania, including population density, ethnicity, education level, health of the populace, economic status, religious affiliations and other aspects of the population.
Population
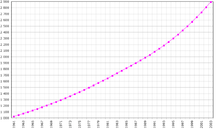
According to the 2017 revision of the World Population Prospects[1], the total population was 4,301,018 in 2016, compared to only 657 000 in 1950. The proportion of children below the age of 15 in 2010 was 39.9%, 57.4% was between 15 and 65 years of age, while 2.7% was 65 years or older.[2]
| Total population (x 1000) | Population aged 0–14 (%) | Population aged 15–64 (%) | Population aged 65+ (%) | |
|---|---|---|---|---|
| 1950 | 657 | 43.8 | 54.8 | 1.4 |
| 1955 | 744 | 43.6 | 54.7 | 1.6 |
| 1960 | 854 | 44.3 | 53.8 | 1.8 |
| 1965 | 984 | 45.2 | 52.8 | 2.0 |
| 1970 | 1 134 | 45.8 | 52.1 | 2.2 |
| 1975 | 1 312 | 45.8 | 51.9 | 2.3 |
| 1980 | 1 518 | 45.6 | 51.9 | 2.4 |
| 1985 | 1 748 | 45.3 | 52.2 | 2.5 |
| 1990 | 1 996 | 44.9 | 52.5 | 2.6 |
| 1995 | 2 292 | 44.0 | 53.4 | 2.7 |
| 2000 | 2 643 | 42.7 | 54.6 | 2.7 |
| 2005 | 3 047 | 41.2 | 56.1 | 2.7 |
| 2010 | 3 460 | 39.9 | 57.4 | 2.7 |
Structure of the population[3]
Structure of the population (24.03.2013) (Census, complete tabulation) :
| Age Group | Male | Female | Total | % |
|---|---|---|---|---|
| Total | 1 743 074 | 1 794 294 | 3 537 368 | 100 |
| 0-4 | 316 217 | 298 475 | 614 692 | 17,38 |
| 5-9 | 263 263 | 256 839 | 520 102 | 14,70 |
| 10-14 | 212 838 | 216 667 | 429 505 | 12,14 |
| 15-19 | 176 116 | 185 288 | 361 404 | 10,22 |
| 20-24 | 144 478 | 157 962 | 302 440 | 8,55 |
| 25-29 | 121 586 | 135 767 | 257 353 | 7,28 |
| 30-34 | 99 834 | 113 691 | 213 525 | 6,04 |
| 35-39 | 83 578 | 95 379 | 178 957 | 5,06 |
| 40-44 | 72 108 | 79 228 | 151 336 | 4,28 |
| 45-49 | 60 297 | 64 516 | 124 813 | 3,53 |
| 50-54 | 50 739 | 51 751 | 102 490 | 2,90 |
| 55-59 | 41 075 | 40 645 | 81 720 | 2,31 |
| 60-64 | 31 660 | 30 459 | 62 119 | 1,76 |
| 65-69 | 24 120 | 23 055 | 47 175 | 1,33 |
| 70-74 | 18 167 | 17 129 | 35 296 | 1,00 |
| 75-79 | 12 670 | 12 231 | 24 901 | 0,70 |
| 80-84 | 8 080 | 8 584 | 16 664 | 0,47 |
| 85+ | 6 248 | 6 628 | 12 876 | 0,36 |
| Age group | Male | Female | Total | Percent |
|---|---|---|---|---|
| 0-14 | 792 318 | 771 981 | 1 564 299 | 44,22 |
| 15-64 | 881 471 | 954 686 | 1 836 157 | 51,91 |
| 65+ | 69 285 | 67 627 | 136 912 | 3,87 |
Vital statistics
Registration of vital events in Mauritania is incomplete. The Population Departement of the United Nations prepared the following estimates. [2]
| Period | Live births per year | Deaths per year | Natural change per year | CBR* | CDR* | NC* | TFR* | IMR* |
|---|---|---|---|---|---|---|---|---|
| 1950-1955 | 34 000 | 16 000 | 18 000 | 48.6 | 23.4 | 25.1 | 6.34 | 151 |
| 1955-1960 | 40 000 | 18 000 | 22 000 | 50.2 | 22.2 | 28.0 | 6.71 | 149 |
| 1960-1965 | 45 000 | 19 000 | 26 000 | 49.3 | 20.7 | 28.6 | 6.79 | 147 |
| 1965-1970 | 51 000 | 20 000 | 31 000 | 47.9 | 19.1 | 28.8 | 6.79 | 143 |
| 1970-1975 | 57 000 | 20 000 | 37 000 | 46.5 | 16.3 | 30.2 | 6.75 | 133 |
| 1975-1980 | 63 000 | 20 000 | 43 000 | 44.7 | 14.2 | 30.4 | 6.57 | 113 |
| 1980-1985 | 70 000 | 20 000 | 49 000 | 42.6 | 12.4 | 30.1 | 6.28 | 93 |
| 1985-1990 | 77 000 | 22 000 | 56 000 | 41.3 | 11.6 | 29.7 | 6.06 | 81 |
| 1990-1995 | 86 000 | 23 000 | 62 000 | 40.0 | 11.0 | 29.0 | 5.78 | 77 |
| 1995-2000 | 94 000 | 26 000 | 68 000 | 38.2 | 10.6 | 27.6 | 5.40 | 76 |
| 2000-2005 | 104 000 | 29 000 | 75 000 | 36.6 | 10.3 | 26.3 | 5.05 | 77 |
| 2005-2010 | 113 000 | 33 000 | 81 000 | 34.8 | 10.1 | 24.8 | 4.71 | 77 |
| * CBR = crude birth rate (per 1000); CDR = crude death rate (per 1000); NC = natural change (per 1000); TFR = total fertility rate (number of children per woman; IMR = infant mortality rate per 1000 births) | ||||||||
Fertility and Births
Total Fertility Rate (TFR) (Wanted Fertility Rate) and Crude Birth Rate (CBR):[4]
| Year | CBR (Total) | TFR (Total) | CBR (Urban) | TFR (Urban) | CBR (Rural) | TFR (Rural) |
|---|---|---|---|---|---|---|
| 2000-2001 | 32,1 | 4,7 (4,3) | 31,9 | 4,3 (3,9) | 32,1 | 5,0 (4,7) |
| 2003-2004 | 4,6 | 4,1 | 5,1 | |||
Fertility data as of 2010 (DHS Program):[5]
| Zone | Total fertility rate | Percentage of women age 15-49 currently pregnant | Mean number of children ever born to women age 40-49 |
|---|---|---|---|
| Nouakchott | 4.3 | 8.0 | 5.7 |
| Sud-Est | 5.0 | 10.4 | 5.2 |
| Fleuve | 5.1 | 8.5 | 6.0 |
| Nord | 4.6 | 7.1 | 6.5 |
| Centre | 4.0 | 6.7 | 6.1 |
Life expectancy
| Period | Life expectancy in Years[6] |
|---|---|
| 1950–1955 | 41.72 |
| 1955–1960 | |
| 1960–1965 | |
| 1965–1970 | |
| 1970–1975 | |
| 1975–1980 | |
| 1980–1985 | |
| 1985–1990 | |
| 1990–1995 | |
| 1995–2000 | |
| 2000–2005 | |
| 2005–2010 | |
| 2010–2015 |
CIA World Factbook demographic statistics[7]
Population: 3,381,634 (June 2011 est.)
Median age:
- total: 19.3 years
- male: 18.5 years
- female: 20.2 years (2010 est.)
Population growth rate: 2.349% (2011 est.)
Sex ratio:
- at birth: 1.03 male(s)/female
- under 15 years: 1.01 male(s)/female
- 15–64 years: 0.89 male(s)/female
- 65 years and over: 0.74 male(s)/female
- total population: 0.93 male(s)/female (2010 est.)
Life expectancy at birth:
- total population: 60.75 years
- male: 58.57 years
- female: 62.99 years (2010 est.)
HIV/AIDS - people living with HIV/AIDS: 9,500 (2003 est.)
HIV/AIDS - deaths: less than 500 (2003 est.)
Nationality: noun: Mauritanian(s) adjective: Mauritanian
Ethnic groups:[7] Haratins 40%, Bidhan 30%, West Africans (non-Arabic speaking, Halpulaar, Soninke, Wolof, Bamara) 30%
Religions[7] Islam (official) 100%
Languages:[7] Arabic (official and national), French (widely used in media and among educated classes), Pulaar, Soninke, Wolof, Serer.[8]
Literacy: definition: age 15 and over can read and write
- total population: 51.2%
- male: 59.5%
- female: 43.4% (2000 census)
References
- ↑ "World Population Prospects: The 2017 Revision". ESA.UN.org (custom data acquired via website). United Nations Department of Economic and Social Affairs, Population Division. Retrieved 10 September 2017.
- 1 2 Population Division of the Department of Economic and Social Affairs of the United Nations Secretariat, World Population Prospects: The 2010 Revision Archived May 6, 2011, at the Wayback Machine.
- ↑ http://unstats.un.org/unsd/demographic/products/dyb/dyb2.htm
- ↑ http://microdata.worldbank.org/index.php/catalog/1445
- ↑ http://dhsprogram.com/pubs/pdf/FR256/FR256.pdf
- ↑ "World Population Prospects - Population Division - United Nations". esa.un.org. Retrieved 2018-08-26.
- 1 2 3 4 "Africa ::MAURITANIA". CIA The World Factbook.
- ↑ Joshua project Serer of Mauritania
External links
| Wikimedia Commons has media related to Demographics of Mauritania. |