Marion County, Georgia
Marion County is a county located in the west central portion of the U.S. state of Georgia. As of the 2010 Census reflected a population of 8,742.[1] The county seat is Buena Vista.[2] The county was created on December 14, 1827. The county was named for General Francis Marion of South Carolina.[3]
Marion County | |
|---|---|
_Buena_Vista%2C_GA.JPG) Marion County Courthouse in Buena Vista | |
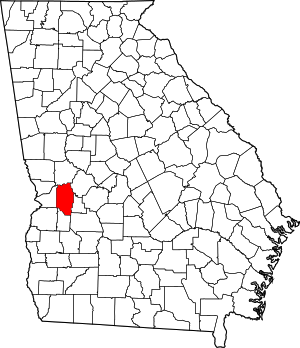 Location within the U.S. state of Georgia | |
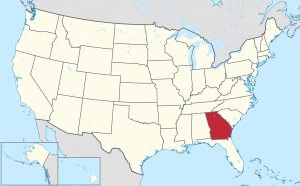 Georgia's location within the U.S. | |
| Coordinates: 32°21′N 84°32′W | |
| Country | |
| State | |
| Founded | December 14, 1827 |
| Seat | Buena Vista |
| Largest city | Buena Vista |
| Area | |
| • Total | 367 sq mi (950 km2) |
| • Land | 366 sq mi (950 km2) |
| • Water | 1.5 sq mi (4 km2) |
| Population | |
| • Estimate (2018) | 8,351 |
| • Density | 24/sq mi (9/km2) |
| Time zone | UTC−5 (Eastern) |
| • Summer (DST) | UTC−4 (EDT) |
| Congressional district | 2nd |
| Website | www |
Marion County is included in the Columbus, GA-AL Metropolitan Statistical Area.
The art site of Pasaquan is located in Marion County.
Geography
According to the U.S. Census Bureau, the county has a total area of 367 square miles (950 km2), of which 366 square miles (950 km2) is land and 1.5 square miles (3.9 km2) (0.4%) is water.[4]
The southern half of Marion County, roughly south of Buena Vista, is located in the Kinchafoonee-Muckalee sub-basin of the ACF River Basin (Apalachicola-Chattahoochee-Flint River Basin). The northwestern portion of the county is located in the Middle Chattahoochee River-Walter F. George Lake sub-basin of the same ACF River Basin. The majority of the northeastern portion of Marion County is located in the Middle Flint River sub-basin of the larger ACF River Basin, with just very small portions of the northeastern border, most of which is bisected by State Route 127 south of Mauk, located in the Upper Flint River sub-basin of the same larger ACF River Basin.[5]
Major highways


Adjacent counties
- Talbot County (north)
- Taylor County (northeast)
- Schley County (east)
- Sumter County (southeast)
- Webster County (south)
- Chattahoochee County (west)
Demographics
| Historical population | |||
|---|---|---|---|
| Census | Pop. | %± | |
| 1830 | 1,436 | — | |
| 1840 | 4,812 | 235.1% | |
| 1850 | 10,280 | 113.6% | |
| 1860 | 7,390 | −28.1% | |
| 1870 | 8,000 | 8.3% | |
| 1880 | 8,598 | 7.5% | |
| 1890 | 7,728 | −10.1% | |
| 1900 | 10,080 | 30.4% | |
| 1910 | 9,147 | −9.3% | |
| 1920 | 7,604 | −16.9% | |
| 1930 | 6,968 | −8.4% | |
| 1940 | 6,954 | −0.2% | |
| 1950 | 6,521 | −6.2% | |
| 1960 | 5,477 | −16.0% | |
| 1970 | 5,099 | −6.9% | |
| 1980 | 5,297 | 3.9% | |
| 1990 | 5,590 | 5.5% | |
| 2000 | 7,144 | 27.8% | |
| 2010 | 8,742 | 22.4% | |
| Est. 2018 | 8,351 | [6] | −4.5% |
| U.S. Decennial Census[7] 1790-1960[8] 1900-1990[9] 1990-2000[10] 2010-2013[1] | |||
2000 census
As of the census[11] of 2000, there were 7,144 people, 2,668 households, and 1,912 families living in the county. The population density was 20 people per square mile (8/km²). There were 3,130 housing units at an average density of 8 per square mile (3/km²). The racial makeup of the county was 60.85% White, 34.07% Black or African American, 0.36% Native American, 0.18% Asian, 0.17% Pacific Islander, 2.95% from other races, and 1.41% from two or more races. 5.78% of the population were Hispanic or Latino of any race.
There were 2,668 households out of which 35.30% had children under the age of 18 living with them, 51.60% were married couples living together, 15.10% had a female householder with no husband present, and 28.30% were non-families. 24.30% of all households were made up of individuals and 10.50% had someone living alone who was 65 years of age or older. The average household size was 2.65 and the average family size was 3.12.
In the county, the population was spread out with 28.30% under the age of 18, 8.60% from 18 to 24, 28.80% from 25 to 44, 23.70% from 45 to 64, and 10.50% who were 65 years of age or older. The median age was 35 years. For every 100 females, there were 97.00 males. For every 100 females age 18 and over, there were 92.80 males.
The median income for a household in the county was $29,145, and the median income for a family was $31,928. Males had a median income of $27,118 versus $21,211 for females. The per capita income for the county was $14,044. About 17.80% of families and 22.40% of the population were below the poverty line, including 31.20% of those under age 18 and 25.10% of those age 65 or over.
2010 census
As of the 2010 United States Census, there were 8,742 people, 3,420 households, and 2,378 families living in the county.[12] The population density was 23.9 inhabitants per square mile (9.2/km2). There were 4,156 housing units at an average density of 11.4 per square mile (4.4/km2).[13] The racial makeup of the county was 60.1% white, 32.7% black or African American, 0.9% Asian, 0.5% American Indian, 0.1% Pacific islander, 4.1% from other races, and 1.6% from two or more races. Those of Hispanic or Latino origin made up 6.5% of the population.[12] In terms of ancestry, 10.7% were Irish, 9.0% were American, 7.1% were English, and 6.7% were German.[14]
Of the 3,420 households, 34.1% had children under the age of 18 living with them, 47.7% were married couples living together, 16.5% had a female householder with no husband present, 30.5% were non-families, and 26.9% of all households were made up of individuals. The average household size was 2.53 and the average family size was 3.05. The median age was 40.8 years.[12]
The median income for a household in the county was $31,581 and the median income for a family was $51,000. Males had a median income of $33,626 versus $32,542 for females. The per capita income for the county was $17,729. About 15.0% of families and 22.0% of the population were below the poverty line, including 37.2% of those under age 18 and 11.3% of those age 65 or over.[15]
Education
The Marion County School District contains a primary school and a secondary school that serves students from preschool to grade 12.[16]
Politics
As with most Solid South counties, Marion County was dominated by the Democratic Party presidentially up until 1964. 1964 to 1972 had it swing away from the Democratic Party thanks to opposition to the civil rights movement & Richard Nixon's statewide dominance, but it flipped back to supporting presidential Democrats from 1976 to 1996. Starting with the 2000s, the county has become consistently Republican at the presidential level.
| Year | Republican | Democratic | Third parties |
|---|---|---|---|
| 2016 | 60.2% 1,921 | 38.0% 1,213 | 1.8% 56 |
| 2012 | 54.5% 1,733 | 44.4% 1,412 | 1.1% 34 |
| 2008 | 55.6% 1,772 | 43.3% 1,381 | 1.1% 35 |
| 2004 | 56.5% 1,670 | 43.1% 1,275 | 0.4% 12 |
| 2000 | 54.4% 1,187 | 45.0% 982 | 0.7% 15 |
| 1996 | 37.2% 678 | 53.7% 977 | 9.1% 166 |
| 1992 | 34.6% 711 | 55.7% 1,145 | 9.7% 200 |
| 1988 | 48.7% 804 | 51.1% 844 | 0.2% 4 |
| 1984 | 47.1% 846 | 52.9% 951 | |
| 1980 | 32.0% 567 | 66.2% 1,174 | 1.8% 32 |
| 1976 | 18.1% 291 | 81.9% 1,314 | |
| 1972 | 83.8% 850 | 16.2% 164 | |
| 1968 | 14.5% 186 | 19.3% 247 | 66.2% 849 |
| 1964 | 66.3% 719 | 33.6% 365 | 0.1% 1 |
| 1960 | 19.3% 154 | 80.7% 645 | |
| 1956 | 20.4% 158 | 79.6% 618 | |
| 1952 | 21.9% 182 | 78.2% 651 | |
| 1948 | 39.2% 212 | 52.3% 283 | 8.5% 46 |
| 1944 | 12.3% 70 | 87.7% 501 | |
| 1940 | 11.3% 77 | 88.6% 605 | 0.2% 1 |
| 1936 | 12.8% 62 | 87.0% 420 | 0.2% 1 |
| 1932 | 5.0% 24 | 95.0% 455 | |
| 1928 | 23.8% 114 | 76.2% 365 | |
| 1924 | 9.7% 31 | 84.7% 272 | 5.6% 18 |
| 1920 | 43.3% 180 | 56.7% 236 | |
| 1916 | 20.5% 96 | 70.5% 330 | 9.0% 42 |
| 1912 | 13.9% 41 | 81.1% 240 | 5.1% 15 |
References
- "State & County QuickFacts". United States Census Bureau. Archived from the original on June 7, 2011. Retrieved June 24, 2014.
- "Find a County". National Association of Counties. Retrieved June 7, 2011.
- Gannett, Henry (1905). The Origin of Certain Place Names in the United States. U.S. Government Printing Office. p. 200.
- "US Gazetteer files: 2010, 2000, and 1990". United States Census Bureau. February 12, 2011. Retrieved April 23, 2011.
- "Georgia Soil and Water Conservation Commission Interactive Mapping Experience". Georgia Soil and Water Conservation Commission. Retrieved November 22, 2015.
- "Population and Housing Unit Estimates". Retrieved July 31, 2019.
- "U.S. Decennial Census". United States Census Bureau. Retrieved June 24, 2014.
- "Historical Census Browser". University of Virginia Library. Retrieved June 24, 2014.
- "Population of Counties by Decennial Census: 1900 to 1990". United States Census Bureau. Retrieved June 24, 2014.
- "Census 2000 PHC-T-4. Ranking Tables for Counties: 1990 and 2000" (PDF). United States Census Bureau. Retrieved June 24, 2014.
- "U.S. Census website". United States Census Bureau. Retrieved May 14, 2011.
- "DP-1 Profile of General Population and Housing Characteristics: 2010 Demographic Profile Data". United States Census Bureau. Archived from the original on February 13, 2020. Retrieved December 30, 2015.
- "Population, Housing Units, Area, and Density: 2010 - County". United States Census Bureau. Archived from the original on February 13, 2020. Retrieved December 30, 2015.
- "DP02 SELECTED SOCIAL CHARACTERISTICS IN THE UNITED STATES – 2006-2010 American Community Survey 5-Year Estimates". United States Census Bureau. Archived from the original on February 13, 2020. Retrieved December 30, 2015.
- "DP03 SELECTED ECONOMIC CHARACTERISTICS – 2006-2010 American Community Survey 5-Year Estimates". United States Census Bureau. Archived from the original on February 13, 2020. Retrieved December 30, 2015.
- "Marion County Schools". www.marion.k12.ga.us. Retrieved July 15, 2019.
- Leip, David. "Dave Leip's Atlas of U.S. Presidential Elections". uselectionatlas.org. Retrieved March 22, 2018.
Places adjacent to Marion County, Georgia | ||||||||||
|---|---|---|---|---|---|---|---|---|---|---|
| ||||||||||
Municipalities and communities of Marion County, Georgia, United States | ||
|---|---|---|
| City | Map of Georgia highlighting Marion County | |
| Unincorporated communities | ||
Greater Columbus, Georgia | ||
|---|---|---|
| Central cities/Largest cities | 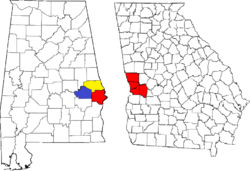 Location of the Columbus, Georgia-Auburn, Alabama CSA and its counties:
Columbus, Georgia Metropolitan Statistical Area
Auburn, Alabama Metropolitan Statistical Area
Tuskegee, Alabama Micropolitan Statistical Area (defunct) | |
| Cities in Georgia | ||
| Cities in Alabama | ||
| Counties in Georgia | ||
| Counties in Alabama | ||
| Authority control |
|
|---|