Coweta County, Georgia
Coweta County is a county located in the west central portion of the U.S. state of Georgia. It is part of Metro Atlanta. As of the 2010 census, the population was 127,317.[1] The county seat is Newnan.[2]
Coweta County | |
|---|---|
| Coweta County | |
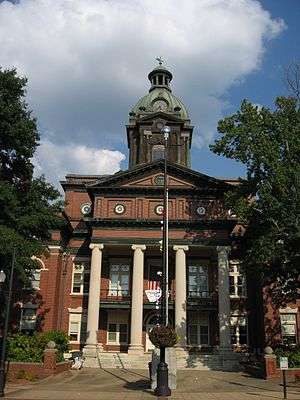 Historic Coweta County Courthouse in Newnan | |
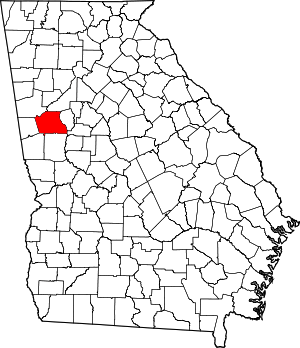 Location within the U.S. state of Georgia | |
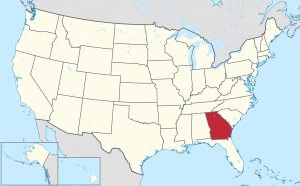 Georgia's location within the U.S. | |
| Coordinates: 33°21′N 84°46′W | |
| Country | |
| State | |
| Founded | 1826 |
| Seat | Newnan |
| Largest city | Newnan |
| Area | |
| • Total | 446 sq mi (1,160 km2) |
| • Land | 441 sq mi (1,140 km2) |
| • Water | 4.9 sq mi (13 km2) 1.1%% |
| Population | |
| • Estimate (2019) | 148,509 |
| • Density | 327/sq mi (126/km2) |
| Time zone | UTC−5 (Eastern) |
| • Summer (DST) | UTC−4 (EDT) |
| Congressional district | 3rd |
Coweta County is included in the Atlanta-Sandy Springs-Roswell, GA Metropolitan Statistical Area.
History
The land for Lee, Muscogee, Troup, Coweta and Carroll counties was ceded by the Creek people in the 1825 Treaty of Indian Springs. The counties' boundaries were created by the Georgia General Assembly on June 9, 1826, but they were not named until December 14, 1826. Coweta County was named for the Koweta Indians (a sub-group of the Creek people), who had several towns in and around the present-day county.[3]
In the city of Newnan, on April 23, 1899, a notorious lynching occurred after an African-American man by the name of Sam Hose (born Tom Wilkes) was accused of killing his boss, Alfred Cranford. Hose was tortured and burned alive by a lynch mob of approximately 2,000 citizens of Coweta County.
On August 9, 1882, Aleck Brown was lynched.[4]
Government and politics
The legislative body of is the Coweta County Commission, which consists of five members elected from numbered districts. The chairmanship rotates among the members. Coweta County is the only county in Georgia that operates with a rotating chairmanship.
| District | Commissioner | Party | Term of office | Seat up |
|---|---|---|---|---|
| District 1 | Paul Poole (2019 Chairman) | Republican | 2005–present | 2020 |
| District 2 | Tim Lassetter | Republican | 2007–present | 2022 |
| District 3 | Bob Blackburn | Republican | 2011–present | 2022 |
| District 4 | Rodney Brooks (2019 Vice Chairman) | Republican | 2009–present | 2020 |
| District 5 | Al Smith | Democratic | 2009–present | 2020 |
In the General Assembly, it is currently divided between State House district 70, 71, 72 and 132, and is within State Senate district 28 (currently held by Matt Brass). In Congress, it is in the 3rd congressional district, currently represented by Drew Ferguson.
Geography
According to the U.S. Census Bureau, the county has a total area of 446 square miles (1,160 km2), of which 441 square miles (1,140 km2) is land and 4.9 square miles (13 km2) (1.1%) is water.[5] The county is located in the Piedmont region of the state.
The eastern half of Coweta County, from Palmetto southwest to Newnan, then south to Luthersville, is in the Upper Flint River sub-basin of the ACF River Basin (Apalachicola-Chattahoochee-Flint River Basin). The western half is in the Middle Chattahoochee River-Lake Harding sub-basin of the same ACF River Basin.[6]
Major highways


Adjacent counties
- Fulton County – northeast
- Fayette County – east
- Spalding County – southeast
- Meriwether County – south
- Troup County – southwest
- Heard County – west
- Carroll County – northwest
Demographics
| Historical population | |||
|---|---|---|---|
| Census | Pop. | %± | |
| 1830 | 5,003 | — | |
| 1840 | 10,364 | 107.2% | |
| 1850 | 13,635 | 31.6% | |
| 1860 | 14,703 | 7.8% | |
| 1870 | 15,875 | 8.0% | |
| 1880 | 21,109 | 33.0% | |
| 1890 | 22,354 | 5.9% | |
| 1900 | 24,980 | 11.7% | |
| 1910 | 28,800 | 15.3% | |
| 1920 | 29,047 | 0.9% | |
| 1930 | 25,127 | −13.5% | |
| 1940 | 26,972 | 7.3% | |
| 1950 | 27,786 | 3.0% | |
| 1960 | 28,893 | 4.0% | |
| 1970 | 32,310 | 11.8% | |
| 1980 | 39,268 | 21.5% | |
| 1990 | 53,853 | 37.1% | |
| 2000 | 89,215 | 65.7% | |
| 2010 | 127,317 | 42.7% | |
| Est. 2019 | 148,509 | [7] | 16.6% |
| U.S. Decennial Census[8] 1790–1960[9] 1900–1990[10] 1990–2000[11] 2010–2019[1] | |||
2000 census
As of the census[12] of 2000, there were 89,215 people, 31,442 households, and 24,713 families living in the county. The population density was 202 people per square mile (78/km2). There were 33,182 housing units at an average density of 75 per square mile (29/km2). The racial makeup of the county was 78.86% White, 17.97% Black or African American, 0.23% Native American, 0.68% Asian, 0.01% Pacific Islander, 1.22% from other races, and 1.02% from two or more races. 3.14% of the population were Hispanic or Latino of any race.
There were 31,442 households, out of which 39.90% had children under the age of 18 living with them, 62.50% were married couples living together, 12.20% had a female householder with no husband present, and 21.40% were non-families. Of all households 17.60% were made up of individuals, and 5.70% had someone living alone who was 65 years of age or older. The average household size was 2.81 and the average family size was 3.17.
In the county, the population was spread out, with 28.70% under the age of 18, 7.60% from 18 to 24, 33.40% from 25 to 44, 21.80% from 45 to 64, and 8.50% who were 65 years of age or older. The median age was 34 years. For every 100 females, there were 98.00 males. For every 100 females age 18 and over, there were 95.40 males.
The median income for a household in the county was $52,706, and the median income for a family was $58,750. Males had a median income of $41,369 versus $27,322 for females. The per capita income for the county was $21,949. About 6.10% of families and 7.80% of the population were below the poverty line, including 9.60% of those under age 18 and 10.50% of those age 65 or over.
2010 census
As of the 2010 United States Census, there were 127,317 people, 45,673 households, and 34,737 families living in the county.[13] The population density was 288.8 inhabitants per square mile (111.5/km2). There were 50,171 housing units at an average density of 113.8 per square mile (43.9/km2).[14] The racial makeup of the county was 75.9% white, 17.3% black or African American, 1.5% Asian, 0.3% American Indian, 0.1% Pacific islander, 2.9% from other races, and 2.1% from two or more races. Those of Hispanic or Latino origin made up 6.7% of the population.[13] In terms of ancestry, 22.2% were American, 10.4% were German, 10.4% were Irish, and 9.9% were English.[15]
Of the 45,673 households, 41.0% had children under the age of 18 living with them, 58.5% were married couples living together, 13.1% had a female householder with no husband present, 23.9% were non-families, and 19.6% of all households were made up of individuals. The average household size was 2.77 and the average family size was 3.18. The median age was 36.6 years.[13]
The median income for a household in the county was $61,550 and the median income for a family was $68,469. Males had a median income of $51,658 versus $36,535 for females. The per capita income for the county was $26,161. About 7.7% of families and 10.2% of the population were below the poverty line, including 15.4% of those under age 18 and 7.9% of those age 65 or over.[16]
Education
The Coweta County School System holds pre-school to grade 12, and consists of nineteen elementary schools, six middle schools and three high schools.[17] The system has 1,164 full-time teachers and more than 18,389 students.[18] Private schools in the county include The Heritage School and Trinity Christian School.
Mercer University has a Regional Academic Center in Newnan. The center, opened in 2010, offers programs through the university's College of Continuing and Professional Studies. The University of West Georgia has a campus near downtown Newnan on the site of the old Newnan Hospital. This campus offers two undergraduate programs - bachelor of science in nursing and early childhood education.[19]
Newnan is also home to a campus of West Georgia Technical College.[20]
Notable people
- Ellis Gibbs Arnall, governor of Georgia, 1943-1947
- William Yates Atkinson, governor of Georgia, 1894-1896; founded Georgia State College for Women, now Georgia College & State University
- Steve Bedrosian, former Major League baseball player; National League Cy Young Award winner in 1987
- Keith Brooking, football player for the Atlanta Falcons and Dallas Cowboys
- Erskine Caldwell, author of the novels Tobacco Road and God's Little Acre
- Lewis Grizzard, newspaper columnist, author and humorist
- Drew Hill, played for the pro football Houston Oilers, Los Angeles Rams and Atlanta Falcons
- Sam Hose, African-American man who was brutally murdered by a lynch mob after accusations of murder, assault and rape
- Alan Jackson, country music singer and musician
- Joe M. Jackson, colonel, U.S. Air Force, Medal of Honor recipient
- Warren Newson, played pro baseball for the Chicago White Sox
- Stephen W. Pless, major, U.S. Marine Corps, Medal of Honor recipient
- Jefferson Randolph "Soapy" Smith, confidence man and crime boss
- Charles Wadsworth, retired director of the Chamber Music Society at the Lincoln Center for the Performing Arts
- Jerome Walton, former Major League baseball player; Rookie of the Year in the National League in 1989
- Rutledge Wood, auto racing analyst and host of Top Gear
- Eric Berry, plays football for Kansas City Chiefs
Communities
Cities
- Grantville
- Newnan
- Palmetto (partly in Fulton County)
- Senoia
Towns
Census-designated place
Other unincorporated communities
- Corinth (partly in Heard County)
- Raymond
- Roscoe
- Sargent
- Gloverton
- Thomas Crossroads
- Dresden
- Blackjack
Politics
| Year | Republican | Democratic | Third parties |
|---|---|---|---|
| 2016 | 68.4% 42,533 | 26.7% 16,583 | 5.0% 3,094 |
| 2012 | 71.2% 39,653 | 27.2% 15,168 | 1.6% 897 |
| 2008 | 70.1% 37,571 | 28.9% 15,521 | 1.0% 543 |
| 2004 | 74.4% 31,682 | 25.0% 10,647 | 0.7% 280 |
| 2000 | 68.3% 21,327 | 29.0% 9,056 | 2.7% 843 |
| 1996 | 56.9% 13,058 | 33.9% 7,794 | 9.2% 2,118 |
| 1992 | 47.8% 9,814 | 34.5% 7,093 | 17.7% 3,646 |
| 1988 | 69.4% 9,668 | 30.2% 4,212 | 0.4% 49 |
| 1984 | 68.6% 7,981 | 31.4% 3,650 | |
| 1980 | 43.0% 4,480 | 54.7% 5,697 | 2.4% 245 |
| 1976 | 33.0% 3,044 | 67.1% 6,195 | |
| 1972 | 78.7% 5,751 | 21.3% 1,560 | |
| 1968 | 32.8% 2,442 | 16.2% 1,204 | 51.0% 3,791 |
| 1964 | 49.6% 3,656 | 50.4% 3,712 | |
| 1960 | 23.1% 1,159 | 76.9% 3,855 | |
| 1956 | 22.1% 850 | 77.9% 3,003 | |
| 1952 | 14.5% 652 | 85.5% 3,837 | |
| 1948 | 7.9% 209 | 83.6% 2,214 | 8.5% 226 |
| 1944 | 4.7% 130 | 95.3% 2,649 | |
| 1940 | 3.5% 103 | 96.3% 2,846 | 0.3% 8 |
| 1936 | 3.1% 73 | 96.8% 2,260 | 0.1% 3 |
| 1932 | 2.1% 46 | 97.7% 2,183 | 0.3% 6 |
| 1928 | 12.2% 229 | 87.9% 1,656 | |
| 1924 | 6.0% 67 | 90.4% 1,010 | 3.6% 40 |
| 1920 | 13.4% 169 | 86.6% 1,094 | |
| 1916 | 2.0% 26 | 91.4% 1,179 | 6.6% 85 |
| 1912 | 4.1% 46 | 92.8% 1,044 | 3.1% 35 |
See also
References
- "State & County QuickFacts". United States Census Bureau. Retrieved June 20, 2014.
- "Find a County". National Association of Counties. Archived from the original on May 31, 2011. Retrieved June 7, 2011.
- Krakow, Kenneth K. (1975). Georgia Place-Names: Their History and Origins (PDF). Macon, GA: Winship Press. p. 52. ISBN 0-915430-00-2.
- "CSDE Lynching Database". lynching.csde.washington.edu. Retrieved September 21, 2017.
- "US Gazetteer files: 2010, 2000, and 1990". United States Census Bureau. February 12, 2011. Retrieved April 23, 2011.
- "Georgia Soil and Water Conservation Commission Interactive Mapping Experience". Georgia Soil and Water Conservation Commission. Retrieved November 19, 2015.
- "Population and Housing Unit Estimates". Retrieved May 21, 2020.
- "U.S. Decennial Census". United States Census Bureau. Retrieved June 20, 2014.
- "Historical Census Browser". University of Virginia Library. Retrieved June 20, 2014.
- "Population of Counties by Decennial Census: 1900 to 1990". United States Census Bureau. Retrieved June 20, 2014.
- "Census 2000 PHC-T-4. Ranking Tables for Counties: 1990 and 2000" (PDF). United States Census Bureau. Retrieved June 20, 2014.
- "U.S. Census website". United States Census Bureau. Retrieved May 14, 2011.
- "DP-1 Profile of General Population and Housing Characteristics: 2010 Demographic Profile Data". United States Census Bureau. Archived from the original on February 13, 2020. Retrieved December 27, 2015.
- "Population, Housing Units, Area, and Density: 2010 - County". United States Census Bureau. Archived from the original on February 13, 2020. Retrieved December 27, 2015.
- "DP02 SELECTED SOCIAL CHARACTERISTICS IN THE UNITED STATES – 2006-2010 American Community Survey 5-Year Estimates". United States Census Bureau. Archived from the original on February 13, 2020. Retrieved December 27, 2015.
- "DP03 SELECTED ECONOMIC CHARACTERISTICS – 2006-2010 American Community Survey 5-Year Estimates". United States Census Bureau. Archived from the original on February 13, 2020. Retrieved December 27, 2015.
- Georgia Board of Education, Retrieved August 2, 2014.
- School Stats, Retrieved August 2, 2014.
- Georgia, University of West. "UWG | University of West Georgia Newnan". www.westga.edu. Retrieved August 5, 2018.
- "Archived copy". Archived from the original on August 17, 2011. Retrieved August 24, 2011.CS1 maint: archived copy as title (link)>.
- Leip, David. "Dave Leip's Atlas of U.S. Presidential Elections". uselectionatlas.org. Retrieved March 19, 2018.
Places adjacent to Coweta County, Georgia | ||||||||||
|---|---|---|---|---|---|---|---|---|---|---|
| ||||||||||
Municipalities and communities of Coweta County, Georgia, United States | ||
|---|---|---|
| Cities | Map of Georgia highlighting Coweta County | |
| Towns | ||
| CDP | ||
| Unincorporated communities |
| |
| Footnotes | ‡This populated place also has portions in an adjacent county or counties | |
|  | |||||
|
| ||||||
| ||||||
| Authority control |
|
|---|