Union County, Georgia
Union County is a county located in the U.S. state of Georgia. As of the 2010 census, the population was 21,356.[1] The county seat is Blairsville.[2]
Union County | |
|---|---|
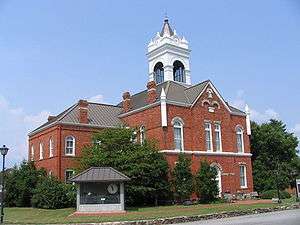 Old Union County Courthouse in Blairsville | |
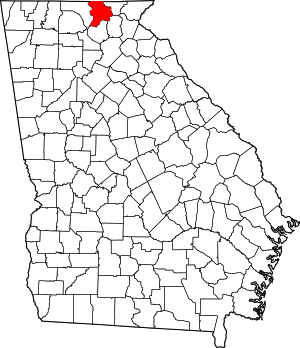 Location within the U.S. state of Georgia | |
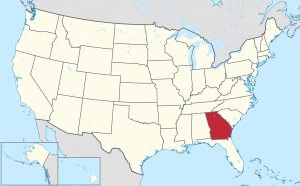 Georgia's location within the U.S. | |
| Coordinates: 34°50′N 83°59′W | |
| Country | |
| State | |
| Founded | 1832 |
| Seat | Blairsville |
| Largest city | Blairsville |
| Area | |
| • Total | 329 sq mi (850 km2) |
| • Land | 322 sq mi (830 km2) |
| • Water | 7.1 sq mi (18 km2) 2.2% |
| Population | |
| • Estimate (2018) | 24,001 |
| • Density | 66/sq mi (25/km2) |
| Time zone | UTC−5 (Eastern) |
| • Summer (DST) | UTC−4 (EDT) |
| Congressional district | 9th |
| Website | www |
| Vanishing site of Kristi Cornwell | |
Its Sole commissioner is Lamar Paris, who has served since 2001.[3]
History
Union County was formed in 1832, and named for the federal union.[4]
Geography
According to the U.S. Census Bureau, the county has a total area of 329 square miles (850 km2), of which 322 square miles (830 km2) is land and 7.1 square miles (18 km2) (2.2%) is water.[5] Brasstown Bald, the highest mountain in Georgia, rises in southeast Union County, straddling the Towns County line. The central and northern portion of Union County is located in the Hiwassee River sub-basin of the Middle Tennessee-Hiwassee basin, while the southwestern portion of the county is located in the Ocoee River sub-basin of the same larger watershed. A very small portion of the county's southeastern corner is located in the Upper Chattahoochee River sub-basin of the ACF River Basin (Apalachicola-Chattahoochee-Flint River Basin, also listed as simply the Apalachicola Basin by USGS).[6] This is also where the source of the Chattahoochee is found.
Adjacent counties
- Cherokee County, North Carolina (north)
- Clay County, North Carolina (northeast)
- Towns County (east)
- White County (southeast)
- Lumpkin County (south)
- Fannin County (west)
National protected area
- Chattahoochee National Forest (part)
Transportation
Major highways
Other roads
- Blue Ridge Highway (Old US 76/Old SR 2)
- Skeenah Gap Road
- Town Creek School Road
- Mulky Gap Road
- Owltown Road
- Spiva Bridge Way
- Gumlog Road
- Loving Road
- Nottely Dam Road (Old SR 325). Not all of Nottely Dam Road remains a state route.
- Pat Haralson Memorial Drive
- Trackrock Gap Road
Demographics
| Historical population | |||
|---|---|---|---|
| Census | Pop. | %± | |
| 1840 | 3,152 | — | |
| 1850 | 7,234 | 129.5% | |
| 1860 | 4,413 | −39.0% | |
| 1870 | 5,267 | 19.4% | |
| 1880 | 6,431 | 22.1% | |
| 1890 | 7,749 | 20.5% | |
| 1900 | 8,481 | 9.4% | |
| 1910 | 6,918 | −18.4% | |
| 1920 | 6,455 | −6.7% | |
| 1930 | 6,340 | −1.8% | |
| 1940 | 7,680 | 21.1% | |
| 1950 | 7,318 | −4.7% | |
| 1960 | 6,510 | −11.0% | |
| 1970 | 6,811 | 4.6% | |
| 1980 | 9,390 | 37.9% | |
| 1990 | 11,993 | 27.7% | |
| 2000 | 17,289 | 44.2% | |
| 2010 | 21,356 | 23.5% | |
| Est. 2018 | 24,001 | [7] | 12.4% |
| U.S. Decennial Census[8] 1790-1960[9] 1900-1990[10] 1990-2000[11] 2010-2013[1] | |||
2000 census
As of the census[12] of 2000, there were 17,289 people, 7,159 households, and 5,211 families living in the county. The population density was 54 people per square mile (21/km²). There were 10,001 housing units at an average density of 31 per square mile (12/km²). The racial makeup of the county was 97.94% White, 0.58% Black or African American, 0.25% Native American, 0.23% Asian, 0.02% Pacific Islander, 0.24% from other races, and 0.74% from two or more races. 0.88% of the population were Hispanic or Latino of any race. Union County was mentioned as an "Extreme Whitopia", a place with a high concentration of white residents, in Rich Benjamin's book, Searching for Whitopia.[13] (Because American Indians were forced out, and black slavery was virtually nonexistent in this part of the Georgia mountains, the county has had a minuscule nonwhite population for almost 200 years.)
There were 7,159 households out of which 24.80% had children under the age of 18 living with them, 62.90% were married couples living together, 7.10% had a female householder with no husband present, and 27.20% were non-families. 24.20% of all households were made up of individuals and 12.00% had someone living alone who was 65 years of age or older. The average household size was 2.35 and the average family size was 2.77.
In the county, the population was spread out with 20.00% under the age of 18, 6.60% from 18 to 24, 23.60% from 25 to 44, 28.20% from 45 to 64, and 21.60% who were 65 years of age or older. The median age was 45 years. For every 100 females there were 96.60 males. For every 100 females age 18 and over, there were 94.60 males.
The median income for a household in the county was $31,893, and the median income for a family was $39,776. Males had a median income of $29,127 versus $20,871 for females. The per capita income for the county was $18,845. About 9.30% of families and 12.50% of the population were below the poverty line, including 13.10% of those under age 18 and 15.90% of those age 65 or over.
2010 census
As of the 2010 United States Census, there were 21,356 people, 9,116 households, and 6,382 families living in the county.[14] The population density was 66.3 inhabitants per square mile (25.6/km2). There were 14,052 housing units at an average density of 43.6 per square mile (16.8/km2).[15] The racial makeup of the county was 96.8% white, 0.5% black or African American, 0.4% Asian, 0.3% American Indian, 0.9% from other races, and 1.2% from two or more races. Those of Hispanic or Latino origin made up 2.4% of the population.[14] In terms of ancestry, 16.0% were English, 15.8% were Irish, 15.0% were American, and 13.2% were German.[16]
Of the 9,116 households, 22.6% had children under the age of 18 living with them, 58.8% were married couples living together, 8.0% had a female householder with no husband present, 30.0% were non-families, and 26.2% of all households were made up of individuals. The average household size was 2.30 and the average family size was 2.75. The median age was 50.7 years.[14]
The median income for a household in the county was $41,298 and the median income for a family was $50,772. Males had a median income of $42,330 versus $29,176 for females. The per capita income for the county was $24,182. About 9.5% of families and 13.9% of the population were below the poverty line, including 14.5% of those under age 18 and 9.5% of those age 65 or over.[17]
Cities and communities
Incorporated Cities
Politics
| Year | Republican | Democratic | Third parties |
|---|---|---|---|
| 2016 | 81.7% 9,852 | 16.3% 1,963 | 2.1% 248 |
| 2012 | 79.0% 8,773 | 19.3% 2,139 | 1.8% 197 |
| 2008 | 75.0% 8,013 | 23.3% 2,486 | 1.8% 191 |
| 2004 | 74.1% 6,847 | 25.2% 2,327 | 0.8% 71 |
| 2000 | 65.7% 4,567 | 32.1% 2,230 | 2.3% 159 |
| 1996 | 48.7% 2,685 | 39.5% 2,175 | 11.8% 653 |
| 1992 | 44.8% 2,533 | 40.7% 2,304 | 14.5% 819 |
| 1988 | 65.4% 2,396 | 34.3% 1,258 | 0.3% 10 |
| 1984 | 63.3% 1,914 | 36.8% 1,112 | |
| 1980 | 46.7% 1,546 | 51.3% 1,700 | 2.0% 65 |
| 1976 | 29.2% 1,154 | 70.8% 2,795 | |
| 1972 | 75.7% 2,317 | 24.3% 742 | |
| 1968 | 39.4% 1,221 | 31.4% 974 | 29.2% 906 |
| 1964 | 40.8% 1,473 | 59.2% 2,135 | |
| 1960 | 56.5% 1,537 | 43.5% 1,185 | |
| 1956 | 49.5% 1,360 | 50.5% 1,386 | |
| 1952 | 49.4% 1,330 | 50.6% 1,360 | |
| 1948 | 2.7% 75 | 51.1% 1,420 | 46.2% 1283 |
| 1944 | 37.1% 760 | 62.9% 1,288 | |
| 1940 | 36.9% 557 | 63.0% 950 | 0.1% 2 |
| 1936 | 40.6% 783 | 59.5% 1,148 | |
| 1932 | 37.6% 810 | 62.4% 1,344 | |
| 1928 | 82.2% 2,873 | 17.8% 623 | |
| 1924 | 45.9% 719 | 50.6% 793 | 3.5% 55 |
| 1920 | 54.5% 562 | 45.5% 469 | |
| 1916 | 0.0% 0 | 50.4% 532 | 49.6% 523 |
| 1912 | 38.1% 250 | 48.6% 319 | 13.4% 88 |
External links
References
- "State & County QuickFacts". United States Census Bureau. Retrieved February 18, 2014.
- "Find a County". National Association of Counties. Retrieved June 7, 2011.
- Blairsville-Union County: Guiding Growth, Georgia Trend, January 2007.
- Krakow, Kenneth K. (1975). Georgia Place-Names: Their History and Origins (PDF). Macon, GA: Winship Press. p. 237. ISBN 0-915430-00-2.
- "US Gazetteer files: 2010, 2000, and 1990". United States Census Bureau. February 12, 2011. Retrieved April 23, 2011.
- "Georgia Soil and Water Conservation Commission Interactive Mapping Experience". Georgia Soil and Water Conservation Commission. Retrieved November 17, 2015.
- "Population and Housing Unit Estimates". Retrieved July 31, 2019.
- "U.S. Decennial Census". United States Census Bureau. Retrieved June 26, 2014.
- "Historical Census Browser". University of Virginia Library. Retrieved June 26, 2014.
- "Population of Counties by Decennial Census: 1900 to 1990". United States Census Bureau. Retrieved June 26, 2014.
- "Census 2000 PHC-T-4. Ranking Tables for Counties: 1990 and 2000" (PDF). United States Census Bureau. Retrieved June 26, 2014.
- "U.S. Census website". United States Census Bureau. Retrieved January 31, 2008.
- "Searching for Whitopia ~ By Rich Benjamin". Richbenjamin.com. September 15, 2002. Archived from the original on December 1, 2012. Retrieved November 28, 2012.
- "DP-1 Profile of General Population and Housing Characteristics: 2010 Demographic Profile Data". United States Census Bureau. Archived from the original on February 13, 2020. Retrieved December 30, 2015.
- "Population, Housing Units, Area, and Density: 2010 - County". United States Census Bureau. Archived from the original on February 13, 2020. Retrieved December 30, 2015.
- "DP02 SELECTED SOCIAL CHARACTERISTICS IN THE UNITED STATES – 2006-2010 American Community Survey 5-Year Estimates". United States Census Bureau. Archived from the original on February 13, 2020. Retrieved December 30, 2015.
- "DP03 SELECTED ECONOMIC CHARACTERISTICS – 2006-2010 American Community Survey 5-Year Estimates". United States Census Bureau. Archived from the original on February 13, 2020. Retrieved December 30, 2015.
- Leip, David. "Dave Leip's Atlas of U.S. Presidential Elections". uselectionatlas.org. Retrieved March 22, 2018.
Places adjacent to Union County, Georgia | |
|---|---|
Municipalities and communities of Union County, Georgia, United States | ||
|---|---|---|
| City | Map of Georgia highlighting Union County | |
| Unincorporated communities | ||
| Ghost town | ||
| Authority control |
|
|---|