Colquitt County, Georgia
Colquitt County is a county in the U.S. state of Georgia. As of the 2010 census, the population was 45,498.[1] The county seat is Moultrie.[2] The county was created February 25, 1856 and is named for Walter Terry Colquitt, a U.S. senator.[3] Colquitt County comprises the Moultrie, GA Micropolitan Statistical Area. It is the hometown of former U.S. Senator Saxby Chambliss. Colquitt County is the home of the Colquitt County Packers and is home to the 1994 Class AAAA and the 2014 and 2015 AAAAAA State Championship Football teams, along with the 1997 and 2003 State Champion Baseball teams.
Colquitt County | |
|---|---|
 Colquitt County Courthouse in Moultrie | |
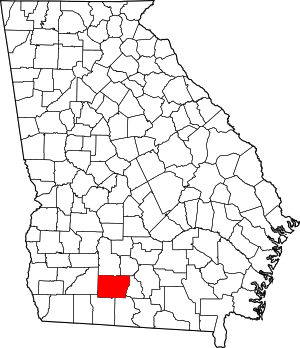 Location within the U.S. state of Georgia | |
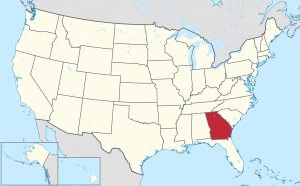 Georgia's location within the U.S. | |
| Coordinates: 31°11′N 83°46′W | |
| Country | |
| State | |
| Founded | 1856 |
| Named for | Walter Terry Colquitt |
| Seat | Moultrie |
| Largest city | Moultrie |
| Area | |
| • Total | 557 sq mi (1,440 km2) |
| • Land | 544 sq mi (1,410 km2) |
| • Water | 12 sq mi (30 km2) 2.2%% |
| Population | |
| • Estimate (2019) | 45,600 |
| • Density | 84/sq mi (32/km2) |
| Time zone | UTC−5 (Eastern) |
| • Summer (DST) | UTC−4 (EDT) |
| Congressional district | 8th |
| Website | www |
Geography
According to the U.S. Census Bureau, the county has a total area of 557 square miles (1,440 km2), of which 544 square miles (1,410 km2) is land and 12 square miles (31 km2) (2.2%) is water.[4]
Most of the western portion of Colquitt County, west of Moultrie and State Route 33, is located in the Upper Ochlockonee River sub-basin of the larger Ochlockonee River basin, with the exception of the very northwestern corner of the county, between Sale City and west of Doerun, which is located in the Lower Flint River sub-basin of the ACF River Basin (Apalachicola-Chattahoochee-Flint River Basin). A narrow central portion of Colquitt County, running from north to south of Moultrie, and then widening to occupy the gap between U.S. Route 319 and State Route 133, is located in the Withlacoochee River sub-basin of the Suwannee River basin. The eastern portion of the county is located in the Little River sub-basin of the same Suwannee River basin.[5]
Lakes
- Adams Lake
- Beatles Lake North
- Beatles Lake
- Brewer Lake
- Cardin Lake
- Cobb Lake
- Colquitt County Lake
- Demott Lake
- Giles Millpond
- Gray Lake
- Hall Lake
- Indian Lake
- Lindsey Lake
- Lukes Pond
- Mims Millpond
- Moss Lake
- Lake Murphy
- Reed Bingham Park Lake
- Rowell Lake
- Sanders Lake
- Sells Lake
- Smith Lake
- Sunset Lake
- Vickers Lake
- Willis Lake
Major highways

- U.S. Route 319 Business


Adjacent counties
- Tift County (northeast)
- Cook County (east)
- Brooks County (southeast)
- Thomas County (southwest)
- Mitchell County (west)
- Worth County (northwest)
Demographics
| Historical population | |||
|---|---|---|---|
| Census | Pop. | %± | |
| 1860 | 1,316 | — | |
| 1870 | 1,654 | 25.7% | |
| 1880 | 2,527 | 52.8% | |
| 1890 | 4,794 | 89.7% | |
| 1900 | 13,636 | 184.4% | |
| 1910 | 19,789 | 45.1% | |
| 1920 | 29,332 | 48.2% | |
| 1930 | 30,622 | 4.4% | |
| 1940 | 33,012 | 7.8% | |
| 1950 | 33,999 | 3.0% | |
| 1960 | 34,048 | 0.1% | |
| 1970 | 32,200 | −5.4% | |
| 1980 | 35,376 | 9.9% | |
| 1990 | 36,645 | 3.6% | |
| 2000 | 42,053 | 14.8% | |
| 2010 | 45,498 | 8.2% | |
| Est. 2019 | 45,600 | [6] | 0.2% |
| U.S. Decennial Census[7] 1790-1960[8] 1900-1990[9] 1990-2000[10] 2010-2019[1] | |||
2000 census
As of the census[11] of 2000, there were 42,053 people, 15,495 households, and 11,063 families living in the county. The population density was 76 people per square mile (29/km²). There were 17,554 housing units at an average density of 32 per square mile (12/km²). The racial makeup of the county was 67.78% White, 23.47% Black or African American, 0.29% Native American, 0.25% Asian, 0.04% Pacific Islander, 7.05% from other races, and 1.12% from two or more races. 10.83% of the population were Hispanic or Latino of any race.
There were 15,495 households out of which 34.60% had children under the age of 18 living with them, 51.00% were married couples living together, 15.50% had a female householder with no husband present, and 28.60% were non-families. 24.90% of all households were made up of individuals and 11.20% had someone living alone who was 65 years of age or older. The average household size was 2.63 and the average family size was 3.12.
In the county, the population was spread out with 27.40% under the age of 18, 10.30% from 18 to 24, 28.00% from 25 to 44, 21.40% from 45 to 64, and 12.90% who were 65 years of age or older. The median age was 34 years. For every 100 females there were 98.10 males. For every 100 females age 18 and over, there were 95.50 males.
The median income for a household in the county was $28,539, and the median income for a family was $34,792. Males had a median income of $26,588 versus $20,155 for females. The per capita income for the county was $14,457. About 16.10% of families and 19.80% of the population were below the poverty line, including 25.70% of those under age 18 and 19.60% of those age 65 or over.
2010 census
As of the 2010 United States Census, there were 45,498 people, 16,317 households, and 11,696 families living in the county.[12] The population density was 83.6 inhabitants per square mile (32.3/km2). There were 18,311 housing units at an average density of 33.7 per square mile (13.0/km2).[13] The racial makeup of the county was 64.7% white, 22.4% black or African American, 0.6% Asian, 0.5% American Indian, 10.3% from other races, and 1.4% from two or more races. Those of Hispanic or Latino origin made up 17.1% of the population.[12] In terms of ancestry, 19.6% were American, 8.4% were Irish, and 6.8% were English.[14]
Of the 16,317 households, 38.9% had children under the age of 18 living with them, 48.7% were married couples living together, 17.3% had a female householder with no husband present, 28.3% were non-families, and 24.0% of all households were made up of individuals. The average household size was 2.73 and the average family size was 3.21. The median age was 34.8 years.[12]
The median income for a household in the county was $32,902 and the median income for a family was $39,086. Males had a median income of $28,912 versus $24,199 for females. The per capita income for the county was $17,362. About 18.8% of families and 23.4% of the population were below the poverty line, including 32.7% of those under age 18 and 16.8% of those age 65 or over.[15]
2008 estimates
According to Census Bureau estimates in 2008, Colquitt County had a population that was 75.3% whites, 22.9% African-American and 16.0% Latino.[16]
Education
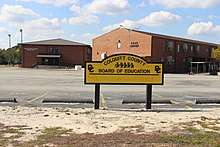
Colquitt County School District operates public schools, with Colquitt County High School being the high school.
Communities
Unincorporated communities
- Autreyville
- Barbers
- Center Hill
- Cool Springs
- Crosland
- Hartsfield
- Minnesota
- Murphy
- New Elm
- Pineboro
- Sigsbee
- Sunset
- Terrace
- Ticknor
- Weldon
Politics
| Year | Republican | Democratic | Third parties |
|---|---|---|---|
| 2016 | 72.7% 9,898 | 25.4% 3,463 | 1.9% 263 |
| 2012 | 69.3% 9,243 | 29.8% 3,973 | 1.0% 131 |
| 2008 | 68.3% 9,185 | 30.8% 4,139 | 1.0% 130 |
| 2004 | 70.6% 8,296 | 28.7% 3,378 | 0.7% 78 |
| 2000 | 66.1% 6,589 | 33.1% 3,297 | 0.9% 86 |
| 1996 | 48.5% 4,847 | 41.4% 4,135 | 10.1% 1010 |
| 1992 | 45.5% 4,680 | 37.9% 3,891 | 16.6% 1705 |
| 1988 | 65.0% 5,653 | 34.5% 2,998 | 0.5% 40 |
| 1984 | 64.5% 5,815 | 35.6% 3,208 | |
| 1980 | 39.6% 3,593 | 59.0% 5,353 | 1.4% 123 |
| 1976 | 23.9% 2,181 | 76.1% 6,928 | |
| 1972 | 88.1% 6,900 | 11.9% 930 | |
| 1968 | 20.2% 1,882 | 12.0% 1,119 | 67.8% 6,325 |
| 1964 | 71.7% 6,493 | 28.3% 2,563 | 0.0% 4 |
| 1960 | 27.7% 1,685 | 72.3% 4,397 | |
| 1956 | 23.2% 1,336 | 76.8% 4,412 | |
| 1952 | 23.8% 1,411 | 76.2% 4,517 | |
| 1948 | 19.2% 664 | 65.1% 2,255 | 15.8% 546 |
| 1944 | 23.2% 696 | 76.8% 2,308 | |
| 1940 | 22.2% 525 | 77.0% 1,819 | 0.7% 17 |
| 1936 | 15.4% 448 | 84.4% 2,449 | 0.1% 4 |
| 1932 | 2.8% 101 | 96.8% 3,534 | 0.5% 17 |
| 1928 | 45.1% 796 | 54.9% 970 | |
| 1924 | 10.7% 205 | 81.8% 1,572 | 7.5% 145 |
| 1920 | 40.5% 523 | 59.5% 768 | |
| 1916 | 11.2% 171 | 85.4% 1,305 | 3.5% 53 |
| 1912 | 41.8% 507 | 57.6% 699 | 0.7% 8 |
References
- "State & County QuickFacts". United States Census Bureau. Retrieved June 20, 2014.
- "Find a County". National Association of Counties. Archived from the original on May 31, 2011. Retrieved June 7, 2011.
- Krakow, Kenneth K. (1975). Georgia Place-Names: Their History and Origins (PDF). Macon, GA: Winship Press. p. 49. ISBN 0-915430-00-2.
- "US Gazetteer files: 2010, 2000, and 1990". United States Census Bureau. February 12, 2011. Retrieved April 23, 2011.
- "Georgia Soil and Water Conservation Commission Interactive Mapping Experience". Georgia Soil and Water Conservation Commission. Retrieved November 25, 2015.
- "Population and Housing Unit Estimates". Retrieved May 21, 2020.
- "U.S. Decennial Census". United States Census Bureau. Retrieved June 20, 2014.
- "Historical Census Browser". University of Virginia Library. Retrieved June 20, 2014.
- "Population of Counties by Decennial Census: 1900 to 1990". United States Census Bureau. Retrieved June 20, 2014.
- "Census 2000 PHC-T-4. Ranking Tables for Counties: 1990 and 2000" (PDF). United States Census Bureau. Retrieved June 20, 2014.
- "U.S. Census website". United States Census Bureau. Retrieved May 14, 2011.
- "DP-1 Profile of General Population and Housing Characteristics: 2010 Demographic Profile Data". United States Census Bureau. Archived from the original on February 13, 2020. Retrieved December 27, 2015.
- "Population, Housing Units, Area, and Density: 2010 - County". United States Census Bureau. Archived from the original on February 13, 2020. Retrieved December 27, 2015.
- "DP02 SELECTED SOCIAL CHARACTERISTICS IN THE UNITED STATES – 2006-2010 American Community Survey 5-Year Estimates". United States Census Bureau. Archived from the original on February 13, 2020. Retrieved December 27, 2015.
- "DP03 SELECTED ECONOMIC CHARACTERISTICS – 2006-2010 American Community Survey 5-Year Estimates". United States Census Bureau. Archived from the original on February 13, 2020. Retrieved December 27, 2015.
- Colquitt County QuickFacts from the US Census Bureau
- Leip, David. "Dave Leip's Atlas of U.S. Presidential Elections". uselectionatlas.org. Retrieved March 19, 2018.
External links
- Colquitt County official website
- Colquitt County historical marker
Places adjacent to Colquitt County, Georgia | ||||||||||
|---|---|---|---|---|---|---|---|---|---|---|
| ||||||||||
Municipalities and communities of Colquitt County, Georgia, United States | ||
|---|---|---|
| Cities | Map of Georgia highlighting Colquitt County | |
| Towns | ||
| Unincorporated communities | ||
| Footnotes | ‡This populated place also has portions in an adjacent county or counties | |
| Authority control |
|
|---|