Screven County, Georgia
Screven County is a county located in the U.S. state of Georgia. As of the 2010 census, the population was 14,593.[1] The county seat is Sylvania.[2]
Screven County | |
|---|---|
 | |
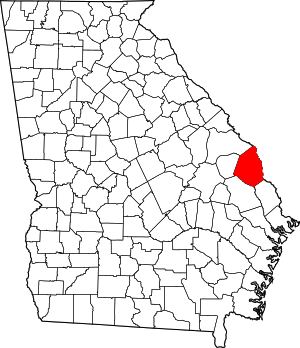 Location within the U.S. state of Georgia | |
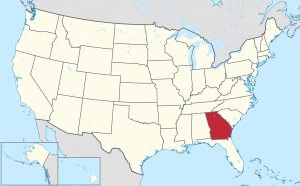 Georgia's location within the U.S. | |
| Coordinates: 32°45′N 81°37′W | |
| Country | |
| State | |
| Founded | December 14, 1793 |
| Named for | James Screven |
| Seat | Sylvania |
| Largest city | Sylvania |
| Area | |
| • Total | 656 sq mi (1,700 km2) |
| • Land | 645 sq mi (1,670 km2) |
| • Water | 11 sq mi (30 km2) 1.6%% |
| Population | |
| • Estimate (2018) | 13,938 |
| • Density | 22/sq mi (8/km2) |
| Time zone | UTC−5 (Eastern) |
| • Summer (DST) | UTC−4 (EDT) |
| Congressional district | 12th |
History
The county was created on December 14, 1793, and was named for General James Screven, who died fighting in Georgia during the American Revolutionary War. Some wartime accounts used the alternate spelling of "Scriven" for the general, and the county's name was often spelled that way in its early history, as reflected on 19th-century Georgia maps.
Sylvania became the county seat in 1847, moved from Jacksonborough, by an act of State legislation.[3]
The Screven County Courthouse, built in 1964, is the fourth courthouse to serve Screven County.[4]
Geography
According to the U.S. Census Bureau, the county has a total area of 656 square miles (1,700 km2), of which 645 square miles (1,670 km2) is land and 11 square miles (28 km2) (1.6%) is water.[5] The Savannah River borders the eastern side of the county, and the Ogeechee River borders the southwest portion. Elevation varies to around 40 feet on the Savannah river to 320 feet at the Bay Branch community, located a few miles west of Sylvania. Pine, oak, dogwood, and other trees prevalent to the South can be found in Screven County.
The very northern portion of Screven County, defined by a line running from Girard southeast and parallel to State Route 24 to the South Carolina border, is located in the Middle Savannah River sub-basin of the Savannah River basin. A north-central section of the county, from Sylvania north and centered on Hiltonia, is located in the Brier Creek sub-basin of the same Savannah River basin. The southern portion of Screven County, from Newington running northwest through Sylvania, is located in the Upper Ogeechee River sub-basin of the Ogeechee River basin. The remaining southeastern corner of the county is located in the Lower Savannah River sub-basin of the larger Savannah River basin.[6]
Major highways


Adjacent counties
- Allendale County, South Carolina (north)
- Hampton County, South Carolina (east)
- Effingham County (southeast)
- Bulloch County (southwest)
- Jenkins County (west)
- Burke County (northwest)
Demographics
| Historical population | |||
|---|---|---|---|
| Census | Pop. | %± | |
| 1800 | 3,019 | — | |
| 1810 | 4,477 | 48.3% | |
| 1820 | 3,941 | −12.0% | |
| 1830 | 4,776 | 21.2% | |
| 1840 | 4,794 | 0.4% | |
| 1850 | 6,847 | 42.8% | |
| 1860 | 8,274 | 20.8% | |
| 1870 | 9,175 | 10.9% | |
| 1880 | 12,786 | 39.4% | |
| 1890 | 14,424 | 12.8% | |
| 1900 | 19,252 | 33.5% | |
| 1910 | 20,202 | 4.9% | |
| 1920 | 23,552 | 16.6% | |
| 1930 | 20,503 | −12.9% | |
| 1940 | 20,353 | −0.7% | |
| 1950 | 18,000 | −11.6% | |
| 1960 | 14,919 | −17.1% | |
| 1970 | 12,591 | −15.6% | |
| 1980 | 14,043 | 11.5% | |
| 1990 | 13,842 | −1.4% | |
| 2000 | 15,374 | 11.1% | |
| 2010 | 14,593 | −5.1% | |
| Est. 2018 | 13,938 | [7] | −4.5% |
| U.S. Decennial Census[8] 1790-1960[9] 1900-1990[10] 1990-2000[11] 2010-2016[1] | |||
2000 census
As of the census[12] of 2000, there were 15,374 people, 5,797 households, and 4,104 families living in the county. The population density was 24 people per square mile (9/km²). There were 6,853 housing units at an average density of 11 per square mile (4/km²). The racial makeup of the county was 53.56% White, 45.29% Black or African American, 0.14% Native American, 0.26% Asian, 0.05% Pacific Islander, 0.20% from other races, and 0.49% from two or more races. 0.96% of the population were Hispanic or Latino of any race.
There were 5,797 households out of which 33.70% had children under the age of 18 living with them, 48.00% were married couples living together, 18.30% had a female householder with no husband present, and 29.20% were non-families. 26.50% of all households were made up of individuals and 11.40% had someone living alone who was 65 years of age or older. The average household size was 2.60 and the average family size was 3.14.
In the county, the population was spread out with 27.90% under the age of 18, 8.90% from 18 to 24, 26.50% from 25 to 44, 22.70% from 45 to 64, and 14.00% who were 65 years of age or older. The median age was 36 years. For every 100 females there were 91.40 males. For every 100 females age 18 and over, there were 86.80 males.
The median income for a household in the county was $29,312, and the median income for a family was $34,753. Males had a median income of $30,228 versus $20,154 for females. The per capita income for the county was $13,894. About 15.50% of families and 20.10% of the population were below the poverty line, including 22.40% of those under age 18 and 25.50% of those age 65 or over.
2010 census
As of the 2010 United States Census, there were 14,593 people, 5,596 households, and 3,854 families living in the county.[13] The population density was 22.6 inhabitants per square mile (8.7/km2). There were 6,739 housing units at an average density of 10.4 per square mile (4.0/km2).[14] The racial makeup of the county was 54.6% white, 43.3% black or African American, 0.4% Asian, 0.3% American Indian, 0.3% from other races, and 1.1% from two or more races. Those of Hispanic or Latino origin made up 1.2% of the population.[13] In terms of ancestry, 14.5% were American, 9.3% were Irish, 8.9% were English, and 7.6% were German.[15]
Of the 5,596 households, 34.0% had children under the age of 18 living with them, 45.1% were married couples living together, 18.6% had a female householder with no husband present, 31.1% were non-families, and 27.3% of all households were made up of individuals. The average household size was 2.53 and the average family size was 3.07. The median age was 39.5 years.[13]
The median income for a household in the county was $32,155 and the median income for a family was $44,244. Males had a median income of $32,189 versus $25,480 for females. The per capita income for the county was $16,189. About 14.0% of families and 20.4% of the population were below the poverty line, including 23.4% of those under age 18 and 19.2% of those age 65 or over.[16]
Communities
- Cooperville
- Dover
- Halcyondale
- Hiltonia
- Hunters
- Lewis
- Millhaven
- Newington
- Oliver
- Rocky Ford
- Sheppards
- Sylvania
- White Hill
- Woodcliff
- Zeigler
Notable people
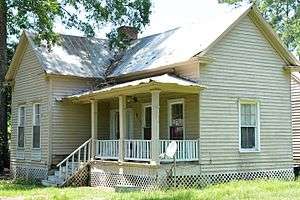
- John Abbot, naturalist, entomologist, wrote The Natural History of the Rarer Lepidopterous Insects of Georgia
- Edward Junius Black, member of the United States House of Representatives (1839–1841; 1842–1845)
- Lee Rogers Berger, explorer, paleoanthropologist
- Bucky Dent, New York Yankees shortstop (born in Savannah) but spent his early years in Sylvania
- Francys Johnson, senior NAACP official
- John R. McKinney, Georgia's most decorated World War II hero.
- Louie De Votie Newton, pastor and president of the Southern Baptist Convention
- Macay McBride, Major League Baseball pitcher
Politics
| Year | Republican | Democratic | Third parties |
|---|---|---|---|
| 2016 | 57.8% 3,305 | 40.2% 2,300 | 1.9% 110 |
| 2012 | 53.8% 3,287 | 45.4% 2,774 | 0.8% 50 |
| 2008 | 52.8% 3,423 | 46.6% 3,024 | 0.6% 40 |
| 2004 | 56.7% 3,360 | 42.8% 2,534 | 0.6% 34 |
| 2000 | 52.2% 2,461 | 47.3% 2,233 | 0.5% 25 |
| 1996 | 44.1% 1,862 | 49.5% 2,087 | 6.4% 270 |
| 1992 | 39.1% 1,705 | 44.4% 1,940 | 16.5% 721 |
| 1988 | 59.5% 2,178 | 39.9% 1,461 | 0.6% 20 |
| 1984 | 59.7% 2,583 | 40.4% 1,747 | |
| 1980 | 40.7% 1,490 | 57.8% 2,117 | 1.6% 57 |
| 1976 | 35.2% 1,176 | 64.8% 2,168 | |
| 1972 | 80.7% 2,402 | 19.3% 575 | |
| 1968 | 22.0% 916 | 33.9% 1411 | 44.0% 1,830 |
| 1964 | 61.0% 2,260 | 39.0% 1,446 | |
| 1960 | 39.1% 957 | 60.9% 1,490 | |
| 1956 | 28.1% 521 | 71.9% 1,332 | |
| 1952 | 30.4% 692 | 69.6% 1,584 | |
| 1948 | 33.2% 502 | 55.4% 838 | 11.4% 173 |
| 1944 | 18.0% 197 | 82.0% 895 | |
| 1940 | 7.8% 100 | 91.8% 1,174 | 0.4% 5 |
| 1936 | 6.1% 61 | 92.5% 933 | 1.5% 15 |
| 1932 | 8.3% 46 | 91.2% 508 | 0.5% 3 |
| 1928 | 70.2% 706 | 29.8% 300 | |
| 1924 | 25.2% 288 | 71.7% 821 | 3.1% 36 |
| 1920 | 28.9% 260 | 71.1% 639 | |
| 1916 | 12.9% 98 | 82.4% 625 | 4.7% 36 |
| 1912 | 22.3% 138 | 74.3% 460 | 3.4% 21 |
References
Dixon Hollingsworth, ed., The History of Screven County, Georgia (Dallas, Tex.: Curtis Media Corporation, 1989).
http://quickfacts.census.gov/qfd/states/13/13251.html
- "State & County QuickFacts". United States Census Bureau. Retrieved February 18, 2014.
- "Find a County". National Association of Counties. Retrieved June 7, 2011.
- "The City of Sylvania, Georgia". Mayor and Council Sylvania, GA. Retrieved March 22, 2018.
- Hellmann, Paul T. (May 13, 2013). Historical Gazetteer of the United States. Routledge. p. 248. Retrieved November 30, 2013.
- "US Gazetteer files: 2010, 2000, and 1990". United States Census Bureau. February 12, 2011. Retrieved April 23, 2011.
- "Georgia Soil and Water Conservation Commission Interactive Mapping Experience". Georgia Soil and Water Conservation Commission. Retrieved November 20, 2015.
- "Population and Housing Unit Estimates". Retrieved July 31, 2019.
- "U.S. Decennial Census". United States Census Bureau. Retrieved June 26, 2014.
- "Historical Census Browser". University of Virginia Library. Retrieved June 26, 2014.
- "Population of Counties by Decennial Census: 1900 to 1990". United States Census Bureau. Retrieved June 26, 2014.
- "Census 2000 PHC-T-4. Ranking Tables for Counties: 1990 and 2000" (PDF). United States Census Bureau. Retrieved June 26, 2014.
- "U.S. Census website". United States Census Bureau. Retrieved January 31, 2008.
- "DP-1 Profile of General Population and Housing Characteristics: 2010 Demographic Profile Data". United States Census Bureau. Archived from the original on February 13, 2020. Retrieved December 30, 2015.
- "Population, Housing Units, Area, and Density: 2010 - County". United States Census Bureau. Archived from the original on February 13, 2020. Retrieved December 30, 2015.
- "DP02 SELECTED SOCIAL CHARACTERISTICS IN THE UNITED STATES – 2006-2010 American Community Survey 5-Year Estimates". United States Census Bureau. Archived from the original on February 13, 2020. Retrieved December 30, 2015.
- "DP03 SELECTED ECONOMIC CHARACTERISTICS – 2006-2010 American Community Survey 5-Year Estimates". United States Census Bureau. Archived from the original on February 13, 2020. Retrieved December 30, 2015.
- Leip, David. "Dave Leip's Atlas of U.S. Presidential Elections". uselectionatlas.org. Retrieved March 22, 2018.
External links
Places adjacent to Screven County, Georgia | |
|---|---|
Municipalities and communities of Screven County, Georgia, United States | ||
|---|---|---|
| Cities | Map of Georgia highlighting Screven County | |
| Towns | ||
| Unincorporated communities | ||
| Ghost town | ||