Appling County, Georgia
Appling County is a county located in the southeastern part of the U.S. state of Georgia. As of the 2010 census, the population was 18,236.[2] The county seat is Baxley.[3]
Appling County | |
|---|---|
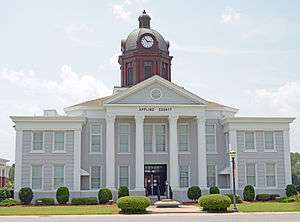 Appling County Courthouse in Baxley | |
 Location within the U.S. state of Georgia | |
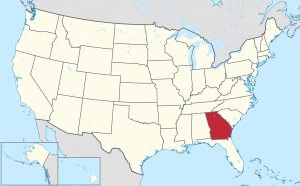 Georgia's location within the U.S. | |
| Coordinates: 31°45′N 82°17′W | |
| Country | |
| State | |
| Founded | December 15, 1818 |
| Named for | Daniel Appling |
| Seat | Baxley |
| Largest city | Baxley |
| Area | |
| • Total | 512 sq mi (1,330 km2) |
| • Land | 507 sq mi (1,310 km2) |
| • Water | 5.2 sq mi (13 km2) 1.0%% |
| Population | |
| • Estimate (2019) | 18,386[1] |
| • Density | 36/sq mi (14/km2) |
| Time zone | UTC−5 (Eastern) |
| • Summer (DST) | UTC−4 (EDT) |
| Congressional district | 12th |
| Website | www |
History
Appling County is named for Lieutenant Colonel Daniel Appling, a soldier in the War of 1812.[4] Appling County, the 42nd county created in Georgia, was established by an act of the Georgia General Assembly on December 15, 1818. The original county consisted of Creek lands ceded in the 1814 Treaty of Fort Jackson and the 1818 Treaty of the Creek Agency.
On December 15, 1824, Ware County was formed by the Georgia General Assembly from roughly the southern half of Appling land districts 4, 5, and 6, and all of land districts 7, 8, 9, 10, 11, 12, and 13. On December 24, 1825, Appling County land district 6 was added to Telfair County by an act of the Georgia General Assembly.[5] This created an ambiguity of the border between Telfair County and Ware County that was later solved by additional legislation.
On December 8, 1828, Holmesville, Georgia was declared the county seat by the General Assembly.[6] Previously, court was held at residence of William Carter Jr. In 1836, the General Assembly appointed a seven-member commission to find a location for a more centrally located county seat than Holmesville, but were not able to come to a conclusion. The need for a more central county seat would remain a point of contention in county politics for several decades.
On December 18, 1857, the part of Appling County that was south of Lightsey's Ford on Big Creek downstream to the Little Satilla River was taken from Appling County for the creation of Pierce County.[7]
At the time of the 1850 United States Census, Appling County had a white population of 2,520, a slave population of 404, and 25 free people of color. By the 1860 United States Census, the county had a white population of 3,442, a slave population of 740, and 3 free people of color.
On August 27, 1872, eastern sections of Appling land districts 3 and 4 were added to Wayne County.[8] This area included Wayne County's current county seat Jesup, Georgia, which became the new county seat of Wayne County in 1873. Also in August 1872, the General Assembly called for an election in Appling County to vote on the removal of the county seat to a point along the Macon and Brunswick Railroad. The residents voted for removal and the town of Baxley, Georgia was selected as the new county seat after the election. In February 1873, the General Assembly mistakenly passed a law giving county commissioners to sell the public lands in Holmesville so the proceeds can go to the construction of a new courthouse in Holmesville. They amended the law a year later for the new courthouse location to read Baxley as it had originally been intended.
On August 18, 1905, Jeff Davis County was created from western portions of Appling County and eastern portions Coffee County.[9] On July 27, 1914, Bacon County was created from parts of Appling County, Pierce County, and Ware County. The remaining section of Appling County that had been south of Little Satilla River became part of Bacon County.[10]
Geography
According to the U.S. Census Bureau, the county has a total area of 512 square miles (1,330 km2), of which 507 square miles (1,310 km2) is land and 5.2 square miles (13 km2) (1.0%) is water.[11]
The southern two-thirds of Appling County, south of a line from Graham to Baxley, then running due east from Baxley, is located in the Little Satilla River sub-basin of the St. Marys River-Satilla River basin. The northern third of the county is located in the Altamaha River sub-basin of the basin by the same name.[12]
Major highways
Adjacent counties
- Toombs County - north
- Tattnall County - northeast
- Wayne County - southeast
- Pierce County - south
- Jeff Davis County - west
- Bacon County - west
Demographics
| Historical population | |||
|---|---|---|---|
| Census | Pop. | %± | |
| 1820 | 1,264 | — | |
| 1830 | 1,468 | 16.1% | |
| 1840 | 2,052 | 39.8% | |
| 1850 | 2,949 | 43.7% | |
| 1860 | 4,190 | 42.1% | |
| 1870 | 5,086 | 21.4% | |
| 1880 | 5,276 | 3.7% | |
| 1890 | 8,676 | 64.4% | |
| 1900 | 12,336 | 42.2% | |
| 1910 | 12,318 | −0.1% | |
| 1920 | 10,594 | −14.0% | |
| 1930 | 13,314 | 25.7% | |
| 1940 | 14,497 | 8.9% | |
| 1950 | 14,003 | −3.4% | |
| 1960 | 13,246 | −5.4% | |
| 1970 | 12,726 | −3.9% | |
| 1980 | 15,565 | 22.3% | |
| 1990 | 15,744 | 1.2% | |
| 2000 | 17,419 | 10.6% | |
| 2010 | 18,236 | 4.7% | |
| Est. 2019 | 18,386 | [13] | 0.8% |
| U.S. Decennial Census[14] 1790-1960[15] 1900-1990[16] 1990-2000[17] 2010-2019[2] | |||
2000 census
As of the census[18] of 2000, there were 17,419 people, 6,606 households, and 4,855 families living in the county. The population density was 34 people per square mile (13/km²). There were 7,854 housing units at an average density of 15 per square mile (6/km²). The racial makeup of the county was 76.79% White, 19.59% Black or African American, 0.21% Native American, 0.30% Asian, 0.01% Pacific Islander, 2.49% from other races, and 0.61% from two or more races. 4.55% of the population were Hispanic or Latino of any race.
There were 6,606 households out of which 34.50% had children under the age of 18 living with them, 56.60% were married couples living together, 12.50% had a female householder with no husband present, and 26.50% were non-families. 23.20% of all households were made up of individuals and 9.80% had someone living alone who was 65 years of age or older. The average household size was 2.60 and the average family size was 3.04.
In the county, the population was spread out with 27.10% under the age of 18, 9.00% from 18 to 24, 28.50% from 25 to 44, 23.50% from 45 to 64, and 11.80% who were 65 years of age or older. The median age was 35 years. For every 100 females there were 97.10 males. For every 100 females age 18 and over, there were 93.30 males.
The median income for a household in the county was $30,266, and the median income for a family was $34,890. Males had a median income of $27,753 versus $18,148 for females. The per capita income for the county was $15,044. About 14.90% of families and 18.60% of the population were below the poverty line, including 23.90% of those under age 18 and 24.40% of those age 65 or over.
2010 census
As of the 2010 United States Census, there were 18,236 people, 6,969 households, and 4,894 families living in the county.[19] The population density was 36.0 inhabitants per square mile (13.9/km2). There were 8,512 housing units at an average density of 16.8 per square mile (6.5/km2).[20] The racial makeup of the county was 73.4% white, 18.6% black or African American, 0.7% Asian, 0.4% American Indian, 0.1% Pacific islander, 5.7% from other races, and 1.1% from two or more races. Those of Hispanic or Latino origin made up 9.3% of the population.[19] In terms of ancestry, 15.2% were American, 9.3% were Irish, and 8.7% were English.[21]
Of the 6,969 households, 35.0% had children under the age of 18 living with them, 51.9% were married couples living together, 12.6% had a female householder with no husband present, 29.8% were non-families, and 26.3% of all households were made up of individuals. The average household size was 2.56 and the average family size was 3.07. The median age was 38.1 years.[19]
The median income for a household in the county was $36,155 and the median income for a family was $46,005. Males had a median income of $34,757 versus $23,829 for females. The per capita income for the county was $18,977. About 16.6% of families and 22.2% of the population were below the poverty line, including 39.0% of those under age 18 and 13.0% of those age 65 or over.[22]
Education
Politics
| Year | Republican | Democratic | Third parties |
|---|---|---|---|
| 2016 | 78.4% 5,494 | 20.5% 1,434 | 1.2% 84 |
| 2012 | 73.8% 5,233 | 24.8% 1,758 | 1.4% 102 |
| 2008 | 72.6% 5,085 | 26.4% 1,846 | 1.0% 71 |
| 2004 | 70.5% 4,494 | 29.0% 1,848 | 0.5% 31 |
| 2000 | 64.6% 3,940 | 34.3% 2,093 | 1.1% 66 |
| 1996 | 50.4% 2,572 | 40.6% 2,070 | 9.0% 457 |
| 1992 | 41.7% 2,514 | 40.7% 2,455 | 17.6% 1058 |
| 1988 | 61.7% 3,000 | 37.8% 1,837 | 0.5% 22 |
| 1984 | 59.9% 2,929 | 40.1% 1,958 | |
| 1980 | 39.2% 1,961 | 59.6% 2,985 | 1.2% 61 |
| 1976 | 21.1% 961 | 78.9% 3,585 | |
| 1972 | 84.3% 2,755 | 15.7% 512 | |
| 1968 | 18.8% 795 | 18.0% 760 | 63.3% 2,678 |
| 1964 | 62.4% 2,597 | 37.6% 1,562 | |
| 1960 | 26.7% 717 | 73.4% 1,973 | |
| 1956 | 22.7% 506 | 77.3% 1,719 | |
| 1952 | 24.7% 713 | 75.4% 2,179 | |
| 1948 | 19.9% 639 | 70.7% 2,268 | 9.4% 300 |
| 1944 | 22.7% 387 | 77.3% 1,318 | |
| 1940 | 16.9% 312 | 82.2% 1,514 | 0.9% 16 |
| 1936 | 9.6% 140 | 89.8% 1,309 | 0.6% 8 |
| 1932 | 9.6% 64 | 90.4% 601 | |
| 1928 | 58.3% 579 | 41.8% 415 | |
| 1924 | 17.1% 44 | 82.5% 212 | 0.4% 1 |
| 1920 | 38.5% 196 | 61.5% 313 | |
| 1916 | 20.4% 117 | 72.0% 413 | 7.7% 44 |
| 1912 | 24.9% 149 | 60.1% 360 | 15.0% 90 |
References
- "Population and Housing Unit Estimates". U.S. Census Bureau. July 30, 2019. Retrieved July 30, 2019.
- "State & County QuickFacts". United States Census Bureau. Archived from the original on July 6, 2011. Retrieved June 17, 2014.
- "Find a County". National Association of Counties. Archived from the original on 2011-05-31. Retrieved 2011-06-07.
- Krakow, Kenneth K. (1975). Georgia Place-Names: Their History and Origins (PDF). Macon, GA: Winship Press. p. 6. ISBN 0-915430-00-2.
- Acts of the General Assembly of the State of Georgia, Passed at Milledgeville, At an Annual Session in November and December. 1825. 1. Milledgeville, Georgia: Georgia General Assembly. p. 61.
- Acts of the General Assembly of the State of Georgia, Passed in Milledgeville at an Annual Session in November and December, 1828. 1. Milledgeville. p. 168.
- Acts of the General Assembly of the State of Georgia, Passed in Milledgeville, at a Session of the Same, in November and December, 1857. 1. Milledgeville, Georgia. p. 40.
- Acts and Resolutions of the General Assembly of the State of Georgia, Passed at its Session in July and August, 1872. 1. p. 387.
- Acts and Resolutions of the General Assembly of the State of Georgia 1905. 1. Atlanta, Georgia. p. 55.
- Acts and Resolutions of the General Assembly of the State of Georgia 1914. 1. Atlanta, Georgia. p. 23.
- "US Gazetteer files: 2010, 2000, and 1990". United States Census Bureau. 2011-02-12. Retrieved 2011-04-23.
- "Georgia Soil and Water Conservation Commission Interactive Mapping Experience". Georgia Soil and Water Conservation Commission. Retrieved 2015-11-27.
- "Population and Housing Unit Estimates". Retrieved May 21, 2020.
- "U.S. Decennial Census". United States Census Bureau. Retrieved June 17, 2014.
- "Historical Census Browser". University of Virginia Library. Retrieved June 17, 2014.
- "Population of Counties by Decennial Census: 1900 to 1990". United States Census Bureau. Retrieved June 17, 2014.
- "Census 2000 PHC-T-4. Ranking Tables for Counties: 1990 and 2000" (PDF). United States Census Bureau. Retrieved June 17, 2014.
- "U.S. Census website". United States Census Bureau. Retrieved 2011-05-14.
- "DP-1 Profile of General Population and Housing Characteristics: 2010 Demographic Profile Data". United States Census Bureau. Archived from the original on 2020-02-13. Retrieved 2015-12-27.
- "Population, Housing Units, Area, and Density: 2010 - County". United States Census Bureau. Archived from the original on 2020-02-13. Retrieved 2015-12-27.
- "DP02 SELECTED SOCIAL CHARACTERISTICS IN THE UNITED STATES – 2006-2010 American Community Survey 5-Year Estimates". United States Census Bureau. Archived from the original on 2020-02-13. Retrieved 2015-12-27.
- "DP03 SELECTED ECONOMIC CHARACTERISTICS – 2006-2010 American Community Survey 5-Year Estimates". United States Census Bureau. Archived from the original on 2020-02-13. Retrieved 2015-12-27.
- Leip, David. "Dave Leip's Atlas of U.S. Presidential Elections". uselectionatlas.org. Retrieved 2018-03-18.
External links
- GeorgiaInfo.com Appling County Courthouse info
- Appling County historical marker
| Wikimedia Commons has media related to Appling County, Georgia. |
Places adjacent to Appling County, Georgia | ||||||||||
|---|---|---|---|---|---|---|---|---|---|---|
| ||||||||||
Municipalities and communities of Appling County, Georgia, United States | ||
|---|---|---|
| Cities | Map of Georgia highlighting Appling County | |
| Town | ||
| Unincorporated community | ||
| Authority control |
|
|---|