List of cities in Indiana
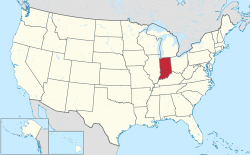
Map of the United States with Indiana highlighted
Indiana is a state located in the Midwestern United States. As of the 2016 census estimate, the state had 6,633,053 residents.
Under Indiana law, a municipality must have a minimum of 2,000 people to incorporate as a city. Except as noted, all cities are "third-class" cities with a seven-member city council and an elected clerk-treasurer. "Second-class" cities had a population of at least 35,000 and up to 600,000 at time of designation, and have a nine-member city council and an elected clerk. Indianapolis is the only "first-class" city in Indiana under state law, making it subject to a consolidated city-county government known as Unigov.
Twelve largest cities in Indiana

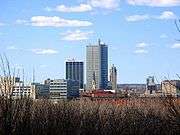
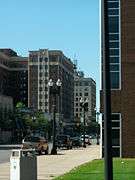
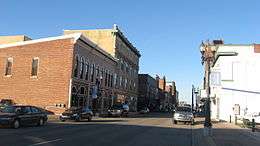
2 - Fort Wayne
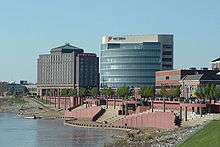
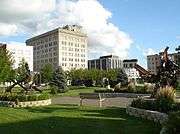
3 - Evansville

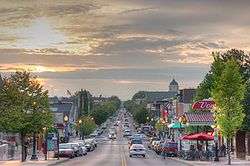
4 - South Bend

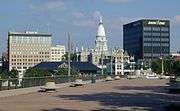
5 - Carmel
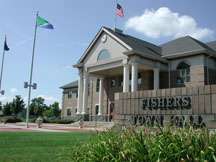
6 - Fishers
7 - Bloomington
8 - Hammond
9 - Gary
10 - Lafayette
11 - Muncie

12 - Noblesville
| 2017 Rank | City | 2017 Estimate[1] | 2010 Census[2] | Change | County | Land Area | Density |
|---|---|---|---|---|---|---|---|
| 1 | Indianapolis | 863,002 | 820,445 | +5.19% | Marion | 361.43 sq mi (936.1 km2) | 2,388/sq mi (922/km2) |
| 2 | Fort Wayne | 265,904 | 253,691 | +4.81% | Allen | 110.62 sq mi (286.5 km2) | 2,404/sq mi (928/km2) |
| 3 | Evansville | 118,930 | 117,429 | +1.28% | Vanderburgh | 44.15 sq mi (114.3 km2) | 2,694/sq mi (1,040/km2) |
| 4 | South Bend | 102,245 | 101,168 | +1.06% | St. Joseph | 41.46 sq mi (107.4 km2) | 2,466/sq mi (952/km2) |
| 5 | Carmel | 92,198 | 79,191 | +16.42% | Hamilton | 47.46 sq mi (122.9 km2) | 1,943/sq mi (750/km2) |
| 6 | Fishers | 91,832 | 76,794 | +19.58% | Hamilton | 33.59 sq mi (87.0 km2) | 2,734/sq mi (1,056/km2) |
| 7 | Bloomington | 85,071 | 80,405 | +5.80% | Monroe | 23.16 sq mi (60.0 km2) | 3,673/sq mi (1,418/km2) |
| 8 | Hammond | 76,618 | 80,830 | −5.21% | Lake | 22.78 sq mi (59.0 km2) | 3,363/sq mi (1,299/km2) |
| 9 | Gary | 76,008 | 80,294 | −5.34% | Lake | 49.87 sq mi (129.2 km2) | 1,524/sq mi (588/km2) |
| 10 | Lafayette | 72,390 | 67,140 | +7.82% | Tippecanoe | 27.74 sq mi (71.8 km2) | 2,610/sq mi (1,008/km2) |
| 11 | Muncie | 68,625 | 70,085 | −2.08% | Delaware | ||
| 12 | Noblesville | 61,882 | 51,969 | +19.07% | Hamilton | ||
| 13 | Terre Haute | 60,774 | 60,785 | −0.02% | Vigo | ||
| 14 | Kokomo | 57,836 | 45,468 | +27.20% | Howard | ||
| 15 | Greenwood | 57,375 | 49,791 | +15.23% | Johnson | ||
| 16 | Anderson | 55,076 | 56,129 | −1.88% | Madison | ||
| 17 | Elkhart | 52,558 | 50,949 | +3.16% | Elkhart | ||
| 18 | Mishawaka | 49,177 | 48,252 | +1.92% | St. Joseph | ||
| 19 | Lawrence | 48,704 | 46,001 | +5.88% | Marion | ||
| 20 | Jeffersonville | 47,383 | 44,953 | +5.41% | Clark | ||
| 21 | Columbus | 47,143 | 44,061 | +6.99% | Bartholomew | ||
| 22 | West Lafayette | 46,269 | 29,596 | +56.34% | Tippecanoe | ||
| 23 | Westfield | 39,493 | 30,068 | +31.35% | Hamilton | ||
| 24 | Portage | 36,672 | 36,828 | −0.42% | Porter | ||
| 25 | New Albany | 36,461 | 36,372 | +0.24% | Floyd | ||
| 26 | Richmond | 35,455 | 36,812 | −3.69% | Wayne | ||
| 27 | Valparaiso | 33,376 | 31,730 | +5.19% | Porter | ||
| 28 | Goshen | 33,220 | 31,719 | +4.73% | Elkhart | ||
| 29 | Michigan City | 31,056 | 31,479 | −1.34% | LaPorte | ||
| 30 | Crown Point | 29,625 | 27,317 | +8.45% | Lake | ||
| 31 | Marion | 28,327 | 29,948 | −5.41% | Grant | ||
| 32 | Hobart | 28,255 | 29,059 | −2.77% | Lake | ||
| 33 | East Chicago | 28,215 | 29,698 | −4.99% | Lake | ||
| 34 | Franklin | 25,089 | 23,712 | +5.81% | Johnson | ||
| 35 | Greenfield | 22,094 | 20,602 | +7.24% | Hancock | ||
| 36 | La Porte | 21,681 | 22,053 | −1.69% | LaPorte | ||
| 37 | Seymour | 19,480 | 17,503 | +11.30% | Jackson | ||
| 38 | Shelbyville | 19,070 | 19,191 | −0.63% | Shelby | ||
| 39 | Logansport | 17,755 | 18,396 | −3.48% | Cass | ||
| 40 | Vincennes | 17,729 | 18,423 | −3.77% | Knox | ||
| 41 | New Castle | 17,351 | 18,114 | −4.21% | Henry | ||
| 42 | Huntington | 17,084 | 17,391 | −1.77% | Huntington | ||
| 43 | Crawfordsville | 16,174 | 15,915 | +1.63% | Montgomery | ||
| 44 | Lebanon | 15,959 | 15,792 | +1.06% | Boone | ||
| 45 | Frankfort | 15,827 | 16,422 | −3.62% | Clinton | ||
| 46 | New Haven | 15,560 | 14,794 | +5.18% | Allen | ||
| 47 | Jasper | 15,519 | 15,038 | +3.20% | Dubois | ||
| 48 | Beech Grove | 14,795 | 14,192 | +4.25% | Marion | ||
| 49 | Warsaw | 14,748 | 13,559 | +8.77% | Kosciusko | ||
| 50 | Bedford | 13,296 | 13,413 | −0.87% | Lawrence | ||
| 51 | Auburn | 13,169 | 12,731 | +3.44% | DeKalb | ||
| 52 | Connersville | 12,866 | 13,481 | −4.56% | Fayette | ||
| 53 | Washington | 12,114 | 11,509 | +5.26% | Daviess | ||
| 54 | Lake Station | 11,965 | 12,572 | −4.83% | Lake | ||
| 55 | Greensburg | 11,902 | 11,492 | +3.57% | Decatur | ||
| 56 | Madison | 11,777 | 11,967 | −1.59% | Jefferson | ||
| 57 | Martinsville | 11,603 | 11,828 | −1.90% | Morgan | ||
| 58 | Peru | 11,024 | 11,417 | −3.44% | Miami | ||
| 59 | Greencastle | 10,529 | 10,326 | +1.97% | Putnam | ||
| 60 | Wabash | 10,112 | 10,666 | −5.19% | Wabash | ||
| 61 | Bluffton | 10,030 | 9,897 | +1.34% | Wells | ||
| 62 | Plymouth | 9,960 | 10,033 | −0.73% | Marshall | ||
| 63 | Kendallville | 9,848 | 9,862 | −0.14% | Noble | ||
| 64 | Decatur | 9,561 | 9,405 | +1.66% | Adams | ||
| 65 | Columbia City | 9,044 | 8,750 | +3.36% | Whitley | ||
| 66 | Angola | 8,655 | 8,612 | +0.50% | Steuben | ||
| 67 | Princeton | 8,602 | 8,644 | −0.49% | Gibson | ||
| 68 | Elwood | 8,428 | 8,614 | −2.16% | Madison, Tipton | ||
| 69 | Charlestown | 8,215 | 7,585 | +8.31% | Clark | ||
| 70 | Brazil | 8,078 | 7,912 | +2.10% | Clay | ||
| 71 | Tell City | 7,316 | 7,272 | +0.61% | Perry | ||
| 72 | Nappanee | 6,839 | 6,648 | +2.87% | Elkhart, Kosciusko | ||
| 73 | Scottsburg | 6,737 | 6,747 | −0.15% | Scott | ||
| 74 | North Vernon | 6,727 | 6,728 | −0.01% | Jennings | ||
| 75 | Batesville | 6,603 | 6,520 | +1.27% | Ripley, Franklin | ||
| 76 | Mount Vernon | 6,499 | 6,687 | −2.81% | Posey | ||
| 77 | Garrett | 6,364 | 6,286 | +1.24% | DeKalb | ||
| 78 | Boonville | 6,337 | 6,246 | +1.46% | Warrick | ||
| 79 | Salem | 6,171 | 6,319 | −2.34% | Washington | ||
| 80 | Portland | 6,143 | 6,223 | −1.29% | Jay | ||
| 81 | Huntingburg | 6,125 | 6,057 | +1.12% | Dubois | ||
| 82 | Rushville | 6,047 | 6,341 | −4.64% | Rush | ||
| 83 | Rochester | 5,990 | 6,218 | −3.67% | Fulton | ||
| 84 | Rensselaer | 5,878 | 5,859 | +0.32% | Jasper | ||
| 85 | Gas City | 5,805 | 5,965 | −2.68% | Grant | ||
| 86 | Hartford City | 5,790 | 6,220 | −6.91% | Blackford | ||
| 87 | Monticello | 5,275 | 5,378 | −1.92% | White | ||
| 88 | Linton | 5,241 | 5,413 | −3.18% | Greene | ||
| 89 | Tipton | 5,106 | 5,106 | 0.00% | Tipton | ||
| 90 | Lawrenceburg | 5,034 | 5,042 | −0.16% | Dearborn | ||
| 91 | Alexandria | 5,015 | 5,145 | −2.53% | Madison | ||
| 92 | Whiting | 4,825 | 4,997 | −3.44% | Lake | ||
| 93 | Clinton | 4,724 | 4,893 | −3.45% | Vermillion | ||
| 94 | Winchester | 4,721 | 4,935 | −4.34% | Randolph | ||
| 95 | Greendale | 4,417 | 4,520 | −2.28% | Dearborn | ||
| 96 | Ligonier | 4,372 | 4,405 | −0.75% | Noble | ||
| 97 | Mitchell | 4,261 | 4,350 | −2.05% | Lawrence | ||
| 98 | Berne | 4,135 | 3,999 | +3.40% | Adams | ||
| 99 | Austin | 4,120 | 4,295 | −4.07% | Scott | ||
| 100 | Sullivan | 4,093 | 4,249 | −3.67% | Sullivan | ||
| 101 | Aurora | 3,703 | 3,750 | −1.25% | Dearborn | ||
| 102 | Knox | 3,549 | 3,704 | −4.18% | Starke | ||
| 103 | Union City | 3,462 | 3,584 | −3.40% | Randolph | ||
| 104 | Attica | 3,147 | 3,245 | −3.02% | Fountain | ||
| 105 | Delphi | 2,882 | 2,893 | −0.38% | Carroll | ||
| 106 | Bicknell | 2,868 | 2,915 | −1.61% | Knox | ||
| 107 | Loogootee | 2,714 | 2,751 | −1.34% | Martin | ||
| 108 | Butler | 2,694 | 2,684 | +0.37% | DeKalb | ||
| 109 | Covington | 2,529 | 2,645 | −4.39% | Fountain | ||
| 110 | Oakland City | 2,405 | 2,429 | −0.99% | Gibson | ||
| 111 | Dunkirk | 2,314 | 2,362 | −2.03% | Blackford, Jay | ||
| 112 | Petersburg | 2,307 | 2,383 | −3.19% | Pike | ||
| 113 | Rockport | 2,169 | 2,270 | −4.45% | Spencer | ||
| 114 | Rising Sun | 2,146 | 2,304 | −6.86% | Ohio | ||
| 115 | Jasonville | 2,145 | 2,222 | −3.47% | Greene | ||
| 116 | Southport | 1,763 | 1,712 | +2.98% | Marion | ||
| 117 | Montpelier | 1,691 | 1,805 | −6.32% | Blackford | ||
| 118 | Jonesboro | 1,662 | 1,756 | −5.35% | Grant | ||
| 119 | Woodburn | 1,603 | 1,520 | +5.46% | Allen | ||
| 120 | Cannelton | 1,504 | 1,563 | −3.77% | Perry |
See also
References
- ↑ "City and Town Population Tables: 2010-2017". United States Census Bureau. Retrieved 1 June 2018.
- ↑ "2010 Census Redistricting Data (Public Law 94-171) Summary File". American FactFinder2. U.S. Census Bureau, 2010 Census. Retrieved 16 February 2014.
External links

This article is issued from
Wikipedia.
The text is licensed under Creative Commons - Attribution - Sharealike.
Additional terms may apply for the media files.