List of cities in South Dakota
This is a list of places incorporated in the state of South Dakota as cities. Municipalities in South Dakota can also be incorporated as towns. South Dakota also has one incorporated village, Wentworth.[1]
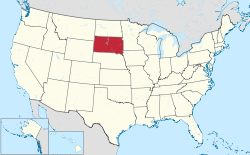
Map of the United States with South Dakota highlighted
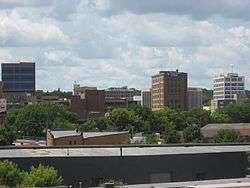
Sioux Falls, largest city in South Dakota
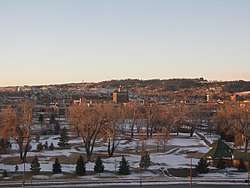
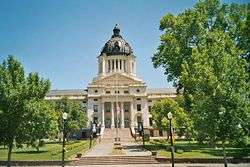
Pierre, capital of South Dakota
Cities in South Dakota, with their populations (as of July 1, 2017, per the United States Census Bureau):
| County seat | |
| State capital and county seat |
| 2017 Rank | City | 2017 Estimate[2] | 2010 Census[3] | Change | County |
|---|---|---|---|---|---|
| 1 | Sioux Falls † | 176,888 | 153,888 | +13.30% | Minnehaha |
| Lincoln | |||||
| 2 | Rapid City † | 74,421 | 67,956 | +9.51% | Pennington |
| 3 | Aberdeen † | 28,388 | 26,091 | +8.80% | Brown |
| 4 | Brookings † | 23,938 | 22,056 | +8.53% | Brookings |
| 5 | Watertown † | 22,222 | 21,482 | +3.44% | Codington |
| 6 | Mitchell † | 15,603 | 15,254 | +2.29% | Davison |
| 7 | Yankton † | 14,516 | 14,454 | +0.43% | Yankton |
| 8 | Pierre ‡ | 14,004 | 13,646 | +2.62% | Hughes |
| 9 | Huron † | 13,118 | 12,592 | +4.18% | Beadle |
| 10 | Spearfish | 11,609 | 10,494 | +10.63% | Lawrence |
| 11 | Vermillion † | 10,772 | 10,571 | +1.90% | Clay |
| 12 | Brandon | 9,957 | 8,785 | +13.34% | Minnehaha |
| 13 | Box Elder | 9,498 | 7,800 | +21.77% | Pennington Meade |
| 14 | Madison † | 7,322 | 6,474 | +13.10% | Lake |
| 15 | Sturgis † | 6,908 | 6,627 | +4.24% | Meade |
| 16 | Harrisburg | 5,968 | 4,089 | +45.95% | Lincoln |
| 17 | Belle Fourche † | 5,553 | 5,594 | −0.73% | Butte |
| 18 | Tea | 5,448 | 3,806 | +43.14% | Lincoln |
| 19 | Dell Rapids | 3,652 | 3,633 | +0.52% | Minnehaha |
| 20 | Mobridge | 3,520 | 3,465 | +1.59% | Walworth |
| 21 | Hot Springs † | 3,460 | 3,711 | −6.76% | Fall River[4] |
| 22 | Canton † | 3,430 | 3,057 | +12.20% | Lincoln |
| 23 | Hartford | 3,237 | 2,534 | +27.74% | Minnehaha |
| 24 | Milbank † | 3,133 | 3,353 | −6.56% | Grant |
| 25 | Lead | 2,978 | 3,124 | −4.67% | Lawrence |
| 26 | Winner † | 2,844 | 2,897 | −1.83% | Tripp[5] |
| 27 | North Sioux City | 2,784 | 2,530 | +10.04% | Union |
| 28 | Summerset | 2,566 | 1,814 | +41.46% | Meade |
| 29 | Sisseton † | 2,402 | 2,470 | −2.75% | Roberts |
| 30 | Chamberlain † | 2,389 | 2,387 | +0.08% | Brule |
| 31 | Lennox | 2,386 | 2,111 | +13.03% | Lincoln |
| 32 | Flandreau † | 2,333 | 2,341 | −0.34% | Moody |
| 33 | Redfield † | 2,295 | 2,333 | −1.63% | Spink |
| 34 | Fort Pierre † | 2,150 | 2,078 | +3.46% | Stanley |
| 35 | Beresford | 1,953 | 2,005 | −2.59% | Union Lincoln |
| 36 | Springfield | 1,942 | 1,989 | −2.36% | Bon Homme |
| 37-(T) | Custer † | 1,932 | 2,067 | −6.53% | Custer |
| 37-(T) | Volga | 1,932 | 1,768 | +9.28% | Brookings |
| 39 | Elk Point † | 1,828 | 1,963 | −6.88% | Union |
| 40 | Webster † | 1,773 | 1,886 | −5.99% | Day |
| 41 | Wagner | 1,587 | 1,566 | +1.34% | Charles Mix |
| 42 | Groton | 1,507 | 1,458 | +3.36% | Brown |
| 43 | Parkston | 1,497 | 1,508 | −0.73% | Hutchinson |
| 44 | Miller † | 1,376 | 1,489 | −7.59% | Hand |
| 45 | Eagle Butte | 1,345 | 1,318 | +2.05% | Dewey Ziebach |
| 46 | Crooks | 1,318 | 1,269 | +3.86% | Minnehaha |
| 47 | Deadwood † | 1,304 | 1,270 | +2.68% | Lawrence |
| 48 | Freeman | 1,289 | 1,306 | −1.30% | Hutchinson |
| 49 | Salem † | 1,277 | 1,347 | −5.20% | McCook |
| 50 | Platte | 1,272 | 1,230 | +3.41% | Charles Mix |
| 51 | Gregory | 1,255 | 1,295 | −3.09% | Gregory |
| 52 | Britton † | 1,249 | 1,241 | +0.64% | Marshall |
| 53 | Mission | 1,242 | 1,183 | +4.99% | Todd |
| 54 | Clear Lake † | 1,241 | 1,273 | −2.51% | Deuel |
| 55 | Lemmon | 1,213 | 1,227 | −1.14% | Perkins |
| 56 | Garretson | 1,172 | 1,166 | +0.51% | Minnehaha |
| 57 | Baltic | 1,171 | 1,089 | +7.53% | Minnehaha |
| 58 | Gettysburg † | 1,116 | 1,162 | −3.96% | Potter |
| 59-(T) | De Smet † | 1,067 | 1,089 | −2.02% | Kingsbury |
| 59-(T) | Martin † | 1,067 | 1,071 | −0.37% | Bennett |
| 61 | Clark † | 1,047 | 1,139 | −8.08% | Clark |
| 62 | Tyndall † | 1,044 | 1,067 | −2.16% | Bon Homme |
| 63-(T) | Hill City | 1,008 | 948 | +6.33% | Pennington |
| 63-(T) | Parker † | 1,008 | 1,022 | −1.37% | Turner |
| 65 | Worthing | 978 | 877 | +11.52% | Lincoln |
| 66 | Whitewood | 947 | 927 | +2.16% | Lawrence |
| 67 | Ipswich † | 926 | 954 | −2.94% | Edmunds |
| 68 | Wessington Springs † | 921 | 956 | −3.66% | Jerauld |
| 69 | Wall | 872 | 766 | +13.84% | Pennington |
| 70 | Centerville | 870 | 882 | −1.36% | Turner |
| 71 | Arlington | 862 | 915 | −5.79% | Kingsbury Brookings |
| 72 | Piedmont | 848 | 222 | +281.98% | Meade |
| 73 | Eureka | 840 | 868 | −3.23% | McPherson |
| 74 | Lake Andes † | 837 | 879 | −4.78% | Charles Mix |
| 75 | Scotland | 817 | 841 | −2.85% | Bon Homme |
| 76 | Philip † | 784 | 779 | +0.64% | Haakon |
| 77 | Marion | 771 | 784 | −1.66% | Turner |
| 78 | Viborg | 770 | 782 | −1.53% | Turner |
| 79 | Howard † | 867 | 858 | +1.05% | Miner |
| 80 | Valley Springs | 747 | 759 | −1.58% | Minnehaha |
| 81 | Highmore † | 738 | 795 | −7.17% | Hyde |
| 82 | Alcester | 737 | 807 | −8.67% | Union |
| 83 | Estelline | 736 | 768 | −4.17% | Hamlin |
| 84 | Faulkton † | 725 | 736 | −1.49% | Faulk |
| 85 | Plankinton † | 720 | 707 | +1.84% | Aurora |
| 86 | Elkton | 712 | 736 | −3.26% | Brookings |
| 87 | Edgemont | 711 | 774 | −8.14% | Fall River |
| 88 | Kadoka † | 704 | 654 | +7.65% | Jackson |
| 89 | Aurora | 691 | 532 | +29.89% | Brookings |
| 90-(T) | Kimball | 680 | 703 | −3.27% | Brule |
| 90-(T) | Woonsocket † | 680 | 655 | +3.82% | Sanborn |
| 92 | McLaughlin | 679 | 663 | +2.41% | Corson |
| 93 | Colton | 676 | 687 | −1.60% | Minnehaha |
| 94 | Armour † | 669 | 699 | −4.29% | Douglas |
| 95 | New Underwood | 665 | 660 | +0.76% | Pennington |
| 96 | Onida † | 650 | 658 | −1.22% | Sully |
| 97 | Selby † | 643 | 642 | +0.16% | Walworth |
| 98 | Alexandria † | 635 | 615 | +3.25% | Hanson |
| 99 | Tripp | 632 | 647 | −2.32% | Hutchinson |
| 100 | Castlewood | 626 | 627 | −0.16% | Hamlin |
| 101 | Canistota | 622 | 656 | −5.18% | McCook |
| 102 | Menno | 616 | 608 | +1.32% | Hutchinson |
| 103 | Avon | 596 | 590 | +1.02% | Bon Homme |
| 104 | Burke † | 588 | 604 | −2.65% | Gregory |
| 105 | White River † | 586 | 581 | +0.86% | Mellette |
| 106 | Colman | 585 | 594 | −1.52% | Moody |
| 107-(T) | Corsica | 580 | 592 | −2.03% | Douglas |
| 107-(T) | Newell | 580 | 603 | −3.81% | Butte |
| 109 | Humboldt | 574 | 589 | −2.55% | Minnehaha |
| 110 | St. Francis | 568 | 709 | −19.89% | Todd |
| 111 | Waubay | 567 | 576 | −1.56% | Day |
| 112 | Lake Preston | 559 | 599 | −6.68% | Kingsbury |
| 113 | Veblen | 524 | 531 | −1.32% | Marshall |
| 114 | Dupree † | 519 | 525 | −1.14% | Ziebach |
| 115 | Presho | 512 | 497 | +3.02% | Lyman |
| 116-(T) | Jefferson | 502 | 547 | −8.23% | Union |
| 116-(T) | Wilmot | 502 | 492 | +2.03% | Roberts |
| 118 | Timber Lake † | 494 | 443 | +11.51% | Dewey |
| 119 | White | 487 | 485 | +0.41% | Brookings |
| 120 | Bowdle | 485 | 502 | −3.39% | Edmunds |
| 121 | Warner | 480 | 457 | +5.03% | Brown |
| 122 | Oacoma | 478 | 451 | +5.99% | Lyman |
| 123 | Lake Norden | 476 | 467 | +1.93% | Hamlin |
| 124 | Bridgewater | 462 | 492 | −6.10% | McCook |
| 125 | Big Stone City | 457 | 467 | −2.14% | Grant |
| 126 | Emery | 455 | 447 | +1.79% | Hanson |
| 127 | Murdo † | 452 | 488 | −7.38% | Jones |
| 128 | Bryant | 446 | 456 | −2.19% | Hamlin |
| 129 | Montrose | 442 | 463 | −4.54% | McCook |
| 130 | Leola † | 439 | 457 | −3.94% | McPherson |
| 131 | Mount Vernon | 437 | 462 | −5.41% | Davison |
| 132 | Rosholt | 424 | 423 | +0.24% | Roberts |
| 133 | Herreid | 418 | 438 | −4.57% | Campbell |
| 134 | Faith | 417 | 421 | −0.95% | Meade |
| 135 | Irene | 411 | 420 | −2.14% | Clay Turner Yankton |
| 136 | Tabor | 409 | 423 | −3.31% | Bon Homme |
| 137-(T) | Gayville | 401 | 407 | −1.47% | Yankton |
| 137-(T) | Hurley | 401 | 415 | −3.37% | Turner |
| 139-(T) | Hermosa | 397 | 398 | −0.25% | Custer |
| 139-(T) | Wolsey | 397 | 376 | +5.59% | Beadle |
| 141 | Hoven | 380 | 406 | −6.40% | Potter |
| 142 | White Lake | 372 | 372 | 0.00% | Aurora |
| 143 | Florence | 371 | 374 | −0.80% | Codington |
| 144 | Hayti † | 370 | 381 | −2.89% | Hamlin |
| 145 | Blunt | 353 | 354 | −0.28% | Hughes |
| 146 | Buffalo † | 346 | 330 | +4.85% | Harding |
| 147 | Keystone | 339 | 337 | +0.59% | Pennington |
| 148 | Bison † | 335 | 333 | +0.60% | Perkins |
| 149 | Hudson | 324 | 296 | +9.46% | Lincoln |
| 150 | Ethan | 321 | 331 | −3.02% | Davison |
| 151 | Langford | 319 | 313 | +1.92% | Marshall |
| 152 | Bristol | 315 | 341 | −7.62% | Day |
| 153 | Wakonda | 307 | 321 | −4.36% | Clay |
| 154 | Pukwana | 301 | 285 | +5.61% | Brule |
| 155 | Roscoe | 299 | 329 | −9.12% | Edmunds |
| 156 | Summit | 291 | 288 | +1.04% | Roberts |
| 157-(T) | Alpena | 283 | 286 | −1.05% | Jerauld |
| 157-(T) | Colome | 283 | 296 | −4.39% | Tripp |
| 159 | Bonesteel | 275 | 275 | 0.00% | Gregory |
| 160 | Stickney | 274 | 284 | −3.52% | Aurora |
| 161 | Egan | 273 | 278 | −1.80% | Moody |
| 162-(T) | Chancellor | 261 | 264 | −1.14% | Turner |
| 162-(T) | Henry | 261 | 267 | −2.25% | Codington |
| 164 | Iroquois | 260 | 266 | −2.26% | Kingsbury Beadle |
| 165 | Kennebec † | 257 | 240 | +7.08% | Lyman |
| 166 | New Effington | 251 | 256 | −1.95% | Roberts |
| 167 | Willow Lake | 240 | 263 | −8.75% | Clark |
| 168 | Trent | 231 | 232 | −0.43% | Moody |
| 169 | Pickstown | 225 | 201 | +11.94% | Charles Mix |
| 170-(T) | Gary | 224 | 227 | −1.32% | Deuel |
| 170-(T) | Nisland | 224 | 232 | −3.45% | Butte |
| 170-(T) | Pollock | 224 | 241 | −7.05% | Campbell |
| 170-(T) | South Shore | 224 | 225 | −0.44% | Codington |
| 174 | Hecla | 223 | 227 | −1.76% | Brown |
| 175 | Delmont | 220 | 234 | −5.98% | Douglas |
| 176 | Reliance | 219 | 191 | +14.66% | Lyman |
| 177 | Mellette | 214 | 210 | +1.90% | Spink |
| 178 | Geddes | 212 | 208 | +1.92% | Charles Mix |
| 179 | Tulare | 211 | 207 | +1.93% | Spink |
| 180-(T) | Ramona | 205 | 174 | +17.82% | Lake |
| 180-(T) | Toronto | 205 | 212 | −3.30% | Deuel |
| 182 | Bruce | 202 | 204 | −0.98% | Brookings |
| 183 | Frederick | 200 | 199 | +0.50% | Brown |
| 184 | Wentworth | 194 | 171 | +13.45% | Lake |
| 185 | St. Lawrence | 193 | 198 | −2.53% | Hand |
| 186 | Hosmer | 192 | 208 | −7.69% | Edmunds |
| 187 | Doland | 183 | 180 | +1.67% | Spink |
| 188 | Letcher | 182 | 173 | +5.20% | Sanborn |
| 189 | Wessington | 176 | 170 | +3.53% | Beadle Hand |
| 190 | Kranzburg | 175 | 172 | +1.74% | Codington |
| 191-(T) | McIntosh † | 173 | 173 | 0.00% | Corson |
| 191-(T) | Roslyn | 173 | 183 | −5.46% | Day |
| 193 | Mission Hill | 168 | 177 | −5.08% | Yankton |
| 194 | Peever | 166 | 168 | −1.19% | Roberts |
| 195 | Volin | 165 | 161 | +2.48% | Yankton |
| 196 | Monroe | 158 | 160 | −1.25% | Turner |
| 197 | Isabel | 154 | 135 | +14.07% | Dewey |
| 198 | Frankfort | 152 | 149 | +2.01% | Spink |
| 199 | Northville | 147 | 143 | +2.80% | Spink |
| 200-(T) | Goodwin | 145 | 146 | −0.68% | Deuel |
| 200-(T) | Spencer | 145 | 154 | −5.84% | McCook |
| 202 | Artesian | 143 | 138 | +3.62% | Sanborn |
| 203 | Conde | 142 | 140 | +1.43% | Spink |
| 204 | Columbia | 141 | 136 | +3.68% | Brown |
| 205 | Buffalo Gap | 139 | 126 | +10.32% | Custer |
| 206 | Westport | 135 | 133 | +1.50% | Brown |
| 207 | Astoria | 134 | 139 | −3.60% | Deuel |
| 208 | Carthage | 132 | 144 | −8.33% | Miner |
| 209-(T) | Claremont | 131 | 127 | +3.15% | Brown |
| 209-(T) | Dimock | 131 | 125 | +4.80% | Hutchinson |
| 211-(T) | Central City | 130 | 134 | −2.99% | Lawrence |
| 211-(T) | Midland | 130 | 129 | +0.78% | Haakon |
| 213-(T) | Java | 129 | 129 | 0.00% | Walworth |
| 213-(T) | Lesterville | 129 | 127 | +1.57% | Yankton |
| 215 | Ashton | 125 | 122 | +2.46% | Spink |
| 216 | Pierpont | 124 | 135 | −8.15% | Day |
| 217-(T) | Dallas | 123 | 120 | +2.50% | Gregory |
| 217-(T) | Oelrichs | 123 | 126 | −2.38% | Fall River |
| 219-(T) | Cavour | 122 | 114 | +7.02% | Beadle |
| 219-(T) | Harrold | 122 | 124 | −1.61% | Hughes |
| 219-(T) | Oldham | 122 | 133 | −8.27% | Kingsbury |
| 219-(T) | Sinai | 122 | 120 | +1.67% | Brookings |
| 223 | Batesland | 116 | 108 | +7.41% | Oglala Lakota |
| 224-(T) | Fairfax | 115 | 115 | 0.00% | Gregory |
| 224-(T) | Yale | 115 | 108 | +6.48% | Beadle |
| 226 | Pringle | 108 | 112 | −3.57% | Custer |
| 227 | Revillo | 107 | 119 | −10.08% | Grant |
| 228-(T) | Corona | 106 | 109 | −2.75% | Roberts |
| 228-(T) | Herrick | 106 | 105 | +0.95% | Gregory |
| 228-(T) | Stockholm | 106 | 108 | −1.85% | Grant |
| 231-(T) | Brandt | 105 | 107 | −1.87% | Deuel |
| 231-(T) | Glenham | 105 | 105 | 0.00% | Walworth |
| 231-(T) | Interior | 105 | 94 | +11.70% | Jackson |
| 234 | Cresbard | 103 | 104 | −0.96% | Faulk |
| 235-(T) | Badger | 100 | 107 | −6.54% | Kingsbury |
| 235-(T) | Canova | 100 | 105 | −4.76% | Miner |
| 237 | Hitchcock | 95 | 91 | +4.40% | Beadle |
| 238-(T) | Fairburn | 94 | 85 | +10.59% | Custer |
| 238-(T) | Fulton | 94 | 91 | +3.30% | Hanson |
| 240 | Eden | 93 | 89 | +4.49% | Marshall |
| 241 | Davis | 88 | 85 | +3.53% | Turner |
| 242-(T) | Hazel | 87 | 91 | −4.40% | Hamlin |
| 242-(T) | Wallace | 87 | 85 | +2.35% | Codington |
| 244 | Dante | 86 | 84 | +2.38% | Charles Mix |
| 245 | Andover | 84 | 91 | −7.69% | Day |
| 246 | Wasta | 82 | 80 | +2.50% | Pennington |
| 247 | Sherman | 81 | 78 | +3.85% | Minnehaha |
| 248 | Agar | 80 | 76 | +5.26% | Sully |
| 249 | Brentford | 79 | 77 | +2.60% | Spink |
| 250 | Claire City | 77 | 76 | +1.32% | Roberts |
| 251 | New Witten | 76 | 79 | −3.80% | Tripp |
| 252-(T) | Bradley | 75 | 72 | +4.17% | Clark |
| 252-(T) | Stratford | 75 | 72 | +4.17% | Brown |
| 254 | Olivet † | 72 | 74 | −2.70% | Hutchinson |
| 255-(T) | Draper | 71 | 82 | −13.41% | Jones |
| 255-(T) | Strandburg | 71 | 72 | −1.39% | Grant |
| 257-(T) | Fairview | 69 | 60 | +15.00% | Lincoln |
| 257-(T) | Morristown | 69 | 67 | +2.99% | Corson |
| 259 | Twin Brooks | 68 | 69 | −1.45% | Grant |
| 260-(T) | La Bolt | 67 | 68 | −1.47% | Grant |
| 260-(T) | Mound City † | 67 | 71 | −5.63% | Campbell |
| 260-(T) | Utica | 67 | 65 | +3.08% | Yankton |
| 263 | Ortley | 66 | 65 | +1.54% | Roberts |
| 264 | Fruitdale | 65 | 64 | +1.56% | Butte |
| 265-(T) | Camp Crook | 64 | 63 | +1.59% | Harding |
| 265-(T) | Ravinia | 64 | 61 | +4.92% | Charles Mix |
| 265-(T) | Wood | 64 | 62 | +3.23% | Mellette |
| 268 | Bushnell | 63 | 65 | −3.08% | Brookings |
| 269 | Orient | 61 | 63 | −3.17% | Faulk |
| 270-(T) | Quinn | 60 | 54 | +11.11% | Pennington |
| 270-(T) | Ree Heights | 60 | 62 | −3.23% | Hand |
| 272-(T) | Brant Lake | 59 | 159 | −62.89% | Hand |
| 272-(T) | Lane | 59 | 59 | 0.00% | Jerauld |
| 274-(T) | Belvidere | 56 | 49 | +14.29% | Jackson |
| 274-(T) | Garden City | 56 | 53 | +5.66% | Clark |
| 276 | Grenville | 55 | 54 | +1.85% | Day |
| 277-(T) | Nunda | 52 | 43 | +20.93% | Lake |
| 277-(T) | Raymond | 52 | 50 | +4.00% | Clark |
| 279 | Lake City | 51 | 51 | 0.00% | Marshall |
| 280 | Ward | 50 | 48 | +4.17% | Moody |
| 281 | Turton | 49 | 48 | +2.08% | Spink |
| 282 | Hetland | 48 | 46 | +4.35% | Kingsbury |
| 283-(T) | Akaska | 47 | 42 | +11.90% | Walworth |
| 283-(T) | Naples | 47 | 41 | +14.63% | Clark |
| 285-(T) | Lebanon | 44 | 47 | −6.38% | Potter |
| 285-(T) | Vienna | 44 | 45 | −2.22% | Clark |
| 287 | Erwin | 43 | 45 | −4.44% | Kingsbury |
| 288-(T) | Dolton | 38 | 37 | +2.70% | Turner |
| 288-(T) | Tolstoy | 38 | 36 | +5.56% | Potter |
| 290 | Seneca | 37 | 38 | −2.63% | Faulk |
| 291 | Broadland | 34 | 31 | +9.68% | Beadle |
| 292 | Altamont | 33 | 34 | −2.94% | Deuel |
| 293 | Rockham | 32 | 33 | −3.03% | Faulk |
| 294 | Long Lake | 31 | 31 | 0.00% | McPherson |
| 295 | Marvin | 29 | 34 | −14.71% | Grant |
| 296 | Chelsea | 27 | 27 | 0.00% | Faulk |
| 297-(T) | Bancroft | 19 | 19 | 0.00% | Kingsbury |
| 297-(T) | Vilas | 19 | 20 | −5.00% | Miner |
| 299 | Butler | 17 | 17 | 0.00% | Day |
| 300 | Virgil | 16 | 16 | 0.00% | Beadle |
| 301-(T) | Albee | 15 | 16 | −6.25% | Grant |
| 301-(T) | Onaka | 15 | 15 | 0.00% | Faulk |
| 303-(T) | Cottonwood | 10 | 9 | +11.11% | Jackson |
| 303-(T) | Farmer | 10 | 10 | 0.00% | Hanson |
| 305-(T) | Artas | 8 | 9 | −11.11% | Campbell |
| 305-(T) | Wetonka | 8 | 8 | 0.00% | McPherson |
| 307 | Lowry | 6 | 6 | 0.00% | Walworth |
| 308 | Verdon | 5 | 5 | 0.00% | Brown |
| 309 | Lily | 4 | 4 | 0.00% | Day |
| 310-(T) | Hillsview | 3 | 3 | 0.00% | McPherson |
| 310-(T) | White Rock | 3 | 3 | 0.00% | Roberts |
| 312 | Buffalo Chip | 0 | 0 | NA | Meade |
See also
References
- ↑ "US Board on Geographic Names". United States Geological Survey. 2007-10-25. Retrieved 2008-01-31.
- ↑ "Annual Estimates of the Resident Population: April 1, 2010 to July 1, 2017". United States Census Bureau. Retrieved 25 May 2017.
- ↑ "2010 Census Redistricting Data (Public Law 94-171) Summary File". American FactFinder2. U.S. Census Bureau, 2010 Census. Retrieved 29 October 2012.
- ↑ Hot Springs is also the de facto county seat of neighboring Oglala Lakota County.
- ↑ Winner is also the de facto county seat of neighboring Todd County.
This article is issued from
Wikipedia.
The text is licensed under Creative Commons - Attribution - Sharealike.
Additional terms may apply for the media files.