List of cities in Texas by population
Map of the United States with Texas shaded in red

1 – Houston, largest city in the state
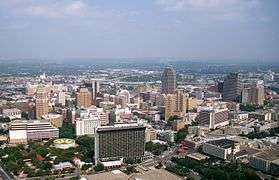
2 – San Antonio
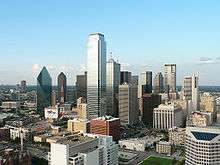
3 – Dallas

4 – Austin, capital of the state
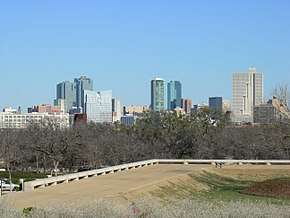
5 – Fort Worth
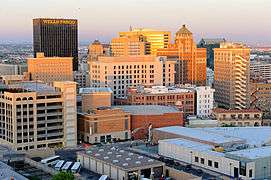
6 – El Paso

7 – Arlington
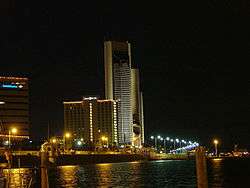
8 – Corpus Christi
The following is a list of the most populous incorporated cities, towns, and unincorporated census-designated places (CDPs) in the U.S. state of Texas. The population is according to the 2015 and 2016 census estimates from the United States Census Bureau.[1] Population and Housing Unit Estimates.[2] San Marcos was the fastest growing city in the state between 2010 and 2015.[3]
| Rank | Place name | 2015 population | 2010 Census | % Change |
|---|---|---|---|---|
| 1 | Houston | 2,296,224 | 2,100,389 | 9.34% |
| 2 | San Antonio | 1,469,845 | 1,327,407 | 10.73% |
| 3 | Dallas | 1,317,929 | 1,197,816 | 8.53% |
| 4 | Austin | 931,820 | 790,390 | 17.89% |
| 5 | Fort Worth | 833,319 | 741,206 | 12.42% |
| 6 | El Paso | 681,124 | 649,121 | 4.93% |
| 7 | Arlington | 388,125 | 365,438 | 6.20% |
| 8 | Corpus Christi | 324,074 | 305,215 | 6.17% |
| 9 | Plano | 283,558 | 259,841 | 9.12% |
| 10 | Laredo | 255,473 | 236,091 | 8.20% |
| 11 | Lubbock | 249,042 | 229,573 | 8.48% |
| 12 | Garland | 236,897 | 226,876 | 4.41% |
| 13 | Irving | 236,607 | 216,290 | 9.39% |
| 14 | Amarillo | 198,645 | 190,695 | 4.21% |
| 15 | Grand Prairie | 187,809 | 175,396 | 7.07% |
| 16 | Brownsville | 183,887 | 175,023 | 5.06% |
| 17 | McKinney | 162,898 | 131,117 | 24.23% |
| 18 | Frisco | 154,407 | 116,989 | 31.98% |
| 19 | Pasadena | 153,784 | 149,043 | 3.18% |
| 20 | Mesquite | 144,788 | 139,824 | 3.55% |
| 21 | Killeen | 140,806 | 127,921 | 10.07% |
| 22 | McAllen | 140,269 | 130,242 | 7.69% |
| 23 | Carrollton | 133,168 | 119,097 | 11.81% |
| 24 | Midland | 132,950 | 111,147 | 19.61% |
| 25 | Waco | 132,356 | 124,805 | 6.05% |
| 26 | Denton | 131,044 | 113,383 | 13.24% |
| 27 | Abilene | 121,721 | 117,063 | 3.97% |
| 28 | Odessa | 118,968 | 99,940 | 19.03% |
| 29 | Beaumont | 118,129 | 118,296 | –0.14% |
| 30 | Round Rock | 115,997 | 99,887 | 16.12% |
| 31 | The Woodlands (CDP)[4] | 112,505 | 93,847 | 19.88% |
| 32 | Richardson | 110,815 | 99,223 | 11.68% |
| 33 | Pearland | 108,821 | 91,252 | 19.25% |
| 34 | College Station | 107,889 | 93,857 | 14.95% |
| 35 | Wichita Falls | 104,710 | 104,553 | 0.15% |
| 36 | Lewisville | 104,039 | 95,290 | 9.18% |
| 37 | Tyler | 103,700 | 96,500 | 7.46% |
| 38 | San Angelo | 100,450 | 93,200 | 7.77% |
| 39 | League City | 98,312 | 83,560 | 17.65% |
| 40 | Allen | 98,143 | 84,246 | 16.49% |
| 41 | Sugar Land | 88,156 | 78,817 | 11.84% |
| 42 | Edinburg | 84,497 | 77,100 | 9.59% |
| 43 | Mission | 83,298 | 77,058 | 8.09% |
| 44 | Longview | 82,287 | 80,455 | 2.27% |
| 45 | Bryan | 82,118 | 76,201 | 7.76% |
| 46 | Pharr | 76,538 | 70,400 | 8.71% |
| 47 | Baytown | 76,335 | 71,802 | 6.31% |
| 48 | Missouri City | 74,139 | 67,358 | 10.06% |
| 49 | Temple | 72,277 | 66,102 | 9.34% |
| 50 | Flower Mound | 71,253 | 64,669 | 10.18% |
| 51 | New Braunfels | 70,543 | 57,740 | 22.17% |
| 52 | North Richland Hills | 69,204 | 63,343 | 9.25% |
| 53 | Conroe | 68,602 | 56,207 | 22.05% |
| 54 | Victoria | 67,574 | 62,592 | 7.95% |
| 55 | Cedar Park | 65,945 | 48,937 | 34.75% |
| 56 | Harlingen | 65,774 | 64,849 | 1.42% |
| 57 | Atascocita (CDP) | 65,844 | 65,844 | 0.00% |
| 58 | Mansfield | 64,274 | 56,368 | 14.02% |
| 59 | Georgetown | 63,716 | 47,400 | 34.42% |
| 60 | San Marcos | 60,684 | 44,894 | 35.17% |
| 61 | Rowlett | 60,236 | 56,199 | 7.18% |
| 62 | Pflugerville | 57,122 | 46,936 | 21.70% |
| 63 | Port Arthur | 55,340 | 53,818 | 2.82% |
| 64 | Spring (CDP) | 54,298 | 54,298 | 0.00% |
| 65 | Euless | 54,219 | 51,277 | 5.73% |
| 66 | DeSoto | 52,486 | 49,047 | 7.01% |
| 67 | Grapevine | 51,404 | 46,334 | 10.94% |
| 68 | Galveston | 50,180 | 47,743 | 5.10% |
See also
References
- ↑ US Census Bureau Quick Facts. "Quick Facts, Irving Texas". Census.gov. U.S. Census Bureau. Retrieved February 26, 2018.
- ↑ Retrieved from "Archived copy". Archived from the original on May 18, 2016. Retrieved May 19, 2016.
- ↑ United States Census Bureau (2015). Population and Housing Unit Estimates. Retrieved from "Archived copy". Archived from the original on May 18, 2016. Retrieved May 19, 2016.
- ↑ http://www.thewoodlandstownship-tx.gov/DocumentCenter/Home/View/667
External links
- 2010 Census: Population of Texas Cities Arranged in Descending Order
- Census-designated places in Texas
- Cities in Texas
This article is issued from
Wikipedia.
The text is licensed under Creative Commons - Attribution - Sharealike.
Additional terms may apply for the media files.