Demographics of Armenia

http://www.armstat.am
| Census population and average annual growth rate | ||
|---|---|---|
| Year | Pop. | ±% |
| 1831 | 161,747 | — |
| 1873 | 496,140 | +206.7% |
| 1897 | 797,853 | +60.8% |
| 1926 | 878,929 | +10.2% |
| 1939 | 1,282,338 | +45.9% |
| 1959 | 1,763,048 | +37.5% |
| 1970 | 2,491,873 | +41.3% |
| 1979 | 3,037,259 | +21.9% |
| 1989 | 3,304,776 | +8.8% |
| 2001 | 3,213,011 | −2.8% |
| 2011 | 3,018,854 | −6.0% |
| For 1831 and 1897[1] For 1873[2] | ||
Demographics trends
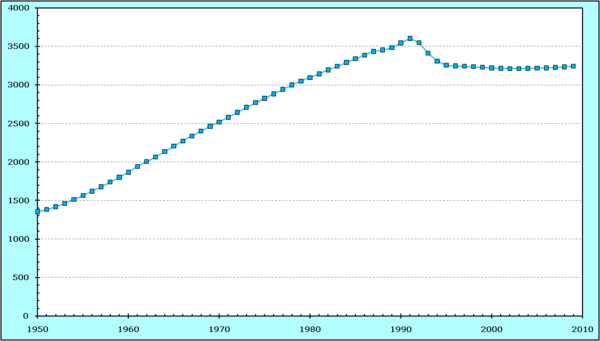
After registering a steady increase during Soviet period, the population of Armenia declined from peak value of nearly 3.6 mln to 2.92 mln in 2016.[3][4][5]
Armenia is the only republic of the former Soviet Union that has an ethnically nearly homogeneous population. It is also the third most densely populated post-Soviet state.[6] Ethnic minorities include Russians, Assyrians, Ukrainians, Yazidi Kurds, Iranians, Greeks, Georgians, and Belarusians. There are also smaller communities of Vlachs, Mordvins, Ossetians, Udis, and Tats. Minorities of Poles and Caucasus Germans also exist though they are heavily Russified.[7]
The country's population has declined due to increased emigration since the break-up of the Soviet Union. The rates of emigration and population decline, however, have decreased in recent years, and there has been a moderate influx of Armenians returning to Armenia.
Human development
According to 2016 human development report [8] Armenia has the highest inequality-adjusted HDI and the lowest coefficient of human inequality compared to all of its neighbouring countries.
Languages
Armenian is the only official language.
Armenia is a member of the La Francophonie due to a small percentage of people studying enough French.
The largest communities of the ethnic Armenian diaspora are fluent in Russian and English.
Religions
Most Armenians are Christian, primarily of Apostolic Church rite. Armenia is considered the first nation to adopt Christianity, which was first preached in Armenia by two Apostles of Jesus, St. Bartholomew and St. Thaddeus in the 1st century. The Armenian Apostolic Church can trace its roots back to the 3rd and 4th centuries. The country formally adopted the Christian faith in 301 A.D. Over 90% of Armenians belong to the Armenian Apostolic Church. It is a very ritualistic, conservative church, roughly comparable to the Coptic and Syrian churches. Armenia also has a population of Catholics and evangelical Protestants.
According to the Census of 2011 the religion in Armenia is the following: Christianity 2,862,366 (94.8%) of whom 2,797,187 Armenian Apostolic (92.5%), 29,280 Evangelical, 13,996 Armenian and Roman (Latin) Catholic, 8,695 Jehovah's Witness, 8,587 Eastern Orthodox (Russian, Ukrainian, Georgian, Greek), 2,874 Molokan (non-Orthodox Russians), 1,733 Assyrian Church of the East (Nestorian), 733 Protestant, 241 Mormon, Yazidism (0.8%), Paganism (0.2%), 812 Islam, 5,299 Other Religion (0.2%), 121,587 No Response (4%).[9]
Vital statistics
Fertility Rate (The Demographic Health Survey) [10]
Fertility Rate (TFR) (Wanted Fertility Rate) and CBR (Crude Birth Rate):
| Year | CBR (Total) | TFR (Total) | CBR (Urban) | TFR (Urban) | CBR (Rural) | TFR (Rural) |
|---|---|---|---|---|---|---|
| 2000 | 13.9 | 1.7 (1.5) | 12.1 | 1.5 (1.3) | 16.3 | 2.1 (1.7) |
| 2005 | 14.6 | 1.7 (1.6) | 14.5 | 1.6 (1.6) | 14.9 | 1,8 (1,6) |
| 2010 | 14.0 | 1.7 (1.6) | 12.8 | 1.6 (1.5) | 16.2 | 1.8 (1.8) |
| 2015-2016 | 12.9 | 1.7 (1.7) | 12.7 | 1.7 (1.6) | 13.2 | 1.8 (1.8) |
Armenia's Total Fertility Rate at 1.6 was lowest in the region in 2017 [11].
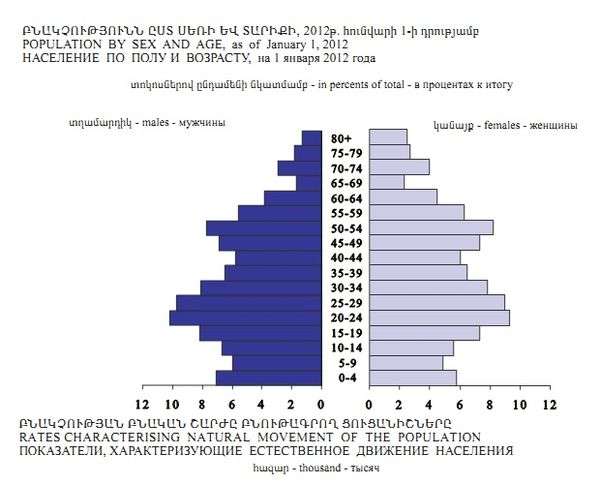
Structure of the population [12]
Structure of the population (12.10.2011) (Census):
| Age Group | Male | Female | Total | % |
|---|---|---|---|---|
| Total | 1 448 052 | 1 570 802 | 3 018 854 | 100 |
| 0-4 | 110 565 | 97 007 | 207 572 | 6,88 |
| 5-9 | 96 429 | 83 500 | 179 929 | 5,96 |
| 10-14 | 95 458 | 83 179 | 178 637 | 5,92 |
| 15-19 | 117 938 | 115 137 | 233 075 | 7,72 |
| 20-24 | 143 897 | 148 337 | 292 234 | 9,68 |
| 25-29 | 132 109 | 139 820 | 271 929 | 9,01 |
| 30-34 | 108 114 | 114 891 | 223 005 | 7,39 |
| 35-39 | 89 073 | 98 348 | 187 421 | 6,21 |
| 40-44 | 82 502 | 94 462 | 176 964 | 5,86 |
| 45-49 | 98 064 | 112 996 | 211 060 | 6,99 |
| 50-54 | 109 294 | 125 238 | 234 532 | 7,77 |
| 55-59 | 80 989 | 96 769 | 177 758 | 5,89 |
| 60-64 | 56 189 | 71 410 | 127 599 | 4,23 |
| 65-69 | 28 020 | 37 353 | 65 373 | 2,17 |
| 70-74 | 44 041 | 63 637 | 107 678 | 3,57 |
| 75-79 | 30 734 | 44 643 | 75 377 | 2,50 |
| 80-84 | 18 662 | 30 244 | 48 906 | 1,62 |
| 85+ | 5 974 | 13 831 | 19 805 | 0,66 |
| Age group | Male | Female | Total | Percent |
|---|---|---|---|---|
| 0-14 | 302 452 | 263 686 | 566 138 | 18,75 |
| 15-64 | 1 018 169 | 1 117 408 | 2 135 577 | 70,74 |
| 65+ | 127 431 | 189 708 | 317 139 | 10,51 |
Vital statistics summary data [13][14][15][16][17]
| Average population (x 1000) | Live births | Deaths | Natural change | Crude birth rate (per 1000) | Crude death rate (per 1000) | Natural change (per 1000) | Total fertility rate | Infant mortality rate (per 1000 births) | Life expectancy males | Life expectancy females | |
|---|---|---|---|---|---|---|---|---|---|---|---|
| 1950 | 1,354 | 43,414 | 11,525 | 31,889 | 32.1 | 8.5 | 23.6 | ||||
| 1951 | 1,378 | 49,790 | 12,482 | 37,308 | 36.1 | 9.1 | 27.1 | ||||
| 1952 | 1,415 | 53.845 | 12,916 | 40,929 | 38.1 | 9.1 | 28.9 | ||||
| 1953 | 1,454 | 51,025 | 14,007 | 37,018 | 35.1 | 9.6 | 25.5 | ||||
| 1954 | 1,504 | 57,995 | 12,301 | 45,900 | 38.6 | 8.2 | 30.4 | ||||
| 1955 | 1,564 | 59,477 | 13,763 | 45,714 | 38.0 | 8.8 | 29.2 | ||||
| 1956 | 1,616 | 62,119 | 12,286 | 50,000 | 38.5 | 7.6 | 30.8 | ||||
| 1957 | 1,671 | 66,862 | 14,101 | 52,761 | 40.0 | 8.4 | 31.6 | ||||
| 1958 | 1,732 | 71,213 | 14,089 | 57,124 | 41.1 | 8.1 | 33.0 | ||||
| 1959 | 1,796 | 72,211 | 13,968 | 58,243 | 40.2 | 7.8 | 32.4 | ||||
| 1960 | 1,867 | 74,825 | 12,675 | 62,150 | 40.1 | 6.8 | 33.3 | 4.63 | |||
| 1961 | 1,942 | 72,377 | 12,496 | 59,881 | 37.3 | 6.4 | 30.8 | 4.27 | |||
| 1962 | 2,005 | 69,505 | 13,297 | 56,208 | 34.7 | 6.6 | 28.0 | 4.17 | |||
| 1963 | 2,064 | 67,382 | 12,046 | 55,336 | 32.6 | 5.8 | 26.8 | 4.11 | |||
| 1964 | 2,133 | 64,454 | 12,415 | 52,039 | 30.2 | 5.8 | 24.4 | 3.98 | |||
| 1965 | 2,205 | 62,969 | 12,582 | 50,387 | 28.6 | 5.7 | 22.9 | 3.91 | |||
| 1966 | 2,273 | 61,594 | 12,445 | 49,149 | 27.1 | 5.5 | 21.6 | 3.69 | |||
| 1967 | 2,337 | 57,031 | 12,622 | 44,409 | 24.4 | 5.4 | 19.0 | 3.55 | |||
| 1968 | 2,401 | 57,503 | 12,231 | 45,272 | 23.9 | 5.1 | 18.9 | 3.46 | |||
| 1969 | 2,462 | 56,203 | 12,782 | 43,421 | 22.8 | 5.2 | 17.6 | 3.20 | |||
| 1970 | 2,518 | 55,694 | 12,844 | 42,850 | 22.1 | 5.1 | 17.0 | 3.17 | |||
| 1971 | 2,580 | 58,188 | 12,518 | 45,670 | 22.6 | 4.9 | 17.7 | 3.18 | |||
| 1972 | 2,644 | 59,313 | 13,730 | 45,583 | 22.4 | 5.2 | 17.2 | 3.07 | |||
| 1973 | 2,708 | 59,593 | 14,102 | 45,491 | 22.0 | 5.2 | 16.8 | 2.92 | |||
| 1974 | 2,770 | 60,419 | 14,276 | 46,143 | 21.8 | 5.2 | 16.7 | 2.82 | |||
| 1975 | 2,826 | 62,866 | 15,498 | 47,368 | 22.2 | 5.5 | 16.8 | 2.79 | |||
| 1976 | 2,883 | 65,065 | 15,688 | 49,377 | 22.6 | 5.4 | 17.1 | 2.72 | |||
| 1977 | 2,943 | 65,830 | 15,813 | 50,017 | 22.4 | 5.4 | 17.0 | 2.61 | |||
| 1978 | 3,001 | 66,698 | 16,465 | 50,233 | 22.2 | 5.5 | 16.7 | 2.46 | |||
| 1979 | 3,051 | 69,786 | 17,125 | 52,661 | 22.9 | 5.6 | 17.3 | 2.38 | |||
| 1980 | 3,096 | 70,324 | 17,124 | 53,200 | 22.7 | 5.5 | 17.2 | 2.33 | |||
| 1981 | 3,144 | 73,682 | 16,659 | 57,023 | 23.4 | 5.3 | 18.1 | 2.31 | |||
| 1982 | 3,194 | 74,225 | 17,469 | 56,756 | 23.2 | 5.5 | 17.8 | 2.26 | |||
| 1983 | 3,243 | 76,436 | 18,369 | 58,067 | 23.6 | 5.7 | 17.9 | 2.35 | |||
| 1984 | 3,292 | 79,767 | 19,043 | 60,724 | 24.2 | 5.8 | 18.4 | 2.44 | |||
| 1985 | 3,339 | 80,306 | 19,581 | 60,725 | 24.1 | 5.9 | 18.2 | 2.56 | |||
| 1986 | 3,387 | 81,192 | 19,410 | 61,782 | 24.0 | 5.7 | 18.2 | 2.58 | |||
| 1987 | 3,435 | 78,492 | 19,727 | 58,765 | 22.9 | 5.7 | 17.1 | 2.55 | |||
| 1988 | 3,453 | 74,707 | 35,5672 | 39,140 | 21.6 | 10.3 | 11.3 | 2.49 | |||
| 1989 | 3,482 | 75,250 | 20,853 | 54,397 | 21.6 | 6.0 | 15.6 | 2.61 | |||
| 1990 | 3,545 | 79,882 | 21,993 | 57,889 | 22.5 | 6.2 | 16.3 | 2.63 | |||
| 1991 | 3,604 | 77,825 | 23,425 | 54,400 | 21.6 | 6.5 | 15.1 | 2.60 | |||
| 1992 | 3,549 | 70,581 | 25,824 | 44,757 | 19.9 | 7.3 | 12.6 | 2.44 | |||
| 1993 | 3,410 | 59,041 | 27,500 | 31,541 | 17.3 | 8.1 | 9.2 | 2.14 | |||
| 1994 | 3,309 | 51,143 | 24,648 | 26,495 | 15.5 | 7.4 | 8.0 | 1.878 | |||
| 1995 | 3,255 | 48,960 | 24,842 | 24,118 | 15.0 | 7.6 | 7.4 | 1.842 | |||
| 1996 | 3,247 | 48,134 | 24,936 | 23,198 | 14.8 | 7.7 | 7.1 | 1.834 | |||
| 1997 | 3,242 | 43,929 | 23,985 | 19,944 | 13.5 | 7.4 | 6.2 | 1.680 | |||
| 1998 | 3,235 | 39,366 | 23,210 | 16,156 | 12.2 | 7.2 | 5.0 | 1.509 | |||
| 1999 | 3,230 | 36,502 | 24,087 | 12,415 | 11.3 | 7.5 | 3.8 | 1.388 | |||
| 2000 | 3,221 | 34,276 | 24,025 | 10,251 | 10.6 | 7.5 | 3.2 | 1.305 | |||
| 2001 | 3,214 | 32,065 | 24,003 | 8,062 | 10.0 | 7.5 | 2.5 | 1.239 | |||
| 2002 | 3,205 | 32,229 | 25,554 | 6,675 | 10.1 | 8.0 | 2.1 | 1.207 | |||
| 2003 | 3,188 | 35,793 | 26,014 | 9,779 | 11.2 | 8.2 | 3.1 | 1.349 | |||
| 2004 | 3,172 | 37,520 | 25,679 | 11,841 | 11.8 | 8.1 | 3.7 | 1.383 | |||
| 2005 | 3,155 | 37,499 | 26,379 | 11,120 | 11.9 | 8.4 | 3.5 | 1.366 | |||
| 2006 | 3,139 | 37,639 | 27,202 | 10,437 | 12.0 | 8.7 | 3.3 | 1.348 | 13.9 | 70.0 | 76.4 |
| 2007 | 3,122 | 40,105 | 26,830 | 13,275 | 12.8 | 8.6 | 4.3 | 1.417 | 10.9 | 70.2 | 76.6 |
| 2008 | 3,106 | 41,185 | 27,412 | 13,773 | 13.3 | 8.8 | 4.4 | 1.444 | 10.8 | 70.4 | 76.9 |
| 2009 | 3,089 | 44,466 | 27,528 | 16,938 | 14.4 | 8.9 | 5.5 | 1.551 | 10.4 | 70.6 | 77.0 |
| 2010 | 3,073 | 44,825 | 27,921 | 16,904 | 14.6 | 9.1 | 5.5 | 1.556 | 11.3 | 70.6 | 77.2 |
| 2011 | 3,056 | 43,340 | 27,963 | 15,377 | 14.2 | 9.1 | 5.0 | 1.499 | 11.6 | 70.7 | 77.5 |
| 20123 | 3,037 | 42,480 | 27,599 | 14,881 | 14.0 | 9.1 | 4.9 | 1.58 | 10.7 | ||
| 2013 | 3,022 | 41,770 | 27,165 | 14,605 | 13.8 | 9.0 | 4.8 | 1.57 | 9.8 | ||
| 2014 | 3,014 | 43,183 | 27,196 | 15,987 | 14.3 | 9.0 | 5.3 | 1.70 | 8.7 | ||
| 2015 | 3,007 | 41,763 | 27,878 | 13,885 | 13.9 | 9.3 | 4.6 | 1.62 | 8.8 | ||
| 2016 | 2,998 | 40,592 | 28,226 | 12,366 | 13.5 | 9.4 | 4.2 | 1.62 | |||
| 2017 | 2,986 | 37,699 | 27,367 | 10,332 | 12.7 | 9.2 | 3.5 |
1 The numbers of life births and deaths until 1959 were calculated from the birth rate and death rate, respectively 2 The high number of deaths in 1988 is related to the Spitak earthquake While in the 19th century the death rate was equal to the rate of other Europeans (excluding England) and lower than the death rate among the Indo—Portuguese, Hindus and Muslims.[18] 3 The population estimate for 2012 has been recalculated on the basis of the 2011 Census.
Ethnic groups
| Ethnic group |
census 19261 | census 19392 | census 19593 | census 19704 | census 19795 | census 19896 | census 20017 | census 20118 | ||||||||
|---|---|---|---|---|---|---|---|---|---|---|---|---|---|---|---|---|
| Number | % | Number | % | Number | % | Number | % | Number | % | Number | % | Number | % | Number | % | |
| Armenians | 743,571 | 84.5 | 1,061,997 | 82.8 | 1,551,610 | 88.0 | 2,208,327 | 88.6 | 2,724,975 | 89.7 | 3,083,616 | 93.3 | 3,145,354 | 97.9 | 2,961,514 | 98.1 |
| Yazidis | 12,237 | 1.4 | 20,481 | 1.6 | 25,627 | 1.5 | 37,486 | 1.5 | 50,822 | 1.7 | 56,127 | 1.7 | 40,620 | 1.3 | 35,308 | 1.2 |
| Kurds | 2,973 | 0.3 | 1,519 | 0.0 | 2,162 | 0.1 | ||||||||||
| Russians | 19,548 | 2.2 | 51,464 | 4.0 | 56,464 | 3.2 | 66,108 | 2.7 | 70,336 | 2.3 | 51,555 | 1.6 | 14,660 | 0.5 | 11,911 | 0.4 |
| Assyrian people | 2,215 | 0.3 | 3,280 | 0.3 | 4,326 | 0.2 | 5,544 | 0.2 | 6,183 | 0.2 | 5,963 | 0.2 | 3,409 | 0.1 | 2,769 | 0.1 |
| Ukrainians | 2,286 | 0.3 | 5,496 | 0.4 | 5,593 | 0.3 | 8,390 | 0.3 | 8,900 | 0.3 | 8,341 | 0.3 | 1,633 | 0.1 | 1,176 | 0.0 |
| Greeks | 2,980 | 0.3 | 4,181 | 0.3 | 4,976 | 0.3 | 5,690 | 0.2 | 5,653 | 0.2 | 4,650 | 0.1 | 1,176 | 0.0 | 900 | 0.0 |
| Georgians | 274 | 0.0 | 652 | 0.1 | 816 | 0.0 | 1,439 | 0.1 | 1,314 | 0.0 | 1,364 | 0.0 | 694 | 0․0 | 617 | 0.0 |
| Azerbaijanis | 76,870 | 8.7 | 130,896 | 10.2 | 107,748 | 6.1 | 148,189 | 5.9 | 160,841 | 5.3 | 84,860 | 2.6 | 29 | 0․0 | ||
| Jews | 335 | 0.0 | 512 | 0.0 | 1,024 | 0.1 | 1,047 | 0.0 | 959 | 0.0 | 720 | 0.0 | 109 | 0․0 | 127[19] | 0․0 |
| Others | 18,001 | 2.0 | 3,379 | 0.3 | 4,864 | 0.3 | 9,653 | 0.4 | 7,276 | 0.2 | 7,580 | 0.2 | 3,808 | 0.1 | 1,983 | 0.1 |
| Total | 880,464 | 1,282,338 | 1,763,048 | 2,491,873 | 3,037,259 | 3,304,776 | 3,213,011 | 3,018,467 | ||||||||
| 1 Source: . 2 Source: . 3 Source: . 4 Source: . 5 Source: . 6 Source: . 7 Source: . 8 Source: . | ||||||||||||||||
Demographic statistics from CIA World Factbook
The following demographic statistics are from the CIA World Factbook, unless otherwise indicated.[20]
Population
- 3,014,000 (October 2014 est.) information from the National Statistic Service of Armenia [21]
- country comparison to the world: 137
Urbanization
- Urban population: 64.1% of total population (2011)
- Rate of urbanization: 0.34% annual rate of change (2010-15 est.)
Sex ratio
- At birth: 1.14 male(s)/female
- 0-14 years: 1.15 male(s)/female
- 15-24 years: 1.03 male(s)/female
- 25-54 years: 0.92 male(s)/female
- 55-64 years: 0.93 male(s)/female
- 65 years and over: 0.59 male(s)/female
- Total population: 0.89 male(s)/female (2014 est.)
Infant mortality rate
- Total: 3.76 deaths/1,000 live births
- country comparison to the world: 212
- Male: 3.78 deaths/1,000 live births
- Female: 3.74 deaths/1,000 live births (2009 est.)
Life expectancy at birth
- Total: 13.97 deaths/1,000 live births
- Country comparison to the world: 113
- Male: 15.39 deaths/1,000 live births
- Female: 12.36 deaths/1,000 live births (2014 est.)
Total fertility rate
- 1.74 children born/woman (2014 est.)[22]
- country comparison to the world: 177
HIV/AIDS
- Adult prevalence rate: 0,2% (2012 est.)
- People living with HIV/AIDS: 3,500 (2012 est.)
- HIV/AIDS - deaths: 200 (2012 est.)
Nationality
- Noun: Armenian(s)
- Adjective: Armenian
Ethnic groups
Armenian 98%, Yezidi (Kurd) 1.2%, other 0.8% (2011 est.)
See also
References
- ↑ The Impact of Soviet Policies in Armenia, Mary Allerton Kilbourne Matossian, page 12, Brill Archive 1955
- ↑ A Modern History of Transcaucasian Armenia: Social, Cultural, and Political, Manuel Sarkisyanz, Brill (Distribution), 1975, page 61
- ↑ "World Development Indicators - Google Public Data Explorer". www.google.com. Retrieved 2018-02-17.
- ↑ News.am: Armenia’s population makes 3,285,767 – preliminary census results – date of publication: February 07, 2012
- ↑ Газета "Третья Сила"—Thirdpower.am: Данные переписи населения Армении Archived 2012-12-06 at Archive.is–дата публикации: 10.02.12
- ↑ "World Development Indicators - Google Public Data Explorer". www.google.com. Retrieved 2018-02-17.
- ↑ Garnik Asatryan and Victoria Arakelova, The Ethnic Minorities of Armenia Archived August 8, 2007, at the Wayback Machine., Routledge, part of the OSCE, 2002
- ↑ http://hdr.undp.org/sites/default/files/2016_human_development_report.pdf
- ↑ "ՀՀ մշտական բնակչության սեռատարիքային կազմն ըստ քաղաքային եւ գյուղական բաշխվածության" (PDF). 2011.
- ↑ "The DHS Program - Quality information to plan, monitor and improve population, health, and nutrition programs". www.dhsprogram.com.
- ↑ "Map". Retrieved 2018-02-07.
- ↑ "United Nations Statistics Division - Demographic and Social Statistics". unstats.un.org.
- ↑ B.R. Mitchell. International historical statistics 1750-2005: Africa. Asia and Oceania
- ↑ http://unstats.un.org/unsd/demographic/products/dyb/dyb2.htm#2001 United nations. Demographic Yearbooks
- ↑ "Armenian Statistical Service of Republic of Armenia". www.armstat.am.
- ↑ "Демоскоп Weekly - Приложение. Справочник статистических показателей". www.demoscope.ru.
- ↑ "The Demographic Handbook of Armenia, 2014 / Armenian Statistical Service of Republic of Armenia". www.armstat.am.
- ↑ Baten, Jörg (2016). A History of the Global Economy. From 1500 to the Present. Cambridge University Press. p. 265. ISBN 9781107507180.
- ↑ "ԱԶԳԱՅԻՆ ՓՈՔՐԱՄԱՍՆՈՒԹՅՈՒՆՆԵՐԸ ՀԱՅԱՍՏԱՆՈՒ". Retrieved 31 July 2018.
- ↑ "The World Factbook — Central Intelligence Agency". www.cia.gov.
- ↑ "ՀԱՅԱՍՏԱՆԻ ՀԱՆՐԱՊԵՏՈՒԹՅԱՆ ՄՇՏԱԿԱՆ ԲՆԱԿՉՈՒԹՅԱՆ ԹՎԱՔԱՆԱԿԸ 2014 թվականի ՀՈԿՏԵՄԲԵՐԻ 1- Ի ԴՐՈՒԹՅԱՄԲ" (PDF). 2014.
- ↑ "Fertility Rates". Quandle Financial and Economic Data. Archived from the original on 2016-02-01.
External links
- Population cartogram of Armenia
- Khachatryan, Anush; Karapetyan, Arsen: "Public Green Space in Armenian Cities: A Legal Analysis" in the Ccaucasus Analytical Ddigest No. 23
| History (timeline) |
|  | ||||||||
|---|---|---|---|---|---|---|---|---|---|---|
| Geography | ||||||||||
| Politics | ||||||||||
| Economy | ||||||||||
| Culture |
| |||||||||