Demographics of Sweden
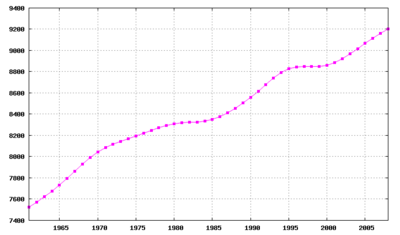
The demography of Sweden is monitored by Statistics Sweden (SCB). As of August 2018, the population of Sweden was estimated to be 10.2 million people,[1] making it the 90th most populous country in the world.[2] The three largest cities are Stockholm, Gothenburg and Malmö. Approximately 85% of the country's population resides in villages with 200 persons or cities.[3] Six out of ten swedes do not live in an urban system with 50 000+ inhabitants, as defined by OECD.
| Historical populations | ||
|---|---|---|
| Year | Pop. | ±% |
| 1570 | 900,000 | — |
| 1650 | 1,225,000 | +36.1% |
| 1700 | 1,485,000 | +21.2% |
| 1750 | 1,780,700 | +19.9% |
| 1800 | 2,347,300 | +31.8% |
| 1850 | 3,482,500 | +48.4% |
| 1900 | 5,136,400 | +47.5% |
| 1950 | 7,041,900 | +37.1% |
| 1970 | 8,081,300 | +14.8% |
| 1980 | 8,318,000 | +2.9% |
| 1990 | 8,590,600 | +3.3% |
| 1995 | 8,837,500 | +2.9% |
| 2000 | 8,882,800 | +0.5% |
| 2005 | 9,047,700 | +1.9% |
| 2010 | 9,415,600 | +4.1% |
| 2015 | 9,851,000 | +4.6% |
| 2018 | 10,196,177 | +3.5% |
| Source: Historical figures - Sveriges land och folk,[4] Modern figures - Statistics Sweden [1] As of:[5] 2018 data[1] | ||
Sweden census 2005
The 2005 Swedish census showed an increase of 475,322 compared to the 1990 census, an average increase of 31,680 annually. During the 1990s, birth rate increased by more than 100,000 children per year while death rates fell and immigration surged. In the early 2000s, birth rate declined as immigration increased further, with the context of unrest in the Middle East, upholding steady population growth.[6][7]
Ethnicity
The majority of the population are Swedes or Swedish people. The Sweden Finns are a large ethnic minority comprising approximately 50,000 along the Swedish-Finnish border, and 450,000 first and second generation immigrated ethnic Finns, mainly living in the Mälaren Valley region. Meänkieli Finnish has official status in parts of northern Sweden near the Finnish border. In addition, Sweden's indigenous population groups includes the Sami people, historically a nomadic reindeer herding group that has been native to Fenno-Scandinavia for at least 5000 years.[8] Today, the Sami language holds the status of official minority language in four municipalities in the Norrbotten county.
Immigrants from the Middle East have been a rapidly growing share of Sweden's population. According to the government agency Statistics Sweden, the number of immigrants born in all of Asia (including the Middle East) rose from just 1,000 in 1950 to 295,000 in 2003.[9] Most of those immigrants came from Iraq, Iran, Lebanon and Syria, according to Statistics Sweden.[9] A significant number of Syrian Christians have also settled in Sweden. Since the European migrant crisis, Syrians became the largest group of foreign-born persons in the Swedish civil registry in 2017 with 158,443 people.
Additionally, the birth rate among immigrant women after arriving in Sweden is higher than among ethnic Swedes.[10] Taking into account the fact that immigrant women have on average fewer children than Swedish women of comparable age, the difference in total birth rate is only 0.1 children more if the woman is foreign born – with the disclaimer that some women may have children not immigrating to and not reported in Sweden who are not included in the statistics.[11]
Total Fertility Rate from 1630 to 1900
The total fertility rate is the number of children born per woman. It is based on fairly good data for the entire period. Sources: Our World In Data and Gapminder Foundation.[12]
| Years | 1630 | 1632 | 1634 | 1636 | 1638 | 1640 | 1642 | 1644 | 1646 | 1648 | 1650 | 1652 | 1654 | 1656 | 1658[12] |
|---|---|---|---|---|---|---|---|---|---|---|---|---|---|---|---|
| Total Fertility Rate in Sweden | 4.81 | 4.25 | 3.89 | 4.38 | 4.4 | 4.92 | 4.38 | 4.25 | 4.95 | 5.4 | 4.34 | 4.54 | 5.33 | 4.72 | 4.58 |
| Years | 1660 | 1662 | 1664 | 1666 | 1668 | 1670 | 1672 | 1674 | 1676 | 1678 | 1680 | 1682 | 1684 | 1686 | 1688[12] |
|---|---|---|---|---|---|---|---|---|---|---|---|---|---|---|---|
| Total Fertility Rate in Sweden | 4.2 | 4.54 | 5.01 | 4.98 | 4.6 | 5.13 | 5.01 | 4.38 | 4.28 | 4.35 | 4.64 | 5.4 | 5.25 | 4.84 | 5.29 |
| Years | 1690 | 1692 | 1694 | 1696 | 1698 | 1700 | 1702 | 1704 | 1706 | 1708 | 1710 | 1712 | 1714 | 1716 | 1718[12] |
|---|---|---|---|---|---|---|---|---|---|---|---|---|---|---|---|
| Total Fertility Rate in Sweden | 4.99 | 5.11 | 4.98 | 5.33 | 5.11 | 5.56 | 5.81 | 5.52 | 5.16 | 5.32 | 4.3 | 5.63 | 5.81 | 4.92 | 5.13 |
| Years | 1720 | 1722 | 1724 | 1726 | 1728 | 1730 | 1732 | 1734 | 1736 | 1738 | 1740 | 1742 | 1744 | 1746 | 1748[12] |
|---|---|---|---|---|---|---|---|---|---|---|---|---|---|---|---|
| Total Fertility Rate in Sweden | 4.62 | 5.09 | 5.02 | 4.75 | 4.23 | 4.77 | 4.86 | 4.77 | 4.51 | 4.96 | 4.52 | 4.35 | 5.02 | 4.85 | 4.86 |
| Years | 1750 | 1752 | 1754 | 1756 | 1758 | 1760 | 1762 | 1764 | 1766 | 1768 | 1770 | 1772 | 1774 | 1776 | 1778[12] |
|---|---|---|---|---|---|---|---|---|---|---|---|---|---|---|---|
| Total Fertility Rate in Sweden | 5.09 | 5.29 | 5.4 | 5.23 | 4.68 | 5.06 | 4.98 | 4.92 | 4.79 | 4.77 | 4.68 | 4.1 | 4.89 | 4.67 | 4.94 |
| Years | 1780 | 1782 | 1784 | 1786 | 1788 | 1790 | 1792 | 1794 | 1796 | 1798 | 1800[12] |
|---|---|---|---|---|---|---|---|---|---|---|---|
| Total Fertility Rate in Sweden | 5.06 | 4.54 | 4.47 | 4.67 | 4.81 | 4.33 | 5.19 | 4.79 | 4.92 | 4.79 | 4.07 |
| Years | 1801 | 1802 | 1803 | 1804 | 1805 | 1806 | 1807 | 1808 | 1809 | 1810[12] |
|---|---|---|---|---|---|---|---|---|---|---|
| Total Fertility Rate in Sweden | 4.26 | 4.5 | 4.45 | 4.52 | 4.5 | 4.36 | 4.42 | 4.31 | 3.78 | 4.67 |
| Years | 1811 | 1812 | 1813 | 1814 | 1815 | 1816 | 1817 | 1818 | 1819 | 1820[12] |
|---|---|---|---|---|---|---|---|---|---|---|
| Total Fertility Rate in Sweden | 5.01 | 4.76 | 4.22 | 4.42 | 4.93 | 5.01 | 4.74 | 4.8 | 4.68 | 4.68 |
| Years | 1821 | 1822 | 1823 | 1824 | 1825 | 1826 | 1827 | 1828 | 1829 | 1830[12] |
|---|---|---|---|---|---|---|---|---|---|---|
| Total Fertility Rate in Sweden | 5.03 | 5.09 | 5.22 | 4.9 | 5.18 | 4.94 | 4.44 | 4.77 | 4.94 | 4.67 |
| Years | 1831 | 1832 | 1833 | 1834 | 1835 | 1836 | 1837 | 1838 | 1839 | 1840[12] |
|---|---|---|---|---|---|---|---|---|---|---|
| Total Fertility Rate in Sweden | 4.32 | 4.38 | 4.84 | 4.78 | 4.63 | 4.52 | 4.37 | 4.17 | 4.18 | 4.46 |
| Years | 1841 | 1842 | 1843 | 1844 | 1845 | 1846 | 1847 | 1848 | 1849 | 1850[12] |
|---|---|---|---|---|---|---|---|---|---|---|
| Total Fertility Rate in Sweden | 4.3 | 4.49 | 4.36 | 4.56 | 4.46 | 4.25 | 4.2 | 4.3 | 4.66 | 4.45 |
| Years | 1851 | 1852 | 1853 | 1854 | 1855 | 1856 | 1857 | 1858 | 1859 | 1860[12] |
|---|---|---|---|---|---|---|---|---|---|---|
| Total Fertility Rate in Sweden | 4.36 | 4.2 | 4.26 | 4.53 | 4.3 | 4.23 | 4.36 | 4.66 | 4.71 | 4.71 |
| Years | 1861 | 1862 | 1863 | 1864 | 1865 | 1866 | 1867 | 1868 | 1869 | 1870[12] |
|---|---|---|---|---|---|---|---|---|---|---|
| Total Fertility Rate in Sweden | 4.44 | 4.59 | 4.65 | 4.69 | 4.58 | 4.68 | 4.4 | 3.93 | 4.03 | 4.11 |
| Years | 1871 | 1872 | 1873 | 1874 | 1875 | 1876 | 1877 | 1878 | 1879 | 1880[12] |
|---|---|---|---|---|---|---|---|---|---|---|
| Total Fertility Rate in Sweden | 4.37 | 4.34 | 4.49 | 4.54 | 4.6 | 4.57 | 4.62 | 4.44 | 4.56 | 4.36 |
| Years | 1881 | 1882 | 1883 | 1884 | 1885 | 1886 | 1887 | 1888 | 1889 | 1890[12] |
|---|---|---|---|---|---|---|---|---|---|---|
| Total Fertility Rate in Sweden | 4.29 | 4.32 | 4.24 | 4.4 | 4.34 | 4.39 | 4.36 | 4.24 | 4.1 | 4.15 |
| Years | 1891 | 1892 | 1893 | 1894 | 1895 | 1896 | 1897 | 1898 | 1899 | 1900[12] |
|---|---|---|---|---|---|---|---|---|---|---|
| Total Fertility Rate in Sweden | 4.14 | 3.93 | 3.97 | 3.94 | 4.01 | 3.98 | 3.92 | 3.99 | 3.9 | 4 |
Vital statistics since 1900
Data according to Statistics Sweden, which collects the official statistics for Sweden.[13]
| Average population |
Live births | Deaths | Natural change | Crude birth rate (per 1000) | Crude death rate (per 1000) | Natural change (per 1000) | Total fertility rates[fn 1] | |
|---|---|---|---|---|---|---|---|---|
| 1900 | 5 117 000 | 138 139 | 86 146 | 51 993 | 27.0 | 16.8 | 10.2 | 4.02 |
| 1901 | 5 156 000 | 139 370 | 82 772 | 56 598 | 27.0 | 16.1 | 11.0 | 4.04 |
| 1902 | 5 187 000 | 137 364 | 79 722 | 57 642 | 26.5 | 15.4 | 11.1 | 3.95 |
| 1903 | 5 210 000 | 133 896 | 78 610 | 55 286 | 25.7 | 15.1 | 10.6 | 3.82 |
| 1904 | 5 241 000 | 134 952 | 80 152 | 54 800 | 25.7 | 15.3 | 10.5 | 3.83 |
| 1905 | 5 278 000 | 135 409 | 82 443 | 52 966 | 25.7 | 15.6 | 10.0 | 3.83 |
| 1906 | 5 316 000 | 136 620 | 76 366 | 60 254 | 25.7 | 14.4 | 11.3 | 3.81 |
| 1907 | 5 357 000 | 136 793 | 78 149 | 58 644 | 25.5 | 14.6 | 10.9 | 3.77 |
| 1908 | 5 404 000 | 138 874 | 80 568 | 58 306 | 25.7 | 14.9 | 10.8 | 3.79 |
| 1909 | 5 453 000 | 139 505 | 74 538 | 64 967 | 25.6 | 13.7 | 11.9 | 3.71 |
| 1910 | 5 499 000 | 135 625 | 77 212 | 58 413 | 24.7 | 14.0 | 10.6 | 3.60 |
| 1911 | 5 542 000 | 132 977 | 76 462 | 56 515 | 24.0 | 13.8 | 10.2 | 3.49 |
| 1912 | 5 583 000 | 132 868 | 79 241 | 53 627 | 23.8 | 14.2 | 9.6 | 3.44 |
| 1913 | 5 621 000 | 130 200 | 76 724 | 53 476 | 23.2 | 13.6 | 9.5 | 3.32 |
| 1914 | 5 659 000 | 129 458 | 78 311 | 51 147 | 22.9 | 13.8 | 9.0 | 3.29 |
| 1915 | 5 696 000 | 122 997 | 83 587 | 39 410 | 21.6 | 14.7 | 6.9 | 3.06 |
| 1916 | 5 735 000 | 121 679 | 77 771 | 43 908 | 21.2 | 13.6 | 7.7 | 2.99 |
| 1917 | 5 779 000 | 120 855 | 77 385 | 43 470 | 20.9 | 13.4 | 7.5 | 2.93 |
| 1918 | 5 807 000 | 117 955 | 104 594 | 13 361 | 20.3 | 18.0 | 2.3 | 2.83 |
| 1919 | 5 830 000 | 115 193 | 84 289 | 30 904 | 19.8 | 14.5 | 5.3 | 2.72 |
| 1920 | 5 876 000 | 138 753 | 78 128 | 60 625 | 23.6 | 13.3 | 10.3 | 3.22 |
| 1921 | 5 929 000 | 127 723 | 73 536 | 54 187 | 21.5 | 12.4 | 9.1 | 2.93 |
| 1922 | 5 971 000 | 116 946 | 76 343 | 40 603 | 19.6 | 12.8 | 6.8 | 2.66 |
| 1923 | 5 997 000 | 113 435 | 68 424 | 45 011 | 18.9 | 11.4 | 7.5 | 2.55 |
| 1924 | 6 021 000 | 109 055 | 72 001 | 37 054 | 18.1 | 12.0 | 6.2 | 2.43 |
| 1925 | 6 045 000 | 106 292 | 70 918 | 35 374 | 17.6 | 11.7 | 5.9 | 2.34 |
| 1926 | 6 064 000 | 102 007 | 71 344 | 30 663 | 16.8 | 11.8 | 5.1 | 2.22 |
| 1927 | 6 081 000 | 97 994 | 77 219 | 20 775 | 16.1 | 12.7 | 3.4 | 2.11 |
| 1928 | 6 097 000 | 97 868 | 73 267 | 24 601 | 16.1 | 12.0 | 4.0 | 2.08 |
| 1929 | 6 113 000 | 92 861 | 74 538 | 18 323 | 15.2 | 12.2 | 3.0 | 1.95 |
| 1930 | 6 131 000 | 94 220 | 71 790 | 22 430 | 15.4 | 11.7 | 3.7 | 1.96 |
| 1931 | 6 152 000 | 91 074 | 77 121 | 13 953 | 14.8 | 12.5 | 2.3 | 1.88 |
| 1932 | 6 176 000 | 89 779 | 71 459 | 18 320 | 14.5 | 11.6 | 3.0 | 1.83 |
| 1933 | 6 201 000 | 85 020 | 69 607 | 15 413 | 13.7 | 11.2 | 2.5 | 1.72 |
| 1934 | 6 222 000 | 85 092 | 69 921 | 15 171 | 13.7 | 11.2 | 2.4 | 1.67 |
| 1935 | 6 242 000 | 85 906 | 72 813 | 13 093 | 13.8 | 11.7 | 2.1 | 1.70 |
| 1936 | 6 259 000 | 88 938 | 74 836 | 14 102 | 14.2 | 12.0 | 2.3 | 1.75 |
| 1937 | 6 276 000 | 90 373 | 75 392 | 14 981 | 14.4 | 12.0 | 2.4 | 1.77 |
| 1938 | 6 297 000 | 93 946 | 72 693 | 21 253 | 14.9 | 11.5 | 3.4 | 1.84 |
| 1939 | 6 326 000 | 97 380 | 72 876 | 24 504 | 15.4 | 11.5 | 3.9 | 1.90 |
| 1940 | 6 356 000 | 95 778 | 72 748 | 23 030 | 15.1 | 11.4 | 3.6 | 1.86 |
| 1941 | 6 389 000 | 99 727 | 71 910 | 27 817 | 15.6 | 11.3 | 4.4 | 1.92 |
| 1942 | 6 432 000 | 113 961 | 63 741 | 50 220 | 17.7 | 9.9 | 7.8 | 2.19 |
| 1943 | 6 491 000 | 125 392 | 66 105 | 59 287 | 19.3 | 10.2 | 9.1 | 2.41 |
| 1944 | 6 560 000 | 134 991 | 72 284 | 62 707 | 20.6 | 11.0 | 9.6 | 2.61 |
| 1945 | 6 636 000 | 135 373 | 71 901 | 63 472 | 20.4 | 10.8 | 9.6 | 2.63 |
| 1946 | 6 719 000 | 132 597 | 70 635 | 61 962 | 19.7 | 10.5 | 9.2 | 2.57 |
| 1947 | 6 803 000 | 128 779 | 73 579 | 55 200 | 18.9 | 10.8 | 8.1 | 2.50 |
| 1948 | 6 883 000 | 126 683 | 67 693 | 58 990 | 18.4 | 9.8 | 8.6 | 2.47 |
| 1949 | 6 956 000 | 121 272 | 69 537 | 51 735 | 17.4 | 10.0 | 7.4 | 2.39 |
| 1950 | 7 014 000 | 115 414 | 70 296 | 45 118 | 16.5 | 10.0 | 6.4 | 2.28 |
| 1951 | 7 073 000 | 110 168 | 69 799 | 40 369 | 15.6 | 9.9 | 5.7 | 2.20 |
| 1952 | 7 125 000 | 110 192 | 68 270 | 41 922 | 15.5 | 9.6 | 5.9 | 2.22 |
| 1953 | 7 171 000 | 110 144 | 69 553 | 40 591 | 15.4 | 9.7 | 5.7 | 2.25 |
| 1954 | 7 213 000 | 105 096 | 69 030 | 36 066 | 14.6 | 9.6 | 5.0 | 2.18 |
| 1955 | 7 262 000 | 107 305 | 68 634 | 38 671 | 14.8 | 9.5 | 5.3 | 2.25 |
| 1956 | 7 315 000 | 107 960 | 70 205 | 37 755 | 14.8 | 9.6 | 5.2 | 2.29 |
| 1957 | 7 364 000 | 107 168 | 73 132 | 34 036 | 14.6 | 9.9 | 4.6 | 2.29 |
| 1958 | 7 409 000 | 105 502 | 71 065 | 34 437 | 14.2 | 9.6 | 4.6 | 2.26 |
| 1959 | 7 446 000 | 104 743 | 70 889 | 33 854 | 14.1 | 9.5 | 4.5 | 2.29 |
| 1960 | 7 480 000 | 102 219 | 75 093 | 27 126 | 13.7 | 10.0 | 3.6 | 2.17 |
| 1961 | 7 520 000 | 104 501 | 73 555 | 30 946 | 13.9 | 9.8 | 4.1 | 2.21 |
| 1962 | 7 562 000 | 107 284 | 76 791 | 30 493 | 14.2 | 10.2 | 4.0 | 2.25 |
| 1963 | 7 604 000 | 112 903 | 76 460 | 36 443 | 14.8 | 10.1 | 4.8 | 2.33 |
| 1964 | 7 661 000 | 122 664 | 76 661 | 46 003 | 16.0 | 10.0 | 6.0 | 2.47 |
| 1965 | 7 734 000 | 122 806 | 78 194 | 44 612 | 15.9 | 10.1 | 5.8 | 2.39 |
| 1966 | 7 808 000 | 123 354 | 78 440 | 44 914 | 15.8 | 10.0 | 5.8 | 2.37 |
| 1967 | 7 868 000 | 121 360 | 79 783 | 41 577 | 15.4 | 10.1 | 5.3 | 2.28 |
| 1968 | 7 914 000 | 113 087 | 82 476 | 30 611 | 14.3 | 10.4 | 3.9 | 2.07 |
| 1969 | 7 968 000 | 107 622 | 83 352 | 24 270 | 13.5 | 10.5 | 3.0 | 1.94 |
| 1970 | 8 043 000 | 110 150 | 80 026 | 30 124 | 13.7 | 9.9 | 3.7 | 1.94 |
| 1971 | 8 098 000 | 114 484 | 82 717 | 31 767 | 14.1 | 10.2 | 3.9 | 1.98 |
| 1972 | 8 122 000 | 112 273 | 84 051 | 28 222 | 13.8 | 10.3 | 3.5 | 1.93 |
| 1973 | 8 137 000 | 109 663 | 85 640 | 24 023 | 13.5 | 10.5 | 3.0 | 1.88 |
| 1974 | 8 161 000 | 109 874 | 86 316 | 23 558 | 13.5 | 10.6 | 2.9 | 1.91 |
| 1975 | 8 193 000 | 103 632 | 88 208 | 15 424 | 12.6 | 10.8 | 1.9 | 1.78 |
| 1976 | 8 222 000 | 98 345 | 90 677 | 7 668 | 12.0 | 11.0 | 0.9 | 1.70 |
| 1977 | 8 252 000 | 96 057 | 88 202 | 7 855 | 11.6 | 10.7 | 1.0 | 1.64 |
| 1978 | 8 276 000 | 93 248 | 89 681 | 3 567 | 11.3 | 10.8 | 0.4 | 1.61 |
| 1979 | 8 294 000 | 96 255 | 91 074 | 5 181 | 11.6 | 11.0 | 0.6 | 1.66 |
| 1980 | 8 310 000 | 97 064 | 91 800 | 5 264 | 11.7 | 11.0 | 0.6 | 1.69 |
| 1981 | 8 320 000 | 94 065 | 92 034 | 2 031 | 11.3 | 11.1 | 0.2 | 1.63 |
| 1982 | 8 325 000 | 92 748 | 90 671 | 2 077 | 11.1 | 10.9 | 0.2 | 1.60 |
| 1983 | 8 329 000 | 91 780 | 90 791 | 989 | 11.0 | 10.9 | 0.1 | 1.61 |
| 1984 | 8 337 000 | 93 889 | 90 483 | 3 406 | 11.3 | 10.9 | 0.4 | 1.66 |
| 1985 | 8 350 000 | 98 463 | 94 032 | 4 431 | 11.8 | 11.3 | 0.5 | 1.74 |
| 1986 | 8 370 000 | 101 950 | 93 295 | 8 655 | 12.2 | 11.1 | 1.0 | 1.79 |
| 1987 | 8 398 000 | 104 699 | 93 307 | 11 392 | 12.5 | 11.1 | 1.4 | 1.84 |
| 1988 | 8 437 000 | 112 080 | 96 743 | 15 337 | 13.3 | 11.5 | 1.8 | 1.96 |
| 1989 | 8 493 000 | 116 023 | 92 110 | 23 913 | 13.7 | 10.8 | 2.8 | 2.02 |
| 1990 | 8 559 000 | 123 938 | 95 161 | 28 777 | 14.5 | 11.1 | 3.4 | 2.14 |
| 1991 | 8 617 000 | 123 737 | 95 202 | 28 535 | 14.4 | 11.0 | 3.3 | 2.12 |
| 1992 | 8 668 000 | 122 848 | 94 710 | 28 138 | 14.2 | 10.9 | 3.2 | 2.09 |
| 1993 | 8 719 000 | 117 998 | 97 008 | 20 990 | 13.5 | 11.1 | 2.4 | 2.00 |
| 1994 | 8 781 000 | 112 257 | 91 844 | 20 413 | 12.8 | 10.5 | 2.3 | 1.90 |
| 1995 | 8 831 000 | 103 326 | 96 910 | 6 416 | 11.7 | 11.0 | 0.7 | 1.74 |
| 1996 | 8 843 000 | 95 297 | 94 133 | 1 164 | 10.8 | 10.6 | 0.1 | 1.61 |
| 1997 | 8 846 000 | 89 171 | 92 674 | -3 503 | 10.1 | 10.5 | -0.4 | 1.52 |
| 1998 | 8 851 000 | 88 384 | 92 891 | -4 507 | 10.0 | 10.5 | -0.5 | 1.51 |
| 1999 | 8 858 000 | 88 173 | 94 726 | -6 553 | 10.0 | 10.7 | -0.7 | 1.50 |
| 2000 | 8 872 000 | 90 441 | 93 285 | -2 844 | 10.2 | 10.5 | -0.3 | 1.54 |
| 2001 | 8 896 000 | 91 466 | 93 752 | -2 286 | 10.3 | 10.5 | -0.3 | 1.57 |
| 2002 | 8 925 000 | 95 815 | 95 009 | 806 | 10.7 | 10.6 | 0.1 | 1.65 |
| 2003 | 8 958 000 | 99 157 | 92 961 | 6 196 | 11.1 | 10.4 | 0.7 | 1.71 |
| 2004 | 8 994 000 | 100 928 | 90 532 | 10 396 | 11.2 | 10.1 | 1.2 | 1.75 |
| 2005 | 9 030 000 | 101 346 | 91 710 | 9 636 | 11.2 | 10.2 | 1.1 | 1.77 |
| 2006 | 9 081 000 | 105 913 | 91 177 | 14 736 | 11.7 | 10.0 | 1.6 | 1.85 |
| 2007 | 9 148 000 | 107 421 | 91 729 | 15 692 | 11.7 | 10.0 | 1.7 | 1.88 |
| 2008 | 9 220 000 | 109 301 | 91 449 | 17 852 | 11.9 | 9.9 | 1.9 | 1.91 |
| 2009 | 9 299 000 | 111 801 | 90 080 | 21 721 | 12.0 | 9.7 | 2.3 | 1.94 |
| 2010 | 9 378 000 | 115 641 | 90 487 | 25 154 | 12.3 | 9.6 | 2.7 | 1.98 |
| 2011 | 9 449 000 | 111 770 | 89 938 | 21 832 | 11.8 | 9.5 | 2.3 | 1.90 |
| 2012 | 9 519 000 | 113 177 | 91 938 | 21 239 | 11.9 | 9.7 | 2.2 | 1.91 |
| 2013 | 9 644 000 | 113 593 | 90 402 | 23 191 | 11.8 | 9.4 | 2.4 | 1.89 |
| 2014 | 9 747 000 | 114 907 | 88 976 | 25 931 | 11.9 | 9.2 | 2.7 | 1.88 |
| 2015 | 9 851 000 | 114 870 | 90 907 | 23 963 | 11.7 | 9.3 | 2.4 | 1.85 |
| 2016 | 9 995 000 | 117 425 | 90 982 | 26 443 | 11.8 | 9.2 | 2.6 | 1.85 |
| 2017 | 10 120 000 | 115 416 | 91 972 | 23 444 | 11.4 | 9.1 | 2.3 | 1.79 |
Current vital statistics
Number of births :
- from January-August 2017 =

- from January-August 2018 =

Number of deaths :
- from January-August 2017 =

- from January-August 2018 =
Natural increase :
- from January-August 2017 =
- from January-August 2018 =
Life expectancy from 1751 to 2015
Sources: Our World In Data and the United Nations.
1751-1949
| Years | 1751 | 1754 | 1756 | 1768 | 1776 | 1781 | 1789 | 1795 | 1810 | 1818 | 1824 | 1837 | 1847 | 1855 | 1861[15] |
|---|---|---|---|---|---|---|---|---|---|---|---|---|---|---|---|
| Life expectancy in Sweden | 38.4 | 37.4 | 36.2 | 35.0 | 41.5 | 37.8 | 31.2 | 36.5 | 31.9 | 40.0 | 44.9 | 39.6 | 40.1 | 43.0 | 47.1 |
| Years | 1868 | 1872 | 1878 | 1884 | 1890 | 1896 | 1905 | 1911 | 1913 | 1916 | 1922 | 1929 | 1935 | 1943 | 1949[15] |
|---|---|---|---|---|---|---|---|---|---|---|---|---|---|---|---|
| Life expectancy in Sweden | 43.2 | 50.0 | 47.6 | 49.1 | 50.4 | 53.4 | 54.5 | 58.0 | 58.7 | 58.2 | 61.0 | 62.3 | 64.9 | 68.7 | 70.8 |
1950-2015
| Period | Life expectancy in Years |
Period | Life expectancy in Years |
|---|---|---|---|
| 1950–1955 | 71.9 | 1985–1990 | 77.2 |
| 1955–1960 | 72.9 | 1990–1995 | 78.2 |
| 1960–1965 | 73.5 | 1995–2000 | 79.3 |
| 1965–1970 | 74.1 | 2000–2005 | 80.1 |
| 1970–1975 | 74.8 | 2005–2010 | 81.1 |
| 1975–1980 | 75.4 | 2010–2015 | 81.9 |
| 1980–1985 | 76.4 |
Source: UN World Population Prospects[16]
Population statistics

people/km²
At the housing and population census 1990 the Swedish population stood at 8 587 353 out of which 4,242,351 male and 4,345,002 female. According to a 2012 survey there were 1 473 256 foreign born within the country making up 15% of the population.[17][18]
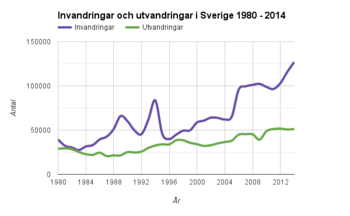
The demographic profile of Sweden has altered drastically due to immigration patterns since the 1970s. Since 2012, the number of immigrants to Sweden has increased while the number of emigrants have decreased. Today, about one-fifth of Sweden's population has an immigrant background.[19]
Though there are no official statistics on ethnicity, according to Statistics Sweden around 1,921,000 (20.1%) inhabitants of Sweden were of a foreign background in 2012. This background included: indigenous population of Swedes with Finnish and Sami minorities, and foreign-born or first-generation immigrants like Turks, Greeks, Finns, Yugoslavs, Danes and Norwegians. In 2018 around 20% of the population of Sweden was of None white European origins.[19]
Population little increases during 2004-2012 have mainly been attributed to immigration from Muslim-majority countries like Iraq, Afghanistan, and Somalia. This implies a larger influx of Muslim immigrants as opposed to any other religious group.[19]
Demographic statistics according to the World Population Review.[19]
- One birth every 4 minutes
- One death every 6 minutes
- One net migrant every 13 minutes
- Net gain of one person every 7 minutes
Demographic statistics according to the CIA World Factbook, unless otherwise indicated.[20]
- Population
- 9,960,487 (July 2017 est.)
- Religions
- Church of Sweden (Lutheran) 63%, other (includes Roman Catholic, Muslim, Orthodox, Buddhist, Baptist and Jewish) 17% (2016 est.)
- Age structure
- 0-14 years: 17.43% (male 892,462/female 843,375)
- 15-24 years: 11.31% (male 581,025/female 545,971)
- 25-54 years: 39.42% (male 1,993,590/female 1,933,080)
- 55-64 years: 11.58% (male 578,942/female 574,479)
- 65 years and over: 20.26% (male 931,593/female 1,085,970) (2017 est.)
- Total fertility rate
- 1.88 children born/woman (2017 est.) Country comparison to the world: 141st
- Median age
- total: 41.2 years Country comparison to the world: 41st
- male: 40.2 years
- female: 42.2 years (2017 est.)
- Population growth rate
- 0.81% (2017 est.) Country comparison to the world: 128th
- 0.93% (2013 est.)
- Mother's mean age at first birth
- 29.1 years (2015 est.)
- Birth rate
- 12.1 births/1,000 population (2017 est.) Country comparison to the world: 167th
- 11.78 births/1,000 population (2013 est.)
- Death rate
- 9.4 deaths/1,000 population (2017 est.)
- 9.37 deaths/1,000 population (2013 est.)
- Net migration rate
- 5.3 migrant(s)/1,000 population (2017 est.) Country comparison to the world: 23rd
- 6.75 migrant(s)/1,000 population (2013 est.)
- Life expectancy at birth
- total population: 82.1 years Country comparison to the world: 16th
- male: 80.2 years
- female: 84.2 years (2017 est.)
- Net birth surplus rate
- 2.40 deaths/1,000 population (2013 est.)
- Infant mortality rate
- total: 2.6 deaths/1,000 live births Country comparison to the world: 218th
- male: 2.9 deaths/1,000 live births
- female: 2.3 deaths/1,000 live births (2017 est.)
- 2.75 deaths/1,000 live births (2010 est.)
- Dependency ratios
- total dependency ratio: 58.5
- youth dependency ratio: 27.4
- elderly dependency ratio: 31.1
- potential support ratio: 3.2 (2015 est.)
- Unemployment, youth ages 15-24
- total: 20.4%
- male: 21.2%
- female: 19.6% (2015 est.) Country comparison to the world: 65th
- School life expectancy (primary to tertiary education)
- total: 18 years
- male: 17 years
- female: 20 years (2014)
- Urbanisation
- 85% of total population (2010 est.)
- Rate of urbanisation: 0.6% annual rate of change (2010-15 est.)
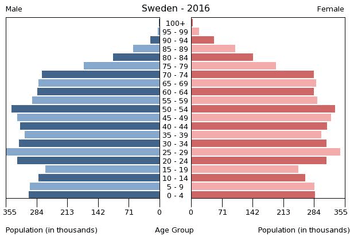
Population projections
In 1950 Sweden had fewer people aged 10-20 with more people ages 20-30 and 0-10. In 2017 the ratio if male to female remains steady at about 50-50. As a whole the graph broadens with people appearing to live longer. In 2050 its predicted that all ages will increase from below 300,000 males and females to above 300,000 males and females. With about 50,000 people living to the ages of 90-100. In 2100 the graph is shaped as a rectangle with people of all ages and genders remaining steady. It narrows slightly at the top of the graph with about 250,000/300,000 males and females living to be 90-100 years old.[21] Statistics Sweden projects the following population development in Sweden:[22]
| Year | Projection |
|---|---|
| 2016 | 9,995,000 |
| 2020 | 10,431,000 |
| 2026 | 11,046,000 |
| 2030 | 11,344,000 |
| 2040 | 11,898,000 |
| 2050 | 12,395,000 |
| 2060 | 12,858,000 |
Eurostat projects a population in Sweden reaching 11,994,364 people in 2040 and 14,388,478 in 2080.[23]
Migration
Immigration
.jpg)
As of 2017, Statistics Sweden reported that around 2,439,007 or 24.1% of the inhabitants of Sweden were from a foreign background: that is, each such person either had been born abroad or had been born in Sweden to two parents who themselves had both been born abroad.[24] Also taking into account people with only one parent born abroad, this number increases to almost a third in 2017.[25]
Demographics
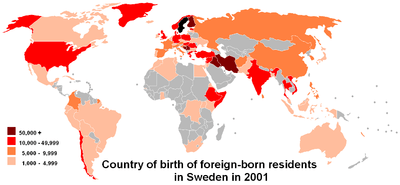
According to Eurostat, in 2010, there were 1.33 million foreign-born residents in Sweden, corresponding to 14.3% of the total population. Of these, 859,000 (64.3%) were born outside the EU and 477,000 (35.7%) were born in another EU Member State.[26][27]
The twenty largest groups of foreign-born persons in the Swedish civil registry in 2017 were:[28]


.svg.png)


The seven successor states of Yugoslavia and their historic counterparts (Slovenia, Croatia, Bosnia, Serbia, Macedonia, Montenegro, Kosovo and "Serbia and Montenegro") had a combined population of 172,308 persons residing in Sweden in 2017 which would make them the largest foreign-born group if counted as one group.
The ten most common countries of birth among immigrants getting registered in Sweden during 2016 (including asylum seekers who came in 2015) were the following:[29]
History
- World War II
Immigration increased markedly with World War II. Historically, the most numerous of foreign born nationalities are ethnic Germans from Germany and other Scandinavians from Denmark and Norway. In short order, 70,000 war children were evacuated from Finland, of which 15,000 remained in Sweden. Also, many of Denmark's nearly 7,000 Jews who were evacuated to Sweden decided to remain there.
A sizable community from the Baltic States (Estonia, Latvia and Lithuania) arrived during the Second World War.[30]
- 1945 to 1967
During the 1950s and 1960s, the recruitment of immigrant labour was an important factor of immigration. The Nordic countries signed a trade agreement in 1952, establishing a common labour market and free movement across borders. This migration within the Nordic countries, especially from Finland to Scandinavia, was essential to create the tax-base required for the expansion of the strong public sector now characteristic of Scandinavia. This continued until 1967, when the labour market became saturated, and Sweden introduced new immigration controls.
On a smaller scale, Sweden took in political refugees from Hungary and the former Czechoslovakia after their countries were invaded by the Soviet Union in 1956 and 1968 respectively.
Contemporary immigration
Since the early 1970s, immigration to Sweden has been mostly due to refugee migration and family reunification from countries in the Middle East and Latin America.[31]
The first group of Assyrians/Syriacs moved to Sweden from Lebanon in 1967. Many of them live in Södertälje (Stockholm).[32][33] There are also around 40,000 Roma in Sweden.[34]
Immigration of Iraqis increased dramatically during the Iraq War, during 2003 to 2007. A total of 8,951 Iraqis came to Sweden in 2006, accounting for 45% of the entire Iraqi migration to Europe. By 2007, the community of Iraqis in Sweden numbered above 70,000. In 2008, Sweden introduced tighter rules on asylum seekers.[35]
Language
The Swedish language is by far the dominating language in Sweden, and is used by the government administration.
Since 1999, Sweden has five officially recognised minority languages: Sami, Meänkieli, Standard Finnish, Romani chib and Yiddish.
The Sami language, spoken by about 7,000 people in Sweden, may be used in government agencies, courts, preschools and nursing homes in the municipalities of Arjeplog, Gällivare, Jokkmokk and Kiruna and its immediate neighbourhood.
Similarly, Finnish and Meänkieli can be used in the municipalities of Gällivare, Haparanda, Kiruna, Pajala and Övertorneå and its immediate neighbourhood. Finnish is also official language, along with Swedish, in the city of Eskilstuna.
During the mid to late 20th century, immigrant communities brought other languages, among others being Persian, Serbo-Croatian, Arabic and Neo-Aramaic.[36]
Religion
The majority (66%) of the population belongs to the Church of Sweden,[37] the Lutheran church that was disestablished in 2000. This is because until 1996, those who had family members in the church automatically became members at birth. Other Christian denominations in Sweden include the Roman Catholic Church (see Catholic Church of Sweden), several Orthodox churches in diaspora, Baptist, Pentecostal, Neo-pietistic (nyevangeliska) and other evangelical Christian churches (frikyrkor = 'free churches'). Shamanism persisted among the Sami people up until the 18th century, but no longer exists in its traditional form as most Sami today belong to the Lutheran church.
Jews were permitted to practice their religion in five Swedish cities in 1782, and have enjoyed full rights as citizens since 1870. The new Freedom of Religion Bill was passed in 1951, and former obstacles against Non-Lutherans working in schools and hospitals were removed. Further, that bill made it legal to leave any religious denomination, without entering another. There are also a number of Muslims, Buddhists, and Bahá'í in Sweden, mainly from immigration.
See also
Notes
- ↑ In fertility rates, 2.1 and above is a stable population and have been marked blue, 2 and below leads an aging population and the result is that the population reduces.
References
- 1 2 3 "Population statistics". Statistics Sweden. August 2018. Retrieved 11 October 2018.
- ↑ "U.S. & World Population Clocks". United States Census Bureau. Retrieved 6 March 2014.
- ↑ Svanström, Stefan. "Varannan svensk bor nära havet". Scb.se. Retrieved 6 March 2014.
- ↑ Gustav Sundbärg, Sveriges land och folk (1901), page 90.
- ↑ "Population and Population Changes 1749–2015". Statistics Sweden. Archived from the original on 16 February 2017.
- ↑ "The 2005 population and housing census in Sweden will be totally register-based". Census Knowledge Base. United Nations Statistics Division.
- ↑ Bruhn, Åke (6 July 2001). "The 2005 population and housing census in Sweden will be totally register-based". Symposium on Global Review of 2000 Round of Population and Housing Censuses: Mid-Decade Assessment and Future Prospects. Retrieved 12 March 2017: Does not provide figures, only methodology.
- ↑ Broadbent, Noel (16 March 2010). Lapps and Labyrinths: Saami Prehistory, Colonisation, and Cultural Resilience. Smithsonian Institution Scholarly Press. p. 304. ISBN 978-0-9788460-6-0.
- 1 2 "Immigration and emigration in the postwar period, Yugoslav immigration was substantial" (PDF). Statistics Sweden. 2004. p. 96. Retrieved 16 December 2017.
- ↑ "Visa detaljerad information". Scb.se. Retrieved 16 December 2017.
- ↑ "Får utrikes födda fler barn?". Statistiska Centralbyrån. Retrieved 29 October 2016.
- 1 2 3 4 5 6 7 8 9 10 11 12 13 14 15 16 17 Max Roser (2014), "Total Fertility Rate around the world over the last centuries", Our World In Data, Gapminder Foundation
- ↑ "Statistics Sweden". Scb.se. Retrieved 16 December 2017.
- ↑ "Preliminary Population Statistics 2018". Statistics Sweden. Retrieved 11 October 2018.
- 1 2 "Life expectancy". Our World in Data. Retrieved 11 October 2018.
- ↑ "World Population Prospects – Population Division – United Nations". Retrieved 2017-07-15.
- ↑ "Utrikes födda 2012: Fortsatt ökning av utrikes födda i Sverige" [Foreign born 2012: Further increase in foreign-born persons in Sweden]. Statistics Sweden, Unit for Population Statistics (in Swedish). 21 August 2013. Retrieved 12 March 2017.
- ↑ Befolkningsstatistik. "Största folkökningen på nästan 70 år". Retrieved 6 March 2014.
- 1 2 3 4 "Sweden Population 2018", World Population Review
- ↑ "Sweden". The World Factbook. Central Intelligence Agency.
- ↑ "World Population Prospects - Population Division - United Nations". Esa.un.org. Retrieved 16 December 2017.
- ↑ "Sveriges framtida befolkning 2017-2060" (PDF). Statistics Sweden. Retrieved 16 April 2017.
- ↑ "Population on 1st January by age and sex". Eurostat Commission. Retrieved 14 June 2017.
- ↑ "Number of persons by foreign/Swedish background, age, sex and year". Statistics Sweden. Retrieved 31 March 2017.
- ↑ "Statistikdatabasen - välj tabell". Statistikdatabasen.scb.se. Retrieved 16 December 2017.
- ↑ Vasileva, Katya (2011). "6.5% of the EU population are foreigners and 9.4% are born abroad" (PDF). Statistics in focus. Eurostat (34). Archived from the original (PDF) on 28 January 2012.
- ↑ "Statistikdatabasen - välj tabell". Ssd.scb.se. Retrieved 16 December 2017.
- ↑ "Utrikes födda samt födda i Sverige med en eller två utrikes födda föräldrar efter födelseland/ursprungsland, 31 december 2017, totalt". Statistics Sweden / Befolkning efter födelseland och ursprungsland 31 december 2017. Retrieved 10 September 2018.
- ↑ "Invandring till Sverige 2016 och 2015 efter de 20 vanligaste födelseländerna för de invandrade 2016". Statistics Sweden. Retrieved 26 February 2017.
- ↑ "Pocket Facts: Statistics on Integration" (PDF). Integrationsverket. The Swedish Integration Board. 2006. ISBN 91-89609-30-1. Archived from the original (PDF) on 5 June 2007.
- ↑ Sweden: Restrictive Immigration Policy and Multiculturalism, Migration Policy Institute, 2006.
- ↑ "Assyrier/Syrianer – Vilka är de?" [Assyrians/Syriacs - Who are they?] (in Swedish). Ronnaskolan.sodertalje.se. Archived from the original on 8 February 2009.
- ↑ "Vems är historien? Historia som medvetande, kultur och handling i det mångkulturella Sverige" [Who Does History Belong To? History as Consciousness, Culture and Action in Multicultural Sweden] (PDF) (in Swedish). educ.umu.se. 2006. ISBN 91-7264-128-2. ISSN 1653-6894. Archived from the original (PDF) on 6 November 2006.
- ↑
- ↑ "Sweden tightens rules on Iraqi asylum seekers". reuters.com. 6 July 2007. Retrieved 14 December 2010.
- ↑ "Sweden". Ethnologue. 19 February 1999. Retrieved 3 October 2013.
- ↑ "Svenska kyrkans medlemsutveckling år 1972-2010" [Swedish church's membership development from 1972-2010] (in Swedish). Church of Sweden. Archived from the original (PDF) on 19 October 2011.
External links
- Statistics Sweden – Official Data Base available in English

| Wikimedia Commons has media related to Demographics of Sweden. |