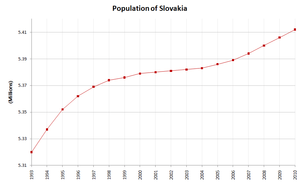
Demographics of Slovakia
| Historical population | ||
|---|---|---|
| Year | Pop. | ±% |
| 1848 | 2,442,000 | — |
| 1869 | 2,481,811 | +1.6% |
| 1880 | 2,477,521 | −0.2% |
| 1890 | 2,595,180 | +4.7% |
| 1900 | 2,782,925 | +7.2% |
| 1910 | 2,916,657 | +4.8% |
| 1921 | 2,993,859 | +2.6% |
| 1930 | 3,324,111 | +11.0% |
| 1946 | 3,327,803 | +0.1% |
| 1950 | 3,442,317 | +3.4% |
| 1961 | 4,174,046 | +21.3% |
| 1970 | 4,537,290 | +8.7% |
| 1980 | 4,991,168 | +10.0% |
| 1991 | 5,274,335 | +5.7% |
| 2001 | 5,379,455 | +2.0% |
| 2011 | 5,397,036 | +0.3% |
| 2017 | 5,443,120 | +0.9% |
| Source: | ||
This article is about the demographic features of the population of Slovakia, including population density, ethnicity, education level, health of the populace, economic status, religious affiliations and other aspects of the population. The demographic statistics are from the Statistical Office of the SR, unless otherwise indicated.
Population
Total population: 5,444,218[1] (as of 2016).
Population censuses in 1848-2011
| Census Date | Population | Population Density (per km2) |
|---|---|---|
| 31-12-1848 | 2,442,000 (est.) | 50 |
| 31-12-1869 | 2,481,811 | 51 |
| 31-12-1880 | 2,477,521 | 51 |
| 31-12-1890 | 2,595,180 | 53 |
| 31-12-1900 | 2,782,925 | 57 |
| 31-12-1910 | 2,916,657 | 60 |
| 15-2-1921 | 2,993,859 | 61 |
| 1-12-1930 | 3,324,111 | 68 |
| 4-10-1946 | 3,327,803 | 68 |
| 1-3-1950 | 3,442,317 | 70 |
| 1-3-1961 | 4,174,046 | 85 |
| 1-12-1970 | 4,537,290 | 93 |
| 1-11-1980 | 4,991,168 | 102 |
| 3-3-1991 | 5,274,335 | 108 |
| 26-5-2001 | 5,379,455 | 110 |
| 21-5-2011 | 5,397,036 | 110 |
Age structure
0–14 years:
15.6% (male 437,755; female 417,797)
15–64 years:
71.6% (male 1,955,031; female 1,965,554)
65 years and over:
12.8% (male 262,363; female 438,538 (2011 est)
Median age
total: 38 years, male: 36.5 years, female: 39.5 years (2012 est)
Sex ratio
at birth:
1.05 male(s)/female
under 15 years:
1.05 male(s)/female
15–64 years:
1 male(s)/female
65 years and over:
0.6 male(s)/female
total population:
0.94 male(s)/female (2011 est.)
Immigration

Immigration to Slovakia is one of the lowest in the European Union.
Vital statistics
|
1.5 - 1.7
1.4 - 1.5
1.3 - 1.4
< 1.3 |
Births and deaths since 1919
| Average population (000s) |
Live births | Deaths | Natural change |
Births (per 1000) |
Deaths (per 1000) |
Natural change (per 1000) |
Fertility rates |
Induced abortions | |
|---|---|---|---|---|---|---|---|---|---|
| 1919 | 2 940 | 91 729 | 56 866 | 34 863 | 31.2 | 19.3 | 11.9 | ||
| 1920 | 3 001 | 97 680 | 61 084 | 36 596 | 32.6 | 20.4 | 12.2 | ||
| 1921 | 3 006 | 114 947 | 63 507 | 51 440 | 38.2 | 21.1 | 17.1 | ||
| 1922 | 3 046 | 111 059 | 62 902 | 48 157 | 36.5 | 20.7 | 15.8 | ||
| 1923 | 3 095 | 111 070 | 54 176 | 56 894 | 35.9 | 17.5 | 18.4 | ||
| 1924 | 3 135 | 106 062 | 56 322 | 49 740 | 33.8 | 18.0 | 15.9 | ||
| 1925 | 3 168 | 102 867 | 56 171 | 46 696 | 32.5 | 17.7 | 14.7 | ||
| 1926 | 3 202 | 103 955 | 59 701 | 44 254 | 32.5 | 18.6 | 13.8 | ||
| 1927 | 3 232 | 99 891 | 59 172 | 40 719 | 30.9 | 18.3 | 12.6 | ||
| 1928 | 3 258 | 99 673 | 58 320 | 41 353 | 30.6 | 17.9 | 12.7 | ||
| 1929 | 3 286 | 95 387 | 56 447 | 38 940 | 29.0 | 17.2 | 11.9 | ||
| 1930 | 3 315 | 96 898 | 52 268 | 44 630 | 29.2 | 15.8 | 13.5 | ||
| 1931 | 3 350 | 93 309 | 54 273 | 39 036 | 27.9 | 16.2 | 11.7 | ||
| 1932 | 3 388 | 93 140 | 52 992 | 40 148 | 27.5 | 15.6 | 11.9 | ||
| 1933 | 3 424 | 84 975 | 50 655 | 34 320 | 24.8 | 14.8 | 10.0 | ||
| 1934 | 3 456 | 83 493 | 50 178 | 33 315 | 24.2 | 14.5 | 9.6 | ||
| 1935 | 3 486 | 82 382 | 49 830 | 32 552 | 23.6 | 14.3 | 9.3 | ||
| 1936 | 3 515 | 80 923 | 48 547 | 32 376 | 23.0 | 13.8 | 9.2 | ||
| 1937 | 3 540 | 79 862 | 49 527 | 30 335 | 22.6 | 14.0 | 8.6 | ||
| 1938 | 3 726 | 80 800 | 49 700 | 31 100 | 21.7 | 13.3 | 8.3 | ||
| 1939 | 3 577 | 81 200 | 48 800 | 32 400 | 22.7 | 13.6 | 9.1 | ||
| 1940 | 3 553 | 85 300 | 52 900 | 32 400 | 24.0 | 14.9 | 9.1 | ||
| 1941 | 3 542 | 85 700 | 53 600 | 32 100 | 24.2 | 15.1 | 9.1 | ||
| 1942 | 3 523 | 87 200 | 55 900 | 31 300 | 24.8 | 15.9 | 8.9 | ||
| 1943 | 3 503 | 87 700 | 50 900 | 36 800 | 25.0 | 14.5 | 10.5 | ||
| 1944 | 3 484 | 91 600 | 58 100 | 33 500 | 26.3 | 16.7 | 9.6 | ||
| 1945 | 3 459 | 81 880 | 67 505 | 14 375 | 23.7 | 19.5 | 4.2 | ||
| 1946 | 3 392 | 82 204 | 47 589 | 34 615 | 24.2 | 14.0 | 10.2 | ||
| 1947 | 3 399 | 87 659 | 41 491 | 46 168 | 25.8 | 12.2 | 13.6 | ||
| 1948 | 3 446 | 91 189 | 40 873 | 50 316 | 26.5 | 11.9 | 14.6 | ||
| 1949 | 3 447 | 91 053 | 41 727 | 49 326 | 26.4 | 12.1 | 14.3 | ||
| 1950 | 3 463 | 99 721 | 39 668 | 60 053 | 28.8 | 11.5 | 17.4 | 3.56 | |
| 1951 | 3 509 | 100 663 | 40 505 | 60 158 | 28.5 | 11.5 | 17.0 | 3.58 | |
| 1952 | 3 558 | 100 824 | 36 897 | 63 927 | 28.0 | 10.2 | 17.7 | 3.57 | |
| 1953 | 3 599 | 99 124 | 35 598 | 63 526 | 26.9 | 9.7 | 17.3 | 3.50 | |
| 1954 | 3 661 | 98 310 | 34 866 | 63 444 | 26.2 | 9.3 | 16.9 | 3.45 | |
| 1955 | 3 727 | 99 305 | 32 917 | 66 388 | 26.0 | 8.6 | 17.4 | 3.47 | |
| 1956 | 3 787 | 99 467 | 32 815 | 66 652 | 25.5 | 8.4 | 17.1 | 3.46 | |
| 1957 | 3 844 | 97 311 | 35 755 | 61 556 | 24.5 | 9.0 | 15.5 | 3.34 | |
| 1958 | 3 900 | 93 272 | 32 106 | 61 166 | 23.1 | 7.9 | 15.1 | 3.25 | 12 383 |
| 1959 | 3 946 | 87 991 | 34 077 | 53 914 | 21.5 | 8.3 | 13.1 | 3.07 | 17 217 |
| 1960 | 3 994 | 88 412 | 31 609 | 56 803 | 22.1 | 7.9 | 14.2 | 3.08 | 20 738 |
| 1961 | 4 182 | 87 359 | 31 403 | 55 956 | 21.6 | 7.8 | 13.8 | 3.04 | 24 244 |
| 1962 | 4 238 | 83 899 | 34 398 | 49 501 | 19.8 | 8.1 | 11.7 | 2.84 | 23 784 |
| 1963 | 4 282 | 87 158 | 32 978 | 54 180 | 20.4 | 7.7 | 12.7 | 2.95 | 19 076 |
| 1964 | 4 327 | 86 878 | 32 875 | 54 003 | 20.1 | 7.6 | 12.5 | 2.91 | 19 174 |
| 1965 | 4 371 | 84 257 | 35 910 | 48 347 | 19.3 | 8.2 | 11.1 | 2.80 | 21 037 |
| 1966 | 4 412 | 81 453 | 36 357 | 45 096 | 18.5 | 8.2 | 10.2 | 2.68 | 24 445 |
| 1967 | 4 449 | 77 537 | 35 458 | 42 079 | 17.4 | 8.0 | 9.5 | 2.50 | 26 571 |
| 1968 | 4 484 | 76 370 | 38 076 | 38 294 | 17.0 | 8.5 | 8.5 | 2.40 | 27 398 |
| 1969 | 4 519 | 79 769 | 40 623 | 39 146 | 17.7 | 9.0 | 8.7 | 2.43 | 28 534 |
| 1970 | 4 550 | 80 666 | 42 240 | 38 426 | 17.7 | 9.3 | 8.4 | 2.40 | 27 873 |
| 1971 | 4 557 | 83 062 | 42 856 | 40 206 | 18.2 | 9.4 | 8.8 | 2.42 | 28 619 |
| 1972 | 4 597 | 87 794 | 41 410 | 46 384 | 19.1 | 9.0 | 10.1 | 2.49 | 26 213 |
| 1973 | 4 641 | 92 953 | 43 759 | 49 194 | 20.0 | 9.4 | 10.6 | 2.56 | 25 335 |
| 1974 | 4 690 | 97 585 | 44 934 | 52 651 | 20.8 | 9.6 | 11.2 | 2.60 | 26 086 |
| 1975 | 4 739 | 97 649 | 45 248 | 52 401 | 20.6 | 9.5 | 11.1 | 2.53 | 26 160 |
| 1976 | 4 790 | 99 814 | 45 420 | 54 394 | 20.8 | 9.5 | 11.4 | 2.52 | 27 700 |
| 1977 | 4 841 | 99 533 | 47 181 | 52 352 | 20.6 | 9.7 | 10.8 | 2.47 | 27 875 |
| 1978 | 4 890 | 100 193 | 47 778 | 52 415 | 20.5 | 9.8 | 10.7 | 2.45 | 28 641 |
| 1979 | 4 939 | 100 240 | 47 837 | 52 403 | 20.3 | 9.7 | 10.6 | 2.44 | 29 981 |
| 1980 | 4 984 | 95 100 | 50 579 | 44 521 | 19.1 | 10.1 | 8.9 | 2.31 | 31 240 |
| 1981 | 5 016 | 93 290 | 49 632 | 43 658 | 18.6 | 9.9 | 8.7 | 2.28 | 31 943 |
| 1982 | 5 055 | 92 618 | 50 393 | 42 225 | 18.3 | 10.0 | 8.4 | 2.26 | 33 107 |
| 1983 | 5 092 | 92 053 | 52 433 | 39 620 | 18.1 | 10.3 | 7.8 | 2.27 | 33 625 |
| 1984 | 5 127 | 90 843 | 51 739 | 39 104 | 17.7 | 10.1 | 7.6 | 2.25 | 34 268 |
| 1985 | 5 162 | 90 155 | 52 464 | 37 691 | 17.5 | 10.2 | 7.3 | 2.26 | 36 283 |
| 1986 | 5 193 | 87 138 | 53 233 | 33 905 | 16.8 | 10.3 | 6.5 | 2.20 | 40 624 |
| 1987 | 5 224 | 84 006 | 52 980 | 31 026 | 16.1 | 10.1 | 5.9 | 2.18 | 49 690 |
| 1988 | 5 251 | 83 242 | 52 475 | 30 767 | 15.9 | 10.0 | 5.9 | 2.15 | 51 000 |
| 1989 | 5 276 | 80 116 | 53 902 | 26 214 | 15.2 | 10.2 | 5.0 | 2.08 | 48 602 |
| 1990 | 5 298 | 79 989 | 54 619 | 25 370 | 15.1 | 10.3 | 4.8 | 2.08 | 48 437 |
| 1991 | 5 283 | 78 569 | 54 618 | 23 951 | 14.9 | 10.3 | 4.5 | 2.05 | 45 902 |
| 1992 | 5 307 | 74 640 | 53 423 | 21 217 | 14.1 | 10.1 | 4.0 | 1.99 | 42 626 |
| 1993 | 5 325 | 73 256 | 52 707 | 20 549 | 13.8 | 9.9 | 3.9 | 1.93 | 38 815 |
| 1994 | 5 347 | 66 370 | 51 386 | 14 984 | 12.4 | 9.6 | 2.8 | 1.67 | 34 883 |
| 1995 | 5 364 | 61 427 | 52 686 | 8 741 | 11.5 | 9.8 | 1.6 | 1.52 | 29 409 |
| 1996 | 5 374 | 60 123 | 51 236 | 8 887 | 11.2 | 9.5 | 1.7 | 1.47 | 25 173 |
| 1997 | 5 383 | 59 310 | 52 080 | 7 230 | 11.0 | 9.7 | 1.3 | 1.43 | 22 318 |
| 1998 | 5 391 | 57 582 | 53 156 | 4 426 | 10.7 | 9.9 | 0.8 | 1.37 | 21 109 |
| 1999 | 5 396 | 56 223 | 52 402 | 3 821 | 10.4 | 9.7 | 0.7 | 1.33 | 19 949 |
| 2000 | 5 401 | 55 151 | 52 724 | 2 427 | 10.2 | 9.8 | 0.4 | 1.29 | 18 468 |
| 2001 | 5 379 | 51 136 | 51 980 | -844 | 9.5 | 9.7 | -0.2 | 1.20 | 18 026 |
| 2002 | 5 379 | 50 841 | 51 532 | -691 | 9.5 | 9.6 | -0.1 | 1.19 | 17 382 |
| 2003 | 5 379 | 51 713 | 52 230 | -517 | 9.6 | 9.7 | -0.1 | 1.20 | 16 222 |
| 2004 | 5 383 | 53 747 | 51 852 | 1 895 | 10.0 | 9.6 | 0.4 | 1.24 | 15 307 |
| 2005 | 5 387 | 54 430 | 53 475 | 955 | 10.1 | 9.9 | 0.2 | 1.25 | 14 427 |
| 2006 | 5 391 | 53 904 | 53 301 | 603 | 10.0 | 9.9 | 0.1 | 1.24 | 14 243 |
| 2007 | 5 398 | 54 424 | 53 856 | 568 | 10.1 | 10.0 | 0.1 | 1.26 | 13 424 |
| 2008 | 5 407 | 57 360 | 53 164 | 4 196 | 10.6 | 9.8 | 0.8 | 1.32 | 13 394 |
| 2009 | 5 418 | 61 217 | 52 913 | 8 304 | 11.3 | 9.8 | 1.5 | 1.41 | 13 240 |
| 2010 | 5 431 | 60 410 | 53 445 | 6 965 | 11.1 | 9.8 | 1.3 | 1.40 | 12 582 |
| 2011 | 5 398 | 60 813 | 51 903 | 8 910 | 11.3 | 9.6 | 1.7 | 1.45 | 11 789 |
| 2012 | 5 408 | 55 535 | 52 437 | 3 098 | 10.3 | 9.7 | 0.6 | 1.34 | 11 214 |
| 2013 | 5 416 | 54 823 | 52 089 | 2 734 | 10.1 | 9.6 | 0.5 | 1.34 | 11 105 |
| 2014 | 5 421 | 55 033 | 51 346 | 3 687 | 10.2 | 9.5 | 0.7 | 1.37 | 10 582 |
| 2015 | 5 426 | 55 604 | 53 826 | 1 778 | 10.3 | 9.9 | 0.3 | 1.40 | 10 058 |
| 2016 | 5 435 | 57 557 | 52 351 | 5 206 | 10.6 | 9.6 | 1.0 | 1.48 | 9 390 |
| 2017[2][3] | 5 443 | 57 969 | 53 914 | 4 055 | 10.7 | 9.9 | 0.7 | 1.52 | 9 083 |
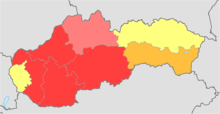
Density
 Плотность населения Словакии по районам
Current natural increase
- Number of births from January-July 2017 =

- Number of births from January-July 2018 =

- Number of deaths from January-July 2017 =

- Number of deaths from January-July 2018 =

- Natural growth from January-July 2017 =
- Natural growth from January-July 2018 =
- Number of marriages from January-July 2017 =
- Number of marriages from January-July 2018 =
Infant mortality rate
total: 6.47 deaths/1,000 live births
male 7.54 deaths/1,000 live births
female 5.34 deaths/1,000 live births (2012 est.)
Life expectancy at birth
Life expectancy from 1950 to 2015 (UN World Population Prospects)[5]:
| Period | Life expectancy in Years |
|---|---|
| 1950–1955 | 64.43 |
| 1955–1960 | |
| 1960–1965 | |
| 1965–1970 | |
| 1970–1975 | |
| 1975–1980 | |
| 1980–1985 | |
| 1985–1990 | |
| 1990–1995 | |
| 1995–2000 | |
| 2000–2005 | |
| 2005–2010 | |
| 2010–2015 |


Ethnic groups

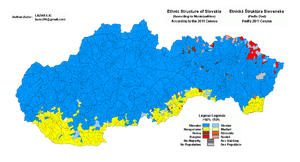
The majority of the 5.4 million inhabitants of Slovakia are Slovak (80.7%). Hungarians are the largest ethnic minority (8.5%) and are concentrated in the southern and eastern regions of Slovakia. Other ethnic groups include Roma (2.0%), Czechs, Croats, Rusyns, Ukrainians, Germans, Poles, Serbs[6] and Jews (about 2,300 remain of the estimated pre-WWII population of 120,000).
While both international organizations (the United Nations and the World Bank) and the official Slovak statistics office offer population figures for ethnic groups, these figures seldom come close to agreement. Figures for the Roma population (for a variety of reasons) vary between 1% and 10% of the population. In the most recent survey carried out by the Slovak Government's Roma Plenipotentiary, the figure for the percentage of Roma was arrived at through interview with municipality representatives and mayors, according to how many Roma they think live in their jurisdictions. The figure arrived at by this means was in the region of 300,000 (about 5.6%). Note that in the case of the 5.6%, however, the above percentages of Hungarians and Slovaks are lower accordingly.
| Ethnic group |
census 1950 | census 1961 | census 1970 | census 1980 | census 1991 | census 2001 | census 2011 | |||||||
|---|---|---|---|---|---|---|---|---|---|---|---|---|---|---|
| Number | % | Number | % | Number | % | Number | % | Number | % | Number | % | Number | % | |
| Slovaks | 86.6 | 85.3 | 85.5 | 4,317,008 | 86.5 | 4,519,328 | 85.7 | 4,614,854 | 85.8 | 4,352,775 | 80.7 | |||
| Hungarians | 10.3 | 12.4 | 12.2 | 559,490 | 11.2 | 567,296 | 10.8 | 520,528 | 9.7 | 458,467 | 8.5 | |||
| Romani1 | - | - | - | - | - | 75,802 | 1.4 | 89,920 | 1.7 | 105,738 | 2.0 | |||
| Czechs | 1.2 | 1.1 | 1.0 | 57,197 | 1.1 | 59,326 | 1.1 | 44,620 | 0.8 | 30,367 | 0.6 | |||
| Rusyns | 1.4 | - | 0.9 | 36,850 | 0.7 | 17,197 | 0.3 | 24,201 | 0.4 | 33,482 | 0.6 | |||
| Ukrainians | 13,281 | 0.3 | 10,814 | 0.2 | 7,430 | 0.1 | ||||||||
| Others/undeclared | 0.5 | 1.2 | 0.4 | 20,623 | 0.4 | 22,105 | 0.4 | 74,518 | 1.4 | 408,777 | 7.5 | |||
| Total | 3,442,317 | 4,174,046 | 4,537,290 | 4,991,168 | 5,274,335 | 5,379,455 | 5,397,036 | |||||||
| 1 Before 1991 the Romani were not recognized as a separate ethnic group | ||||||||||||||
The official state language is Slovak, and Hungarian is widely spoken in the southern regions.
Despite its modern European economy and society, Slovakia has a significant rural element. About 45% of Slovaks live in villages with fewer than 5,000 inhabitants, and 14% in villages with fewer than 1,000.
Religion
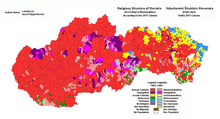
The Slovak constitution guarantees freedom of religion. The majority of Slovak citizens (62%) practice Roman Catholicism; the second-largest group consider themselves atheists (13%). About 6.9% are Protestants, 4.1% are Greek Catholics, and 0.9% are Orthodox. Reformed Christian Church 2.0%, other 6.4% (2004 survey).
See also
References
- ↑ "World Population Prospects: The 2017 Revision". ESA.UN.org (custom data acquired via website). United Nations Department of Economic and Social Affairs, Population Division. Retrieved 10 September 2017.
- ↑ "Štatistický úrad SR". Portal.statistics.sk. Retrieved 29 August 2017.
- ↑ "Main demographic data". Infostat.sk. Retrieved 29 August 2017.
- ↑ "DATAcube". Datacube.statistics.sk. Retrieved 24 October 2017.
- ↑ "World Population Prospects – Population Division – United Nations". Retrieved 2017-07-15.
- ↑ "Archived copy". Archived from the original on 2010-09-18. Retrieved 2010-09-18.
- ↑ "Demographic data from population and housing censuses in Slovakia". Sodb.infostat.sk. Retrieved 29 August 2017.
- ↑ "Development of prices in production area in July 2017" (PDF). Portal.statistics.sk. Archived from the original (PDF) on 15 July 2007. Retrieved 29 August 2017.
External links
- "New Page 1". Statistics.sk. Retrieved 29 August 2017.
- "Main demographic data". Infostat.sk. Retrieved 29 August 2017.

|