Demography of England

.png)
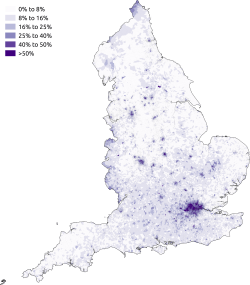
The demography of England has since 1801 been measured by the decennial national census, and is marked by centuries of population growth and urbanisation. Due to the lack of authoritative contemporary sources, estimates of the population of England for dates prior to the first census in 1801 vary considerably.
Population
The population at the time of the 2011 census was 53,012,456
- Male: 26,069,148
- Female: 26,943,308
- Total: 53,012,456[1]
- Total Fertility Rate: 1.97[2] (higher than Germany – 1.42 & Italy – 1.40, lower than France – 2.02)
Historical population
| Population 5000–100BC | ||
|---|---|---|
| Year | Pop. | ±% |
| 5000BC | below 6000 | — |
| 3000BC | 100,000 | — |
| 1800BC | 300,000 | +200.0% |
| 100BC | 1,500,000 | +400.0% |
| Source: [3] | ||
| Population 1100–1700 | ||
|---|---|---|
| Year | Pop. | ±% |
| 1086 | 1,710,000 | — |
| 1190 | 3,100,000 | +81.3% |
| 1220 | 3,970,000 | +28.1% |
| 1250 | 4,230,000 | +6.5% |
| 1279 | 4,430,000 | +4.7% |
| 1290 | 4,750,000 | +7.2% |
| 1315 | 4,690,000 | −1.3% |
| 1325 | 4,120,000 | −12.2% |
| 1348 | 4,810,000 | +16.7% |
| 1351 | 2,600,000 | −45.9% |
| 1377 | 2,500,000 | −3.8% |
| 1400 | 2,080,000 | −16.8% |
| 1430 | 2,020,000 | −2.9% |
| 1450 | 1,900,000 | −5.9% |
| 1490 | 2,140,000 | +12.6% |
| 1522 | 2,350,000 | +9.8% |
| 1541 | 2,830,000 | +20.4% |
| 1560 | 3,200,000 | +13.1% |
| 1600 | 4,110,000 | +28.4% |
| 1650 | 5,310,000 | +29.2% |
| 1700 | 5,200,000 | −2.1% |
| Source: [4] [5] | ||
| Population 1801–2017 | ||
|---|---|---|
| Year | Pop. | ±% |
| 1801 | 7,754,875 | — |
| 1811 | 8,762,178 | +13.0% |
| 1821 | 10,402,143 | +18.7% |
| 1831 | 12,011,830 | +15.5% |
| 1841 | 13,654,914 | +13.7% |
| 1851 | 15,288,885 | +12.0% |
| 1861 | 18,325,052 | +19.9% |
| 1871 | 21,361,235 | +16.6% |
| 1881 | 24,397,385 | +14.2% |
| 1891 | 27,231,229 | +11.6% |
| 1901 | 30,072,180 | +10.4% |
| 1911 | 33,561,235 | +11.6% |
| 1921 | 35,230,225 | +5.0% |
| 1931 | 37,359,045 | +6.0% |
| 1941 | 38,084,321 | +1.9% |
| 1951 | 38,668,830 | +1.5% |
| 1961 | 41,159,213 | +6.4% |
| 1971 | 43,460,525 | +5.6% |
| 1981 | 45,978,080 | +5.8% |
| 1991 | 48,197,672 | +4.8% |
| 2001 | 49,138,831 | +2.0% |
| 2011 | 53,012,456 | +7.9% |
| 2017 | 55,619,400 | +4.9% |
| Source: Year(s) 1801–2011[5][6][7][8] | ||
Vital statistics
| Average population (x 1000) | Live births | Deaths | Natural change | Crude birth rate (per 1000) | Crude death rate (per 1000) | Natural change (per 1000) | Fertility rates | |
|---|---|---|---|---|---|---|---|---|
| 1940 | 567 710 | 545 952 | 21 758 | |||||
| 1941 | 539 205 | 499 343 | 39 862 | |||||
| 1942 | 608 373 | 448 777 | 159 596 | |||||
| 1943 | 641 064 | 469 916 | 171 148 | |||||
| 1944 | 704 748 | 461 189 | 243 559 | |||||
| 1945 | 638 422 | 456 216 | 182 206 | |||||
| 1946 | 773 153 | 460 543 | 312 610 | |||||
| 1947 | 829 863 | 484 324 | 345 539 | |||||
| 1948 | 728 131 | 439 803 | 288 328 | |||||
| 1949 | 686 181 | 478 627 | 207 554 | |||||
| 1950 | 654 321 | 477 006 | 177 315 | |||||
| 1951 | 636 259 | 513 375 | 122 884 | |||||
| 1952 | 632 347 | 466 479 | 165 858 | |||||
| 1953 | 642 844 | 472 137 | 170 707 | |||||
| 1954 | 633 395 | 469 074 | 164 321 | |||||
| 1955 | 628 935 | 484 926 | 144 009 | |||||
| 1956 | 659 420 | 488 893 | 170 527 | |||||
| 1957 | 681 736 | 482 174 | 199 562 | |||||
| 1958 | 698 255 | 494 201 | 204 054 | |||||
| 1959 | 706 239 | 495 517 | 210 722 | |||||
| 1960 | 740 858 | 493 553 | 247 305 | |||||
| 1961 | 766 358 | 518 047 | 248 311 | |||||
| 1962 | 793 354 | 523 855 | 269 499 | |||||
| 1963 | 807 017 | 538 105 | 268 912 | |||||
| 1964 | 828 470 | 501 991 | 326 479 | |||||
| 1965 | 816 433 | 516 317 | 300 116 | |||||
| 1966 | 804 957 | 528 981 | 275 976 | |||||
| 1967 | 788 458 | 509 356 | 279 102 | |||||
| 1968 | 775 065 | 541 862 | 233 203 | |||||
| 1969 | 754 456 | 543 425 | 211 031 | |||||
| 1970 | 741 999 | 540 196 | 201 803 | 16.0 | 11.6 | 4.4 | ||
| 1971 | 46 411 | 740 099 | 532 445 | 207 654 | 15.9 | 11.5 | 4.4 | |
| 1972 | 46 572 | 685 485 | 554 251 | 131 234 | 14.7 | 11.9 | 2.8 | |
| 1973 | 46 686 | 638 356 | 549 876 | 88 480 | 13.7 | 11.8 | 1.9 | |
| 1974 | 46 682 | 603 153 | 547 980 | 55 173 | 12.9 | 11.7 | 1.2 | |
| 1975 | 46 674 | 568 900 | 545 444 | 23 456 | 12.2 | 11.7 | 0.5 | |
| 1976 | 46 659 | 550 383 | 560 317 | -9 934 | 11.8 | 12.0 | -0.2 | |
| 1977 | 46 639 | 536 953 | 538 652 | -1 699 | 11.5 | 11.5 | -0.0 | |
| 1978 | 46 638 | 562 589 | 547 685 | 14 904 | 12.1 | 11.7 | 0.4 | |
| 1979 | 46 698 | 601 316 | 554 840 | 46 476 | 12.9 | 11.9 | 1.0 | |
| 1980 | 46 787 | 618 371 | 544 349 | 74 022 | 13.2 | 11.6 | 1.6 | |
| 1981 | 46 820 | 598 163 | 541 018 | 57 145 | 12.8 | 11.6 | 1.2 | |
| 1982 | 46 777 | 589 711 | 544 984 | 44 727 | 12.6 | 11.7 | 0.9 | 1.76 |
| 1983 | 46 813 | 593 255 | 542 509 | 50 746 | 12.7 | 11.6 | 1.1 | 1.75 |
| 1984 | 46 912 | 600 573 | 531 314 | 69 259 | 12.8 | 11.3 | 1.5 | 1.75 |
| 1985 | 47 057 | 619 301 | 553 153 | 66 148 | 13.2 | 11.8 | 1.4 | 1.78 |
| 1986 | 47 187 | 623 609 | 544 545 | 79 064 | 13.2 | 11.5 | 1.7 | 1.76 |
| 1987 | 47 300 | 643 330 | 531 150 | 112 180 | 13.6 | 11.2 | 2.4 | 1.80 |
| 1988 | 47 412 | 654 353 | 535 553 | 118 800 | 13.8 | 11.3 | 2.5 | 1.82 |
| 1989 | 47 552 | 649 357 | 539 804 | 109 553 | 13.7 | 11.4 | 2.3 | 1.79 |
| 1990 | 47 699 | 666 920 | 528 920 | 138 000 | 14.0 | 11.1 | 3.9 | 1.83 |
| 1991 | 47 875 | 660 806 | 533 980 | 126 826 | 13.8 | 11.2 | 2.6 | 1.81 |
| 1992 | 47 998 | 651 784 | 522 660 | 129 124 | 13.6 | 10.9 | 2.7 | 1.79 |
| 1993 | 48 102 | 636 473 | 540 904 | 95 569 | 13.2 | 11.2 | 2.0 | 1.76 |
| 1994 | 48 228 | 628 956 | 516 297 | 112 659 | 13.0 | 10.7 | 2.3 | 1.75 |
| 1995 | 48 383 | 613 257 | 529 038 | 84 219 | 12.7 | 10.9 | 1.8 | 1.71 |
| 1996 | 48 519 | 614 184 | 526 650 | 87 534 | 12.7 | 10.9 | 1.8 | 1.73 |
| 1997 | 48 664 | 608 202 | 521 598 | 86 604 | 12.5 | 10.7 | 1.8 | 1.73 |
| 1998 | 48 820 | 602 111 | 518 089 | 84 022 | 12.3 | 10.6 | 1.7 | 1.72 |
| 1999 | 49 032 | 589 468 | 517 119 | 72 349 | 12.0 | 10.5 | 1.5 | 1.69 |
| 2000 | 49 233 | 572 826 | 503 026 | 69 800 | 11.6 | 10.2 | 1.4 | 1.65 |
| 2001 | 49 449 | 563 744 | 497 878 | 65 866 | 11.4 | 10.1 | 1.3 | 1.63 |
| 2002 | 49 679 | 565 709 | 500 792 | 64 917 | 11.4 | 10.1 | 1.3 | 1.64 |
| 2003 | 49 925 | 589 851 | 504 127 | 85 724 | 11.8 | 10.1 | 1.7 | 1.72 |
| 2004 | 50 194 | 607 184 | 480 717 | 126 467 | 12.1 | 9.6 | 2.5 | 1.77 |
| 2005 | 50 606 | 613 028 | 479 678 | 133 350 | 12.1 | 9.5 | 2.6 | 1.77 |
| 2006 | 50 965 | 635 748 | 470 326 | 165 422 | 12.5 | 9.2 | 3.3 | 1.83 |
| 2007 | 51 381 | 655 357 | 470 721 | 184 636 | 12.8 | 9.2 | 3.6 | 1.88 |
| 2008 | 51 815 | 672 809 | 475 763 | 197 046 | 13.0 | 9.2 | 3.8 | 1.92 |
| 2009 | 52 196 | 671 058 | 459 241 | 211 817 | 12.9 | 8.8 | 4.1 | 1.91 |
| 2010 | 52 642 | 687 007 | 461 017 | 225 990 | 13.1 | 8.8 | 4.3 | 1.94 |
| 2011 | 53 107 | 688 120 | 452 862 | 235 258 | 13.0 | 8.5 | 4.5 | 1.93 |
| 2012 | 53 493 | 694 241 | 466 779 | 227 462 | 13.0 | 8.7 | 4.3 | 1.94 |
| 2013 | 53 865 | 664 517 | 473 552 | 190 965 | 12.3 | 8.8 | 3.5 | 1.85 |
| 2014 | 54 316 | 661 496 | 468 875 | 192 621 | 12.2 | 8.6 | 3.6 | 1.83 |
| 2015 | 54 786 | 664 399 | 495 309 | 169 090 | 12.1 | 9.0 | 3.1 | 1.82 |
| 2016 | 55 268 | 663 157 | 490 454 | 172 703 | 12.0 | 8.9 | 3.1 | 1.81 |
| 2017 | 55 619 | 646 794 | 498 882 | 147 912 | 11.6 | 9.0 | 2.6 | 1.76 |
Place of birth
Places of birth given by respondents to the 2001 and 2011 censuses were as follows:
| Country of birth | 2001[10] | 2011[11] | ||
|---|---|---|---|---|
| Number | % | Number | % | |
| 42,968,596 | 87.44% | 44,246,592 | 83.46% | |
| 794,577 | 1.62% | 708,872 | 1.34% | |
| 609,711 | 1.24% | 506,619 | 0.96% | |
| 215,124 | 0.44% | 206,735 | 0.39% | |
| 6,499 | 0.01% | |||
| 459,662 | 0.94% | 395,182 | 0.75% | |
| 695,045 | 1.41% | 1,980,259 | 3.73% | |
| 894,908 | 1.69% | |||
| 1,085,351 | 2.04% | |||
| 3,396,116 | 6.91% | 4,961,698 | 9.36% | |
| Total | 49,138,831 | 100.00% | 53,012,456 | 100.00% |
Below are the 5 largest foreign-born groups in England according to 2014 ONS estimates.[12]
| Country of birth | Estimated population, 2013 | Estimated population, 2014 | Estimated population, 2015 |
|---|---|---|---|
| 698,000 | 748,000 | 751,000 | |
| 561,000 | 677,000 | 713,000 | |
| 479,000 | 499,000 | 478,000 | |
| 315,000 | 317,000 | 318,000 | |
| 263,000 | 267,000 | 253,000 |
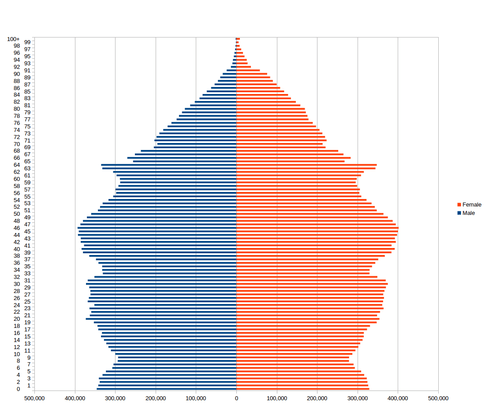
Age
The data below is based on the 2011 census.[13] In 2001, the mean age of England's population was 38.60, and the median age was 37.00.
| Ages attained (years) |
Population | % of total population |
% per year of age band |
|---|---|---|---|
| 0–4 | 3,318,449 | 6.26 | 1.25 |
| 5–9 | 2,972,632 | 5.61 | 1.12 |
| 10–14 | 3,080,929 | 5.81 | 1.16 |
| 15–19 | 3,340,265 | 6.30 | 1.26 |
| 20–24 | 3,595,321 | 6.78 | 1.36 |
| 25–29 | 3,650,881 | 6.89 | 1.38 |
| 30–34 | 3,509,221 | 6.62 | 1.32 |
| 35–39 | 3,549,116 | 6.69 | 1.34 |
| 40–44 | 3,885,934 | 7.33 | 1.47 |
| 45–49 | 3,879,815 | 7.32 | 1.46 |
| 50–54 | 3,400,095 | 6.41 | 1.28 |
| 55–59 | 2,996,992 | 5.65 | 1.13 |
| 60–64 | 3,172,277 | 5.98 | 1.20 |
| 65–69 | 2,508,154 | 4.73 | 0.95 |
| 70–74 | 2,044,129 | 3.86 | 0.77 |
| 75–79 | 1,669,345 | 3.15 | 0.63 |
| 80–84 | 1,258,773 | 2.37 | 0.47 |
| 85–89 | 776,311 | 1.46 | 0.29 |
| 90+ | 403,817 | 0.76 | – |
Life expectancy at birth[14]
- January 2001 – December 2003
- Males: 76.24 years
- Females: 80.72 years
- January 2002 – December 2004
- Males: 76.55 years
- Females: 80.91 years
- January 2003 – December 2005
- Males: 76.92 years
- Females: 81.14 years
Ethnicity
The 2001 and 2011 censuses recorded the following ethnic groups:
| Ethnic group | 2001 population | 2001 % | 2011 population | 2011 % |
|---|---|---|---|---|
| White: British | 42,747,136 | 87.0 | 42,279,236 | 79.8 |
| White: Irish | 624,115 | 1.3 | 517,001 | 1.0 |
| White: Irish Traveller/White Gypsy[note 1] | 54,895 | 0.1 | ||
| White: Other | 1,308,110 | 2.7 | 2,430,010 | 4.6 |
| White: Total | 44,679,361 | 91.0 | 45,281,142 |
85.4 |
| Asian or Asian British: Indian | 1,028,546 | 2.1 | 1,395,702 | 2.6 |
| Asian or Asian British: Pakistani | 706,539 | 1.4 | 1,112,282 | 2.1 |
| Asian or Asian British: Bangladeshi | 275,394 | 0.6 | 436,514 | 0.8 |
| Asian or Asian British: Chinese[note 2] | 220,681 | 0.5 | 379,502 | 0.7 |
| Asian or Asian British: Asian Other | 237,810 | 0.5 | 819,403 | 1.6 |
| Asian or Asian British: Total | 2,468,970 | 5.1 | 4,143,403 |
7.8 |
| Black or Black British: Caribbean | 561,246 | 1.1 | 591,016 | 1.1 |
| Black or Black British: African | 475,938 | 1.0 | 977,741 | 1.8 |
| Black or Black British: Other | 95,324 | 0.2 | 277,857 | 0.5 |
| Black or Black British: Total | 1,132,508 | 2.3 | 1,846,614 |
3.5 |
| Mixed: White and Caribbean | 231,424 | 0.5 | 415,616 | 0.8 |
| Mixed: White and African | 76,498 | 0.2 | 161,550 | 0.3 |
| Mixed: White and Asian Other | 184,014 | 0.4 | 332,708 | 0.6 |
| Mixed: Other Mixed | 151,437 | 0.3 | 283,005 | 0.3 |
| British Mixed: Total | 643,373 | 1.4 | 1,192,879 |
2.3 |
| Other: Arab[note 3] | 220,985 | 0.4 | ||
| Other: Any other ethnic group | 214,619 | 0.4 | 327,433 | 0.6 |
| Other: Total | 214,619 | 0.4 | 548,418 |
1.0 |
| Total | 49,138,831 | 100 | 53,012,456 |
100 |
Notes for table above
- Source: 2001 Census KS06 Ethnic group: Key Statistics for local Authorities and 2011 Census: KS201EW Ethnic group: local authorities in England and Wales.
Languages
The most common main languages spoken in England according to the 2011 census are shown below.[15]
| Rank | Language | Usual residents aged 3+ | Proportion |
|---|---|---|---|
| 1 | English | 46,936,780 | 92.02% |
| 2 | Polish | 529,173 | 1.04% |
| 3 | Punjabi | 271,580 | 0.53% |
| 4 | Urdu | 266,330 | 0.52% |
| 5 | Bengali (with Sylheti and Chatgaya) | 216,196 | 0.42% |
| 6 | Gujarati | 212,217 | 0.42% |
| 7 | Arabic | 152,490 | 0.30% |
| 8 | French | 145,026 | 0.28% |
| 9 | Portuguese | 131,002 | 0.26% |
| 10 | Spanish | 118,554 | 0.23% |
| 11 | Tamil | 99,773 | 0.20% |
| 12 | Turkish | 98,083 | 0.19% |
| 13 | Italian | 90,547 | 0.18% |
| 14 | Somali | 84,387 | 0.17% |
| 15 | Lithuanian | 84,327 | 0.17% |
| 16 | German | 75,190 | 0.15% |
| 17 | Persian/Farsi | 75,179 | 0.15% |
| 18 | Tagalog/Filipino | 67,593 | 0.13% |
| 19 | Romanian | 66,496 | 0.13% |
| 20 | Russian | 66,271 | 0.13% |
| – | Welsh | 8,248 | 0.02% |
| – | Cornish | 554 | 0.00% |
| – | Other | 1,209,614 | 2.37% |
| Population | 51,005,610 | 100.00% |
Religion
Religion in England (2011 census)
Respondents to the 2001 and 2011 censuses gave their religions as follows:
| Religion | 2001[16] | 2011[17] | ||
|---|---|---|---|---|
| Number | % | Number | % | |
| Christian | 35,251,244 | 71.74% | 31,479,876 | 59.38% |
| Muslim | 1,524,887 | 3.10% | 2,660,116 | 5.02% |
| Hindu | 546,982 | 1.11% | 806,199 | 1.52% |
| Sikh | 327,343 | 0.67% | 420,196 | 0.79% |
| Jewish | 257,671 | 0.52% | 261,282 | 0.49% |
| Buddhist | 139,046 | 0.28% | 238,626 | 0.45% |
| Other religion | 143,811 | 0.29% | 227,825 | 0.43% |
| No religion | 7,171,332 | 14.59% | 13,114,232 | 24.74% |
| Religion not stated | 3,776,515 | 7.69% | 3,804,104 | 7.18% |
| Total population | 49,138,831 | 100.00% | 53,012,456 | 100.00% |
See also
- Demography of the United Kingdom
- Demography of Scotland
- Demography of Wales
- Demography of Northern Ireland
- Demography of London
- Demography of Birmingham
- Demography of Greater Manchester
- United Kingdom Census 2011
- National Statistics Socio-economic Classification
- Census 2001 Ethnic Codes
- List of English districts by population
- List of urban areas in England by population
- List of towns and cities in England by historical population
- List of major settlements by population in English counties
Notes
References
- ↑ "2011 Census: Population Estimates for the United Kingdom" (PDF). Office for National Statistics. 27 March 2011. Retrieved 18 December 2012.
- ↑ "National Statistics Online – Live births". Statistics.gov.uk. Retrieved 9 July 2010.
- ↑ Prior, Francis (2004). BC Life in Britain and Ireland Before the Romans. London: Harper Perennial. ISBN 978-0007126934.
- ↑ S. Broadberry et al (2010), "English Medieval Population: Reconciling Time Series and Cross Sectional Evidence", Table 7 (Preprint, p.22); S. Broadberry et al (2010), "British Economic Growth 1270–1870", Table 18 (Preprint, p. 54); see also S. Broadberry et al (2015), British Economic Growth 1270–1870, Cambridge University Press,
ISBN 1107070783, Chapter 1, and Table 5.06, pg 205
See also B. Campbell (1990), "People and Land in the Middle Ages, 1066–1500", in Robert A. Dodgshon and Robin A. Butlin (eds), Historical Geography of England and Wales, 2nd edition. Elsevier. ISBN 1483288412, pp. 69–122 for discussion of drivers and trends underlying the numbers. - 1 2 Wrigley and Schofield, "The Population History of England, 1541–1871. A reconstruction.", Harvard University Press, 1981, Table 7.8, pgs. 208-9,
- ↑ At the time of the first census. Census officials estimated that there had been an increase of 77% in the preceding 100 years. In each county women were in the majority. Notes for 1801 taken from Kent 1800–1899 – A Chronicle of the Nineteenth Century Bob Ogley (Froglets Publications 2003) ISBN 1-872337-51-1. Wrigley and Schofield estimate 8,664,000 based on birth and death records.]
- ↑ Vision of Britain a population through time England, Retrieved 9 August 2013
- ↑ 2011 Census: Population Estimates for the United Kingdom, 27 March 2011 (PDF), ONS, 12 December 2011, archived from the original (PDF) on 5 January 2016, retrieved 9 August 2013
- ↑ "Vital Statistics: Population and Health Reference Tables". Office for National Statistics. Retrieved 20 July 2017.
- ↑ Census 2001 Key Statistics – Local Authorities KS05 Country of birth, Accessed 6 September 2014
- ↑ 2011 Census: KS202EW National identity, local authorities in England and Wales, Accessed 22 December 2012
- ↑ "Table 1.3: Overseas-born population in the United Kingdom, excluding some residents in communal establishments, by sex, by country of birth, January 2014 to December 2014". Office for National Statistics. 27 August 2015. Retrieved 17 April 2016. Figures given are the central estimates. See the source for 95 per cent confidence intervals.
- ↑ UK Statistics (27 March 2011). "2011 Census: Usual resident population by five-year age group and sex, United Kingdom and constituent countries". UK Statistics. Retrieved 19 December 2012.
- ↑ Neighbourhood Statistics. "Life Expectancy at Birth for City of London, London, England". Neighbourhood.statistics.gov.uk. Retrieved 9 July 2010.
- ↑ "View:England". NOMIS. Retrieved 5 September 2014.
- ↑ "Religion (2001 Census)". data.gov.uk. Retrieved 18 December 2012.
- ↑ "2011 Census: KS209EW Religion, local authorities in England and Wales". ons.gov.uk. Retrieved 18 December 2012.