Demographics of Italy
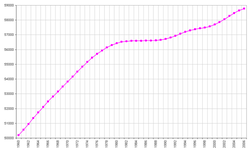
| Historical population | ||
|---|---|---|
| Year | Pop. | ±% |
| 1 | 8-10,000,000 | — |
| 500 | 7,000,000 | — |
| 1000 | 7,000,000 | +0.0% |
| 1500 | 11,000,000 | +57.1% |
| 1861 | 22,182,377 | +101.7% |
| 1871 | 27,303,509 | +23.1% |
| 1881 | 28,953,480 | +6.0% |
| 1901 | 32,965,504 | +13.9% |
| 1911 | 35,845,048 | +8.7% |
| 1921 | 39,943,528 | +11.4% |
| 1931 | 41,651,000 | +4.3% |
| 1936 | 42,943,602 | +3.1% |
| 1951 | 47,515,537 | +10.6% |
| 1961 | 50,623,569 | +6.5% |
| 1971 | 54,136,547 | +6.9% |
| 1981 | 56,556,911 | +4.5% |
| 1991 | 56,778,031 | +0.4% |
| 2001 | 56,995,744 | +0.4% |
| 2011 | 59,433,744 | +4.3% |
| 2018 | 60,494,000 | +1.8% |
| Source: ISTAT | ||
This article is about the demographic features of the population of Italy, including population density, ethnicity, education level, health of the populace, economic status, religious affiliations and other aspects of the population.
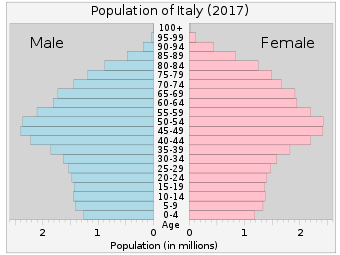
At the beginning of year 2017, Italy had an estimated population of 60.4 million. Its population density, at 201 inhabitants per square kilometre (520/sq mi), is higher than that of most Western European countries. However the distribution of the population is widely uneven. The most densely populated areas are the Po Valley (that accounts for almost half of the national population) and the metropolitan areas of Rome and Naples, while vast regions such as the Alps and Apennines highlands, the plateaus of Basilicata and the island of Sardinia are very sparsely populated.
The population of Italy almost doubled during the twentieth century, but the pattern of growth was extremely uneven due to large-scale internal migration from the rural South to the industrial cities of the North, a phenomenon which happened as a consequence of the Italian economic miracle of the 1950-60's. In addition, after centuries of net emigration, from the 1980's Italy has experienced large-scale immigration for the first time in modern history. According to the Italian government, there were an estimated 5,000,073 foreign nationals resident in Italy.[1]
High fertility and birth rates persisted until the 1970's, after which they started to dramatically decline, leading to rapid population aging. At the end of the first decade of the 21st century, one in five Italians was over 65 years old.[2] However, as a result of the massive immigration of the last two decades, Italy has, in recent years, experienced a significant growth in birth rates.[3] The total fertility rate has also climbed from an all-time low of 1.18 children per woman in 1995 to 1.41 in 2008.[4]
Since the 1984 Lateran Treaty agreement, Italy has no official religion. However, it recognizes the role the Catholic Church plays in Italian society. 87.8% of the population identify as Catholic, 5.8% as non-believers or atheists, 2.6% as Muslims, and 3.8% adhere to other religions.
Urbanization
| Rank | Name | Region | Pop. | Rank | Name | Region | Pop. | ||
|---|---|---|---|---|---|---|---|---|---|
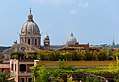 Rome 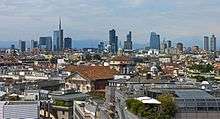 Milan |
1 | Rome | Lazio | 2,872,021 | 11 | Venice | Veneto | 264,579 | 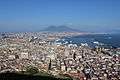 Naples 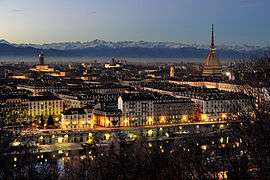 Turin |
| 2 | Milan | Lombardy | 1,337,155 | 12 | Verona | Veneto | 260,125 | ||
| 3 | Naples | Campania | 978,399 | 13 | Messina | Sicily | 240,414 | ||
| 4 | Turin | Piedmont | 896,773 | 14 | Padua | Veneto | 211,210 | ||
| 5 | Palermo | Sicily | 678,492 | 15 | Trieste | Friuli-Venezia Giulia | 205,413 | ||
| 6 | Genoa | Liguria | 592,507 | 16 | Taranto | Apulia | 202,016 | ||
| 7 | Bologna | Emilia-Romagna | 386,181 | 17 | Brescia | Lombardy | 196,058 | ||
| 8 | Florence | Tuscany | 381,037 | 18 | Prato | Tuscany | 191,002 | ||
| 9 | Bari | Apulia | 327,361 | 19 | Parma | Emilia-Romagna | 190,284 | ||
| 10 | Catania | Sicily | 315,601 | 20 | Modena | Emilia-Romagna | 185,148 | ||
About 68% of Italian population is classified as urban,[5] a relatively low figure among developed countries. During the last two decades, Italy underwent a devolution process, that eventually led to the creation of administrative metropolitan areas, in order to give major cities and their metropolitan areas a provincial status (somehow similar to PRC's direct-controlled municipality).
Ethnic groups
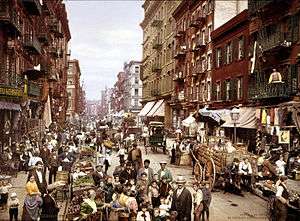

Italy used to be a country of mass emigration from the late 19th century until the 1970's. Between 1898 and 1914, the peak years of Italian diaspora, approximately 750,000 Italians emigrated each year.[7] Italian communities once thrived in the former African colonies of Eritrea (nearly 100,000 at the beginning of World War II),[8] Somalia and Libya (150,000 Italians settled in Libya, constituting about 18% of the total population).[9] All of Libya's Italians were expelled from the North African country in 1970.[10] In addition, after the annexation of Istria in 1945, up to 350,000 ethnic Italians left Titoist Yugoslavia.[11] Today, large numbers of people with full or significant Italian ancestry are found in Brazil (25 million),[12] Argentina (20 million),[13] US (17.8 million),[14] France (5 million),[15] Venezuela (2 million),[16][17] Uruguay (1.5 million),[18] Canada (1.4 million),[19] and Australia (800,000).[20]
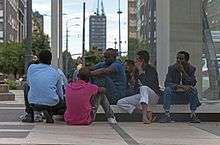
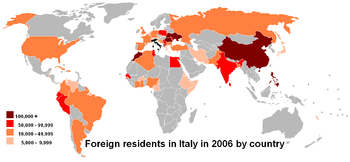
As a result of the profound economic and social changes induced by postwar industrialization, including low birth rates, an aging population and thus a shrinking workforce, during the 1980's Italy became to attract rising flows of foreign immigrants. The present-day figure of about 5 million foreign residents, that make up some 9% of the total population, include 97,000 children born in Italy to foreign nationals (19% of total births in Italy) in 2014, but exclude foreign nationals who have subsequently acquired Italian nationality; this applied to 106,000 people in 2014.[21][22] The official figures also exclude illegal immigrants, the so-called clandestini, whose numbers are very difficult to determine. In May 2008 The Boston Globe quoted an estimate of 670,000 for this group.[23] Since the fall of the Berlin Wall in 1989, and more recently, the 2004 and 2007 enlargements of the European Union, the main waves of migration came from the former socialist countries of Eastern Europe (especially Romania, Albania, Ukraine and Poland). The second most important area of immigration to Italy has always been the neighbouring North Africa (in particular, Morocco, Egypt and Tunisia), with soaring arrivals as a consequence of the Arab Spring. Furthermore, in recent years, growing migration fluxes from the Far East (notably, China[24] and the Philippines) and Latin America (Ecuador, Peru) have been recorded. Currently, circa one million Romanians (around one tenth of them being Roma[25]) are officially registered as living in Italy, representing thus the most important individual country of origin, followed by Albanians and Moroccans with about 500,000 people each. The number of unregistered Romanians is difficult to estimate, but the Balkan Investigative Reporting Network suggested that in 2007 that there might have been half a million or more.[26][note 1] Overall, at the end of the 2000s the foreign born population of Italy was from: Europe (54%), Africa (22%), Asia (16%), the Americas (8%) and Oceania (0.06%). The distribution of immigrants is largely uneven in Italy: 84.9% of immigrants live in the northern and central parts of the country (the most economically developed areas), while only 15.1% live in the southern half of the peninsula.
There is significant cultural, linguistic, genetic, historical political diversity within the "Italian" ethnicity, enough to constitute several distinct ethnicities by some standards; when Italy unified in 1861, only 3% of the population spoke Standard Italian, with the rest speaking various other languages, and today an estimated 50% of Italians speak a language other than standard Italian as their L1.[28] Friulians, Sicilians, and Sardinians are examples of distinct sub-ethnicities in Italy.
| Origin | Population | Percent |
|---|---|---|
| Italian | 55,818,099 | 92.81% |
| Romanian | 604,832 | 1.00% |
| North African (Maghrebis) | 646,624 | 1.07% |
| Albanian | 502,546 | 0.77% |
| Chinese | 265,820 | 0.28% |
| Ukrainian | 233,726 | 0.31% |
| Asian (non-Chinese) | 499,013 | 0.83% |
| Sub-Saharan African | 324,917 | 0.54% |
| Latin American | 285,169 | 0.47% |
| Other | 782,549 | 1.29% |
Historical data
Life expectancy at birth from 1871 to 2015
Sources: Our World In Data and the United Nations.
1871-1950
| Years | 1871 | 1872 | 1873 | 1874 | 1875 | 1876 | 1877 | 1878 | 1879 | 1880[31] |
|---|---|---|---|---|---|---|---|---|---|---|
| Life expectancy in Italy | 29.8 | 29.7 | 31.6 | 31.8 | 31.3 | 33.6 | 34.9 | 34.3 | 34.0 | 32.8 |
| Years | 1881 | 1882 | 1883 | 1884 | 1885 | 1886 | 1887 | 1888 | 1889 | 1890[31] |
|---|---|---|---|---|---|---|---|---|---|---|
| Life expectancy in Italy | 34.2 | 34.3 | 35.2 | 36.6 | 36.9 | 35.1 | 36.0 | 37.0 | 39.1 | 38.5 |
| Years | 1891 | 1892 | 1893 | 1894 | 1895 | 1896 | 1897 | 1898 | 1899 | 1900[31] |
|---|---|---|---|---|---|---|---|---|---|---|
| Life expectancy in Italy | 38.5 | 38.9 | 39.8 | 40.0 | 39.6 | 40.7 | 43.3 | 42.3 | 43.7 | 41.7 |
| Years | 1901 | 1902 | 1903 | 1904 | 1905 | 1906 | 1907 | 1908 | 1909 | 1910[31] |
|---|---|---|---|---|---|---|---|---|---|---|
| Life expectancy in Italy | 43.5 | 43.0 | 43.1 | 44.4 | 43.9 | 45.1 | 45.4 | 43.1 | 44.6 | 46.7 |
| Years | 1911 | 1912 | 1913 | 1914 | 1915 | 1916 | 1917 | 1918 | 1919 | 1920[31] |
|---|---|---|---|---|---|---|---|---|---|---|
| Life expectancy in Italy | 44.7 | 48.9 | 48.4 | 49.9 | 42.5 | 39.6 | 38.1 | 25.8 | 42.3 | 45.5 |
| Years | 1921 | 1922 | 1923 | 1924 | 1925 | 1926 | 1927 | 1928 | 1929 | 1930[31] |
|---|---|---|---|---|---|---|---|---|---|---|
| Life expectancy in Italy | 49.2 | 50.0 | 51.4 | 51.5 | 51.3 | 50.9 | 52.5 | 52.6 | 52.3 | 55.2 |
| Years | 1931 | 1932 | 1933 | 1934 | 1935 | 1936 | 1937 | 1938 | 1939 | 1940[31] |
|---|---|---|---|---|---|---|---|---|---|---|
| Life expectancy in Italy | 54.8 | 54.7 | 56.3 | 56.8 | 56.2 | 56.7 | 55.5 | 56.1 | 57.6 | 57.0 |
| Years | 1941 | 1942 | 1943 | 1944 | 1945 | 1946 | 1947 | 1948 | 1949 | 1950[31] |
|---|---|---|---|---|---|---|---|---|---|---|
| Life expectancy in Italy | 54.7 | 52.5 | 49.4 | 52.4 | 54.9 | 59.0 | 61.2 | 63.4 | 64.1 | 65.8 |
1950-2015
| Period | Life expectancy in Years |
Period | Life expectancy in Years |
|---|---|---|---|
| 1950–1955 | 66.5 | 1985–1990 | 76.4 |
| 1955–1960 | 68.4 | 1990–1995 | 77.5 |
| 1960–1965 | 69.7 | 1995–2000 | 78.8 |
| 1965–1970 | 70.9 | 2000–2005 | 80.3 |
| 1970–1975 | 72.2 | 2005–2010 | 81.5 |
| 1975–1980 | 73.6 | 2010–2015 | 82.4 |
| 1980–1985 | 74.9 |
Source: UN World Population Prospects[32]
Total Fertility Rate from 1850 to 1899
The total fertility rate is the number of children born per woman. It is based on fairly good data for the entire period. Sources: Our World In Data and Gapminder Foundation.[33]
| Years | 1850 | 1851 | 1852 | 1853 | 1854 | 1855 | 1856 | 1857 | 1858 | 1859 | 1860[33] |
|---|---|---|---|---|---|---|---|---|---|---|---|
| Total Fertility Rate in Italy | 5.47 | 5.42 | 5.38 | 5.33 | 5.29 | 5.24 | 5.19 | 5.15 | 5.1 | 5.06 | 5.01 |
| Years | 1861 | 1862 | 1863 | 1864 | 1865 | 1866 | 1867 | 1868 | 1869 | 1870[33] |
|---|---|---|---|---|---|---|---|---|---|---|
| Total Fertility Rate in Italy | 4.96 | 4.93 | 4.9 | 4.9 | 4.91 | 4.91 | 4.92 | 4.92 | 4.91 | 4.9 |
| Years | 1871 | 1872 | 1873 | 1874 | 1875 | 1876 | 1877 | 1878 | 1879 | 1880[33] |
|---|---|---|---|---|---|---|---|---|---|---|
| Total Fertility Rate in Italy | 4.9 | 4.89 | 4.88 | 4.89 | 4.9 | 4.9 | 4.91 | 4.92 | 4.95 | 4.98 |
| Years | 1881 | 1882 | 1883 | 1884 | 1885 | 1886 | 1887 | 1888 | 1889 | 1890[33] |
|---|---|---|---|---|---|---|---|---|---|---|
| Total Fertility Rate in Italy | 5 | 5.03 | 5.06 | 5.05 | 5.04 | 5.04 | 5.03 | 5.02 | 4.98 | 4.95 |
| Years | 1891 | 1892 | 1893 | 1894 | 1895 | 1896 | 1897 | 1898 | 1899[33] |
|---|---|---|---|---|---|---|---|---|---|
| Total Fertility Rate in Italy | 4.91 | 4.88 | 4.84 | 4.79 | 4.74 | 4.69 | 4.64 | 4.59 | 4.56 |
Vital statistics since 1900[34][35][36]
| Average population | Live births | Deaths | Natural change | Crude birth rate (per 1,000) | Crude death rate (per 1,000) | Natural change (per 1,000) | Total Fertility Rates[fn 1][33] | |
|---|---|---|---|---|---|---|---|---|
| 1900 | 32,377 000 | 1,067,376 | 768,917 | 298,459 | 33.0 | 23.7 | 9.2 | 4.53 |
| 1901 | 32,550 000 | 1,057,763 | 715,036 | 342,727 | 32.5 | 22.0 | 10.5 | 4.49 |
| 1902 | 32,787 000 | 1,093,074 | 727,181 | 365,893 | 33.3 | 22.2 | 11.2 | 4.46 |
| 1903 | 33,004 000 | 1,042,090 | 736,311 | 305,779 | 31.6 | 22.3 | 9.3 | 4.43 |
| 1904 | 33,237 000 | 1,085,431 | 698,604 | 386,827 | 32.7 | 21.0 | 11.6 | 4.44 |
| 1905 | 33,489 000 | 1,084,518 | 730,340 | 354,178 | 32.4 | 21.8 | 10.6 | 4.45 |
| 1906 | 33,718 000 | 1,070,978 | 696,875 | 374,103 | 31.8 | 20.7 | 11.1 | 4.45 |
| 1907 | 33,952 000 | 1,062,333 | 700,333 | 362,000 | 31.3 | 20.6 | 10.7 | 4.46 |
| 1908 | 34,198 000 | 1,138,813 | 770,054 | 368,759 | 33.3 | 22.5 | 10.8 | 4.47 |
| 1909 | 34,455 000 | 1,115,831 | 738,460 | 377,371 | 32.4 | 21.4 | 11.0 | 4.43 |
| 1910 | 34,751 000 | 1,144,410 | 682,459 | 461,951 | 32.9 | 19.6 | 13.3 | 4.39 |
| 1911 | 35,033 000 | 1,093,545 | 742,811 | 350,734 | 31.2 | 21.2 | 10.0 | 4.36 |
| 1912 | 35,246 000 | 1,133,985 | 635,788 | 498,197 | 32.2 | 18.0 | 14.1 | 4.32 |
| 1913 | 35,351 000 | 1,122,482 | 663,966 | 458,516 | 31.8 | 18.8 | 13.0 | 4.28 |
| 1914 | 35,701 000 | 1,114,091 | 643,355 | 470,736 | 31.2 | 18.0 | 13.2 | 4.04 |
| 1915 | 36,271 000 | 1,109,183 | 809,703 | 299,480 | 30.6 | 22.3 | 8.3 | 3.8 |
| 1916 | 36,481 000 | 881,626 | 854,703 | 26,923 | 24.2 | 23.4 | 0.7 | 3.56 |
| 1917 | 36,343 000 | 691,207 | 948,710 | -257,503 | 19.6 | 26.1 | -6.5 | 3.32 |
| 1918 | 35,922 000 | 640,263 | 1,268,290 | -628,027 | 18.2 | 35.3 | -17.1 | 3.08 |
| 1919 | 35,717 000 | 770,620 | 676,329 | 94,291 | 21.6 | 18.9 | 2.6 | 3.24 |
| 1920 | 35,960 000 | 1,158,041 | 681,749 | 476,292 | 32.2 | 19.0 | 13.2 | 3.41 |
| 1921 | 37,869 000 | 1,118,344 | 670,234 | 448,110 | 30.7 | 17.7 | 13.0 | 3.57 |
| 1922 | 38,196 000 | 1,127,444 | 690,054 | 437,390 | 30.8 | 18.1 | 12.7 | 3.74 |
| 1923 | 38,571 000 | 1,107,505 | 654,827 | 452,678 | 29.9 | 17.0 | 13.0 | 3.9 |
| 1924 | 38,927 000 | 1,124,470 | 663,077 | 461,393 | 28.9 | 17.0 | 11.9 | 3.81 |
| 1925 | 39,265 000 | 1,109,761 | 669,695 | 440,066 | 28.2 | 17.1 | 11.2 | 3.72 |
| 1926 | 39,590 000 | 1,094,587 | 680,274 | 414,313 | 27.7 | 17.2 | 10.5 | 3.64 |
| 1927 | 39,926 000 | 1,093,772 | 639,843 | 453,929 | 27.4 | 16.0 | 11.4 | 3.55 |
| 1928 | 40,281 000 | 1,072,316 | 645,654 | 426,662 | 26.6 | 16.0 | 10.6 | 3.46 |
| 1929 | 40,607 000 | 1,037,700 | 667,223 | 370,477 | 25.6 | 16.4 | 9.1 | 3.42 |
| 1930 | 40,956 000 | 1,092,678 | 576,751 | 515,927 | 26.7 | 14.1 | 12.6 | 3.38 |
| 1931 | 41,339 000 | 1,026,197 | 609,405 | 416,792 | 24.8 | 14.7 | 10.1 | 3.21 |
| 1932 | 41,584 000 | 990,995 | 610,646 | 380,349 | 23.8 | 14.7 | 9.1 | 3.06 |
| 1933 | 41,928 000 | 995,979 | 574,113 | 421,866 | 23.8 | 13.7 | 10.1 | 3.04 |
| 1934 | 42,277 000 | 992,966 | 563,339 | 429,627 | 23.5 | 13.3 | 10.2 | 3.00 |
| 1935 | 42,631 000 | 996,708 | 594,722 | 401,986 | 23.4 | 14.0 | 9.4 | 2.98 |
| 1936 | 42,965 000 | 962,686 | 593,380 | 369,306 | 22.4 | 13.8 | 8.6 | 2.87 |
| 1937 | 43,269 000 | 991,867 | 618,290 | 373,577 | 22.9 | 14.3 | 8.6 | 2.93 |
| 1938 | 43,596 000 | 1,037,180 | 614,988 | 422,192 | 23.8 | 14.1 | 9.7 | 3.05 |
| 1939 | 44,018 000 | 1,040,213 | 591,483 | 448,730 | 23.6 | 13.4 | 10.2 | 3.07 |
| 1940 | 44,467 000 | 1,046,479 | 606,907 | 439,572 | 23.5 | 13.6 | 9.9 | 3.07 |
| 1941 | 44,830 000 | 937,546 | 621,735 | 315,811 | 20.9 | 13.9 | 7.0 | 2.74 |
| 1942 | 45,098 000 | 926,063 | 643,607 | 282,456 | 20.5 | 14.3 | 6.3 | 2.69 |
| 1943 | 44,641 000 | 882,105 | 679,708 | 202,397 | 19.8 | 15.2 | 4.6 | 2.61 |
| 1944 | 44,794 000 | 814,746 | 685,171 | 129,575 | 18.3 | 15.3 | 3.0 | 2.39 |
| 1945 | 44,946 000 | 815,678 | 615,092 | 200,586 | 18.2 | 13.7 | 4.5 | 2.37 |
| 1946 | 45,253 000 | 1,036,098 | 547,952 | 488,146 | 23.0 | 12.1 | 10.9 | 3.01 |
| 1947 | 45,641 000 | 1,011,490 | 524,019 | 487,471 | 22.2 | 11.5 | 10.8 | 2.89 |
| 1948 | 46,381 000 | 1,005,851 | 490,450 | 515,401 | 21.8 | 10.6 | 11.2 | 2.83 |
| 1949 | 46,733 000 | 937,146 | 485,277 | 451,869 | 20.1 | 10.4 | 9.7 | 2.62 |
| 1950 | 47,104 000 | 908,622 | 455,169 | 453,453 | 19.4 | 9.7 | 9.7 | 2,50 |
| 1951 | 47,417 000 | 860,998 | 485,208 | 375,790 | 18.2 | 10.2 | 8.0 | 2,35 |
| 1952 | 47,666 000 | 844,447 | 477,894 | 366,553 | 17.8 | 10.0 | 7.8 | 2.34 |
| 1953 | 47,957 000 | 839,478 | 476,015 | 363,463 | 17.6 | 9.9 | 7.6 | 2.31 |
| 1954 | 48,299 000 | 870,689 | 441,897 | 428,792 | 18.0 | 9.1 | 8.9 | 2.35 |
| 1955 | 48,633 000 | 869,333 | 446,689 | 422,644 | 17.9 | 9.2 | 8.7 | 2.33 |
| 1956 | 48,920 000 | 873,608 | 497,550 | 376,058 | 17.9 | 10.2 | 7.7 | 2.34 |
| 1957 | 49,181 000 | 878,906 | 484,190 | 394,716 | 17.9 | 9.8 | 8.0 | 2.33 |
| 1958 | 49,475 000 | 870,468 | 457,690 | 412,778 | 17.6 | 9.3 | 8.3 | 2.31 |
| 1959 | 49,831 000 | 901,017 | 454,740 | 446,277 | 18.1 | 9.1 | 9.0 | 2.38 |
| 1960 | 50,198 000 | 910,192 | 480,932 | 429,260 | 18.1 | 9.6 | 8.6 | 2.41 |
| 1961 | 50,523 000 | 929,657 | 468,455 | 461,202 | 18.4 | 9.3 | 9.1 | 2.41 |
| 1962 | 50,843 000 | 937,257 | 509,174 | 428,083 | 18.4 | 10.0 | 8.4 | 2.46 |
| 1963 | 51,198 000 | 960,336 | 516,377 | 443,959 | 18.8 | 10.1 | 8.7 | 2.56 |
| 1964 | 51,600 000 | 1,016,120 | 490,050 | 526,070 | 19.7 | 9.5 | 10.2 | 2.70 |
| 1965 | 51,987 000 | 990,458 | 518,008 | 472,450 | 19.1 | 10.0 | 9.1 | 2.66 |
| 1966 | 52,332 000 | 979,940 | 496,281 | 483,659 | 18.7 | 9.5 | 9.2 | 2.63 |
| 1967 | 52,667 000 | 948,772 | 510,122 | 438,650 | 18.0 | 9.7 | 8.3 | 2.54 |
| 1968 | 52,987 000 | 930,172 | 532,571 | 397,601 | 17.6 | 10.1 | 7.5 | 2.49 |
| 1969 | 53,317 000 | 932,466 | 539,129 | 393,337 | 17.5 | 10.1 | 7.4 | 2.51 |
| 1970 | 53,661 000 | 901,472 | 521,096 | 380,376 | 16.8 | 9.7 | 7.1 | 2.43 |
| 1971 | 54,074 000 | 906,182 | 522,654 | 383,528 | 16.8 | 9.7 | 7.9 | 2.41 |
| 1972 | 54,381 000 | 888,203 | 523,828 | 364,375 | 16.3 | 9.6 | 6.7 | 2.36 |
| 1973 | 54,751 000 | 874,546 | 547,487 | 327,059 | 16.0 | 10.0 | 6.0 | 2.34 |
| 1974 | 55,111 000 | 868,882 | 532,052 | 336,830 | 15.8 | 9.7 | 6.1 | 2.33 |
| 1975 | 55,441 000 | 827,852 | 554,346 | 273,506 | 14.9 | 10.0 | 4.9 | 2.21 |
| 1976 | 55,718 000 | 781,638 | 550,565 | 231,073 | 14.0 | 9.9 | 4.1 | 2.11 |
| 1977 | 55,955 000 | 741,103 | 546,694 | 194,409 | 13.2 | 9.8 | 3.5 | 1.97 |
| 1978 | 56,155 000 | 709,043 | 540,671 | 168,372 | 12.6 | 9.6 | 3.0 | 1.87 |
| 1979 | 56,318 000 | 670,221 | 538,352 | 131,869 | 11.9 | 9.6 | 2.3 | 1.76 |
| 1980 | 56,434 000 | 640,401 | 554,510 | 85,891 | 11.3 | 9.8 | 1.5 | 1.68 |
| 1981 | 56,502 000 | 623,103 | 545,291 | 77,812 | 11.0 | 9.7 | 1.4 | 1.60 |
| 1982 | 56,544 000 | 619,097 | 522,332 | 96,765 | 10.9 | 9.2 | 1.7 | 1.60 |
| 1983 | 56,564 000 | 601,928 | 553,568 | 48,360 | 10.6 | 9.8 | 0.8 | 1.54 |
| 1984 | 56,577 000 | 587,871 | 534,676 | 53,195 | 10.4 | 9.5 | 0.9 | 1.48 |
| 1985 | 56,593 000 | 577,345 | 547,436 | 29,909 | 10.2 | 9.7 | 0.5 | 1.45 |
| 1986 | 56,596 000 | 555,445 | 537,453 | 17,992 | 9.8 | 9.5 | 0.3 | 1.37 |
| 1987 | 56,602 000 | 551,539 | 524,999 | 26,540 | 9.8 | 9.3 | 0.5 | 1.35 |
| 1988 | 56,629 000 | 569,698 | 539,426 | 30,272 | 10.1 | 9.5 | 0.5 | 1.38 |
| 1989 | 56,672 000 | 560,688 | 525,960 | 34,728 | 9.8 | 9.3 | 0.5 | 1.35 |
| 1990 | 56,719 000 | 569,255 | 543,708 | 25,547 | 9.9 | 9.5 | 0.5 | 1.36 |
| 1991 | 56,751 000 | 562,787 | 553,833 | 8,954 | 9.9 | 9.8 | 0.2 | 1.33 |
| 1992 | 56,797 000 | 567,841 | 545,038 | 22,803 | 10.1 | 9.6 | 0.5 | 1.31 |
| 1993 | 56,832 000 | 549,484 | 555,043 | -5,559 | 9.7 | 9.8 | -0.0 | 1.26 |
| 1994 | 56,843 000 | 533,050 | 557,513 | -24,463 | 9.4 | 9.8 | -0.4 | 1.22 |
| 1995 | 56,844 000 | 525,609 | 555,203 | -29,594 | 9.3 | 9.8 | -0.5 | 1.19 |
| 1996 | 56,860 000 | 528,103 | 557,756 | -29,653 | 9.4 | 9.8 | -0.4 | 1.22 |
| 1997 | 56,890 000 | 534,462 | 564,679 | -30,217 | 9.5 | 9.9 | -0.4 | 1.23 |
| 1998 | 56,907 000 | 531,548 | 576,911 | -45,363 | 9.4 | 10.1 | -0.8 | 1.21 |
| 1999 | 56,917 000 | 537,242 | 571,356 | -34,114 | 9.4 | 10.0 | -0.6 | 1.23 |
| 2000 | 56,942 000 | 543,039 | 560,241 | -17,202 | 9.5 | 9.8 | -0.3 | 1.26 |
| 2001 | 56,960 000 | 535,264 | 548,227 | -12,963 | 9.4 | 9.6 | -0.2 | 1.25 |
| 2002 | 56,987 000 | 538,198 | 557,393 | -19,195 | 9.4 | 9.8 | -0.3 | 1.27 |
| 2003 | 57,130 000 | 544,063 | 586,468 | -42,405 | 9.4 | 10.2 | -0.8 | 1.29 |
| 2004 | 57,495 000 | 562,599 | 546,658 | 15,941 | 9.7 | 9.4 | 0.3 | 1.31 |
| 2005 | 57,874 000 | 554,022 | 567,304 | -13,282 | 9.5 | 9.7 | -0.2 | 1.33 |
| 2006 | 58,064 000 | 560,010 | 557,892 | 2,118 | 9.6 | 9.5 | 0.1 | 1.37 |
| 2007 | 58,223 000 | 563,933 | 570,801 | -6,868 | 9.5 | 9.7 | -0.2 | 1.40 |
| 2008 | 58,652 000 | 576,659 | 585,126 | -8,467 | 9.6 | 9.8 | -0.2 | 1.45 |
| 2009 | 59,000 000 | 568,857 | 591 663 | -22,806 | 9.5 | 9.8 | -0.3 | 1.45 |
| 2010 | 59,190 000 | 561,944 | 587,488 | -25,544 | 9.3 | 9.7 | -0.4 | 1.46 |
| 2011 | 59,364 000 | 546,585 | 593,402 | -46,817 | 9.1 | 9.7 | -0.6 | 1.44 |
| 2012 | 59,394 000 | 534,186 | 612,883 | -78,697 | 9.0 | 10.3 | -1.3 | 1.42 |
| 2013 | 59,685 000 | 514,308 | 600,744 | -86,436 | 8.6 | 10.1 | -1.5 | 1.39 |
| 2014 | 60,782 000 | 502,596 | 598,364 | -95,768 | 8.4 | 9.8 | -1.4 | 1.37 |
| 2015 | 60,795 000 | 485,780 | 647,571 | -161,791 | 8.1 | 10.7 | -2.6 | 1.35 |
| 2016 | 60,665 000 | 473,438 | 615,261 | -141,823 | 7.8 | 10.0 | -2.2 | 1.34 |
| 2017 | 60,484 000 | 458,151 | 649,061 | -190,910 | 7.7 | 10.7 | -3.0 | 1.44 |
Current natural increase
- Number of births from January–April 2017 =

- Number of births from January–April 2018 =
- Number of deaths from January–April 2017 =

- Number of deaths from January–April 2018 =

- Natural growth from January–April 2017 =
- Natural growth from January–April 2018 =

Demographic statistics
Demographic statistics according to the World Population Review.[38]
- One birth every 1 minute
- One death every 50 seconds
- Net loss of one person every 7 minutes
- One net migrant every 8 minutes
The following demographic statistics are from Italy's Istituto Nazionale di Statistica[39] and Cia World Factbook.[40]
- Population
- 62,137,802 (July 2017 est.)
- 60,674,003 (Jan 2016 est.)
- Age structure
- 0-14 years: 13.65% (male 4,334,457/female 4,146,726)
- 15-24 years:: 9.66% (male 3,008,228/female 2,996,854)
- 25-54 years: 42.16% (male 12,933,634/female 13,265,541)
- 55-64 years: 12.99% (male 3,914,061/female 4,159,859)
- 65 years and over: 21.53% (male 5,758,197/female 7,620,245) (2017 est.)
- 0-14 years: 13.5% (men 4,056,156/women 3,814,070)
- 15-64 years: 66.3% (men 19,530,696/women 18,981,084)
- 65 years and over: 20.2% (men 4,903,762/women 6,840,444) (2010 est.)
- Median age
- total: 45.5 years (2017 est.) Country comparison to the world: 5th
- men: 44.4 years
- women: 46.5 years
- total: 44.2 years (2015 est.)
- men: 43.0 years
- women: 45.3 years (2013 est.)
- Population growth rate
- 0.19% (2017 est.) Country comparison to the world: 183th
- 0.03% (2016 est.)
- Birth rate
- 8.6 births/1,000 population (2017 est.)
- 8.94 births/1,000 population (2013 est.)[41]
- Death rate
- 10.4 deaths/1,000 population (2017 est.)
- 10.01 deaths/1,000 population (2013 est.)
- Net migration rate
- 3.7 migrant(s)/1,000 population (2017 est.) Country comparison to the world: 31st
- 4.47 migrant(s)/1,000 population (2013 est.)
- Life expectancy at birth
- total population: 82.3 years. Country comparison to the world: 15th
- male: 79.6 years
- female: 85.1 years (2017 est.)
- Mother's mean age at first birth
- 30.7 years (2014 est.)
- Total fertility rate
- 1.39 children born/woman (Italian citizens)
- 1.91 children born/woman (Foreign citizens)
- 1.39 children born/woman (total citizens) (2014)[42]
- 1.44 children born/woman (2017 est.) Country comparison to the world: 206th
- Infant mortality rate
- total: 3.3 deaths/1,000 live births. Country comparison to the world: 210th
- men: 3.5 deaths/1,000 live births
- women: 3 deaths/1,000 live births (2017 est.)
- Urbanization
- urban population: 68% of total population (2010)
- rate of urbanization: 0.5% annual rate of change (2010-15 est.)
- Sex ratio
- at birth: 1.06 men(s)/women
- under 15 years: 1.05 men(s)/women
- 15-64 years: 1.02 men(s)/women
- 65 years and over: 0.74 men(s)/women
- total population: 0.93 men(s)/women (2013 est.)
- Maternal mortality rate
- 4 deaths/100,000 live births (2015 est.) Country comparison to the world: 178th
- 4.0 deaths/100,000 live births (2010)
- Health expenditures
- 9.5% of total GDP (2010)
- Physicians density
- 4.24 physicians/1,000 population (2008)
- Hospital bed density
- 3.6 beds/1,000 population (2009)
- HIV/AIDS
- Adult prevalence rate: 0.3% (2009 est.)
- People living with HIV/AIDS: 140,000 (2009 est.)
- Deaths: fewer than 1,000 (2009 est.)
- Obesity – adult prevalence rate
- 19.8% (2008)
- Religions
Christian 80% (overwhelmingly Roman Catholic with very small groups of Jehovah's Witnesses and Protestants), Muslim (about 800,000 to 1 million), atheist and agnostic 20%
- Education expenditure
- 4.7% of total GDP (2008)
- Literacy
- definition: age 15 and over can read and write
- total population: 98.6% (2003 est.)
- Nationality
- noun: Italian(s)
- adjective: Italian
Languages
Italy's official language is Italian. Ethnologue has estimated that there are about 55 million speakers of the language in Italy and a further 6.7 million outside of the country, primarily in the neighboring countries and in the Italian diaspora worldwide.[43]
Italian, adopted by the state after the unification of Italy, is based on the Florentine variety of Tuscan and is somewhat intermediate between the Italo-Dalmatian languages and the Gallo-Romance languages. Its development was also influenced by the Germanic languages of the post-Roman invaders.
Italy has numerous dialects spoken all over the country. However, the establishment of a national education system has led to decrease in variation in the languages spoken across the country. Standardisation was further expanded in the 1950s and 1960s thanks to economic growth and the rise of mass media and television (the state broadcaster RAI helped set a standard Italian).
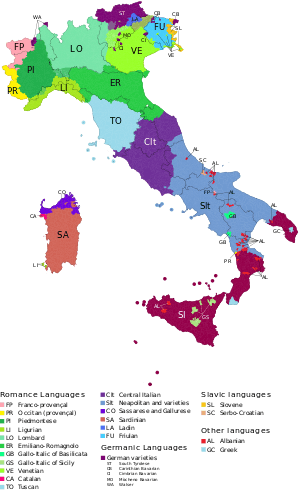
Several minority and regional languages are legally recognized and protected,[44] and they have co-official status alongside Italian in various parts of the country. French is co-official in the Valle d’Aosta—although in fact Franco-Provencal is more commonly spoken there. German has the same status in the province of South Tyrol as, in some parts of that province and in parts of the neighbouring Trentino, does Ladin. Slovene and Friulian are officially recognised in the provinces of Trieste, Gorizia and Udine in Venezia Giulia. Sardinian language was recognized as co-official in Sardinia.
In these regions official documents are bilingual (trilingual in Ladin communities), or available upon request in either Italian or the co-official language. Traffic signs are also multilingual, except in the Valle d’Aosta where—with the exception of Aosta itself which has retained its Latin form in Italian as in English—French toponyms are generally used, attempts to Italianise them during the Fascist period having been abandoned. Education is possible in minority languages where such schools are operating.
UNESCO and other authories recognize many other endangered languages, which are not protected by Italian government: Piedmontese, Venetian, Ligurian, Lombard, Emilian-Romagnolo, Neapolitan and Sicilian.
Religion
Roman Catholicism is by far the largest religion in the country, although the Catholic Church is no longer officially the state religion. In 2006, 87.8% of Italy's population self-identified as Roman Catholic,[46] although only about one-third of these described themselves as active members (36.8%).
Most Italians believe in God, or a form of a spiritual life force. According to the most recent Eurobarometer Poll 2005:[47] 74% of Italian citizens responded that 'they believe there is a God', 16% answered that 'they believe there is some sort of spirit or life force' and 6% answered that 'they do not believe there is any sort of spirit, God, or life force'. There are no data collected through census.
Christianity
The Italian Catholic Church is part of the global Roman Catholic Church, under the leadership of the Pope, curia in Rome, and the Conference of Italian Bishops. In addition to Italy, two other sovereign nations are included in Italian-based dioceses, San Marino and Vatican City. There are 225 dioceses in the Italian Catholic Church, see further in this article and in the article List of the Roman Catholic dioceses in Italy. Even though by law Vatican City is not part of Italy, it is in Rome, and along with Latin, Italian is the most spoken and second language of the Roman Curia.[50]
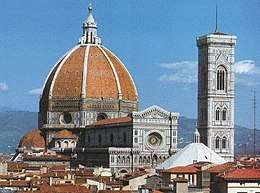
Italy has a rich Catholic culture, especially as numerous Catholic saints, martyrs and popes were Italian themselves. Roman Catholic art in Italy especially flourished during the Middle Ages, Renaissance and Baroque periods, with numerous Italian artists, such as Michelangelo, Leonardo da Vinci, Raphael, Caravaggio, Fra Angelico, Gian Lorenzo Bernini, Sandro Botticelli, Tintoretto, Titian, Raphael and Giotto. Roman Catholic architecture in Italy is equally as rich and impressive, with churches, basilicas and cathedrals such as St Peter's Basilica, Florence Cathedral and St Mark's Basilica. Roman Catholicism is the largest religion and denomination in Italy, with around 87.8% of Italians considering themselves Catholic. Italy is also home to the greatest number of cardinals in the world,[51] and is the country with the greatest number of Roman Catholic churches per capita.[52]
Even though the main Christian denomination in Italy is Roman Catholicism, there are some minorities of Protestant, Waldensian, Eastern Orthodox and other Christian churches.
In the 20th century, Jehovah's Witnesses, Pentecostalism, non-denominational Evangelicalism, and Mormonism were the fastest-growing Protestant churches. Immigration from Western, Central, and Eastern Africa at the beginning of the 21st century has increased the size of Baptist, Anglican, Pentecostal and Evangelical communities in Italy, while immigration from Eastern Europe has produced large Eastern Orthodox communities.
In 2006, Protestants made up 2.1% of Italy's population, and members of Eastern Orthodox churches comprised 1.2% or more than 700,000 Eastern Orthodox Christians including 180,000 Greek Orthodox,[53] 550,000 Pentecostals and Evangelists (0.8%), of whom 400,000 are members of the Assemblies of God, about 250,000 are Jehovah's Witnesses (0.4%),[54] 30,000 Waldensians,[55] 25,000 Seventh-day Adventists, 22,000 Mormons, 15,000 Baptists (plus some 5,000 Free Baptists), 7,000 Lutherans, 4,000 Methodists (affiliated with the Waldensian Church).[56]
Other religions
The longest-established religious faith in Italy is Judaism, Jews having been present in Ancient Rome before the birth of Christ. Italy has seen many influential Italian-Jews, such as Luigi Luzzatti, who took office in 1910, Ernesto Nathan served as mayor of Rome from 1907 to 1913 and Shabbethai Donnolo (died 982). During the Holocaust, Italy took in many Jewish refugees from Nazi Germany. However, with the creation of the Nazi-backed puppet Italian Social Republic, about 15% of 48,000 Italian Jews were killed. This, together with the emigration that preceded and followed the Second World War, has left only a small community of around 45,000 Jews in Italy today.
Due to immigration from around the world, there has been an increase in non-Christian religions. As of 2009, there were 1.0 million Muslims in Italy[57] forming 1.6 percent of population; independent estimates put the Islamic population in Italy anywhere from 0.8 million[58] to 1.5 million.[59] Only 50,000 Italian Muslims hold Italian citizenship.
There are more than 200,000 followers of faith originating in the Indian subcontinent, including some 70,000 Sikhs with 22 gurdwaras across the country,[60] 70,000 Hindus, and 50,000 Buddhists.[61] There are an estimated some 4,900 Bahá'ís in Italy in 2005.[62]
Ethnic groups
Italian: 92%, other European (mostly Romanian, Albanian, Ukrainian and others) 5%, North African (mostly Moroccan) 1.5%, others 2.5%.[63]
Historically the ethnicity of the Italian people was mainly made of romanized autochthonous Italics and Gauls, with additions of Germanic populations (like Longobards) and -in very small amounts- of other bordering people (like Slovenes, Austrians, Albanians, etc..).
Genetics
Approximately half of Italian males belong to the Y-DNA haplogroup R1b which is standard amongst most west European populations. According to data found through different sources, samples, and studies by Eurpedia,[64] the percentages of Y-dna haplogroups observed were :
See also
Footnotes
- ↑ In fertility rates, 2.1 and above is a stable population and have been marked blue, 2 and below leads an aging population and the result is that the population reduces.
References
- ↑ .
- ↑ EUROSTAT. "Ageing characterises the demographic perspectives of the European societies - Issue number 72/2008" (PDF). Archived from the original (PDF) on 2 January 2009. Retrieved 28 April 2009.
- ↑ ISTAT. "Crude birth rates, mortality rates and marriage rates 2005-2008" (PDF) (in Italian). Retrieved 10 May 2009.
- ↑ ISTAT. "Average number of children born per woman 2005-2008" (PDF) (in Italian). Retrieved 3 May 2009.
- ↑ "The World Factbook — Central Intelligence Agency". www.cia.gov.
- ↑ OECD. "Competitive Cities in the Global Economy" (PDF). Archived from the original (PDF) on 1 October 2008. Retrieved 30 April 2009.
- ↑ "Causes of the Italian mass emigration". ThinkQuest Library. 15 August 1999. Archived from the original on 10 October 2010. Retrieved 30 October 2010.
- ↑ "Essay on Italian emigration to Eritrea (in Italian)" (PDF). Retrieved 30 October 2010.
- ↑ Libya – Italian colonization. Britannica Online Encyclopedia.
- ↑ Libya cuts ties to mark Italy era.. BBC News. 27 October 2005.
- ↑ Election Opens Old Wounds In Trieste. The New York Times. 6 June 1987.
- ↑ Consulta Nazionale Emigrazione. Progetto ITENETs – “Gli italiani in Brasile”; pp. 11, 19 Archived 12 February 2012 at the Wayback Machine. . Retrieved 10 September 2008.
- ↑ Lee, Adam (3 April 2006). "Unos 20 millones de personas que viven en la Argentina tienen algún grado de descendencia italiana" (in Spanish). Retrieved 27 June 2008.
- ↑ American FactFinder, United States Census Bureau. "U.S Census Bureau – Selected Population Profile in the United States". American FactFinder, United States Census Bureau. Retrieved 2011-05-30.
- ↑ "The Cambridge survey of world migration". Robin Cohen (1995). Cambridge University Press. p. 143. ISBN 0-521-44405-5
- ↑ http://www.correodelorinoco.gob.ve/tema-dia/embajador-italia-caracas-asegura-que-sistema-electoral-venezolano-es-confiable/ "...el diplomático calcula que 5% o 6% de la población venezolana actual tiene origen italiano."
- ↑ Santander Laya-Garrido, Alfonso. Los Italianos forjadores de la nacionalidad y del desarrollo economico en Venezuela. Editorial Vadell. Valencia, 1978
- ↑ "Ethnic origins, 2006 counts, for Uruguay, provinces and territories – 20% sample data".
- ↑ "Ethnic origins, 2006 counts, for Canada, provinces and territories – 20% sample data".
- ↑ "20680-Ancestry by Country of Birth of Parents – Time Series Statistics (2001, 2006 Census Years) – Australia". Australian Bureau of Statistics. 27 June 2007. Archived from the original on 1 October 2007. Retrieved 30 December 2008.
- ↑ "La popolazione straniera residente in Italia nel 2014" (in Italian). National Institute of Statistics (Italy). 12 February 2015. Retrieved 24 April 2015.
- ↑ "La popolazione straniera residente in Italia al 1° gennaio 2009" [The Foreign Population Resident in Italy on 1 January 2009] (PDF) (in Italian). Istat. 8 October 2009. pp. 1–3. Retrieved 27 October 2009.
- ↑ Elisabeth Rosenthal, "Italy cracks down on illegal immigration". The Boston Globe. 16 May 2008.
- ↑ "Milan police in Chinatown clash". BBC News. 13 April 2007.
- ↑ "EUROPE: Home to Roma, And No Place for Them Archived 5 March 2012 at the Wayback Machine.". IPS ipsnews.net.
- ↑ "Balkan Investigative Reporting Network". Birn.eu.com. 08 11 2007. Archived from the original on 29 October 2008. Retrieved 4 November 2008. Check date values in:
|date=(help) - ↑ Mitrica, Mihai Un milion de romani s-au mutat in Italia ("One million Romanians have moved to Italy"). Evenimentul Zilei, 31 October 2005. Visited 11 April 2006.
- ↑ "Italian".
- ↑ "Bilancio demografico nazionale".
- ↑ "www.istat.it/it/archivio/129854". Missing or empty
|url=(help) - 1 2 3 4 5 6 7 8 "Life expectancy". Our World in Data. Retrieved 2018-08-28.
- ↑ "World Population Prospects – Population Division – United Nations". Retrieved 2017-07-15.
- 1 2 3 4 5 6 7 Max Roser (2014), "Total Fertility Rate around the world over the last centuries", Our World In Data, Gapminder Foundation
- ↑ B.R. Mitchell. European historical statistics, 1750-1975.
- ↑ http://unstats.un.org/unsd/demographic/products/dyb/dybsets/1948%20DYB.pdf United nations. Demographic Yearbook 1948
- ↑ Roberto, Vincenzo Patruno, Marina Venturi, Silvestro. "Demo-Geodemo. - Mappe, Popolazione, Statistiche Demografiche dell'ISTAT". demo.istat.it.
- ↑ "Bilancio demografico mensile". Demo Istat. Istat. Retrieved 20 August 2018.
- ↑ "Italy Population 2018", World Population Review
- ↑ "Statistic Yearbook 2011" (PDF). Istituto Nazionale di Statistica. Retrieved 19 December 2011.
- ↑ "The World FactBook - Italy", The World Factbook, July 12, 2018
- ↑ Index Mundi. "Italy Birth Rate". indexmundi.com.
- ↑ "Demographic indicators". www.istat.it. 30 November 2014.
- ↑ Ethnologue report for language code:ita (Italy) - Gordon, Raymond G., Jr. (ed.), 2005. Ethnologue: Languages of the World, Fifteenth edition. Dallas, Tex.: SIL International. Online version
- ↑ [L.cost. 26 febbraio 1948, n. 4, Statuto speciale per la Valle d'Aosta; L.cost. 26 febbraio 1948, n. 5, Statuto speciale per il Trentino-Alto Adige; L.cost. 31 gennaio 1963, n. 1, Statuto speciale della Regione Friuli Venezia Giulia]
- ↑ "The Global Religious Landscape" (PDF). Pewforum.org. Retrieved 2 October 2015.
- ↑ "Italy: 88% of Italy's population declare themselves Catholic" (in Italian). Corriere della Sera. 18 January 2006. Retrieved 10 May 2009.
- ↑ ReportDGResearchSocialValuesEN2.PDF Archived 24 May 2006 at the Wayback Machine.
- ↑ "The Duomo of Florence | Tripleman". www.tripleman.com. Retrieved 2010-03-25.
- ↑ "brunelleschi's dome - Brunelleschi's Dome". Brunelleschisdome.com. Retrieved 2010-03-25.
- ↑ "Country profile: Vatican". BBC News. 26 October 2009. Retrieved 5 May 2010.
- ↑ Miranda, Salvador. "The Cardinals of the Holy Roman Church - Living cardinals arranged by country". www.fiu.edu.
- ↑ "Italy - Italian Language, Culture, Customs and Business Etiquette". Kwintessential.co.uk. Retrieved 2010-08-02.
- ↑ The Holy Orthodox Archdiocese of Italy and Malta Archived 5 March 2009 at the Wayback Machine.
- ↑ 2015 Yearbook of Jehovah's Witnesses. Watch Tower Society. p. 182.
- ↑ (in Italian) Waldensian Evangelical Church Archived 11 February 2006 at the Wayback Machine.
- ↑ World Council of Churches Archived 25 March 2013 at the Wayback Machine.
- ↑ "Italy: Country's muslims raise funds to help quake victims - Adnkronos Religion". www.adnkronos.com.
- ↑ "Muslims in Europe: Country guide". BBC News. 23 December 2005. Retrieved 5 May 2010.
- ↑ Rosenthal, Elisabeth (25 July 2005). "Pressure is growingon Muslims in Italy". The New York Times. Retrieved 31 March 2010.
- ↑ "NRI Sikhs in Italy". www.nriinternet.com.
- ↑ Unione Buddhista Italiana - UBI: L'Ente Archived 4 April 2007 at the Wayback Machine.
- ↑ "Most Baha'i Nations (2005)". QuickLists > Compare Nations > Religions >. The Association of Religion Data Archives. 2005. Retrieved 2010-01-30.
- ↑ "Statistiche demografiche ISTAT". www.demo.istat.it.
- ↑ Maciamo. "European Y-DNA haplogroups frequencies by country". Eupedia.
External links
| Wikimedia Commons has media related to Demographics of Italy. |
- Demographic page
- Demographic Profile Italy Allianz Knowledge
See Also: Immigration to Italy Template |
| History |
|  | ||||
|---|---|---|---|---|---|---|
| Geography | ||||||
| Politics | ||||||
| Economy | ||||||
| Society |
| |||||