Demographics of Kuwait

This article is about the demographic features of the population of Kuwait.
Expatriates account for around 70% of Kuwait's total population, with Kuwaitis constituting 28%-32% of the total population. The government and Kuwaiti citizens consider the proportion of expatriates (which has been relatively stable since the mid-1970s) to be a problem, and in 2016 the number of deportations increased.[1]Kuwait consists of six governorates: Hawalli, Asimah (Capital), Farwaniyah, Jahra, Ahmadi and Mubarak Al-Kabeer.
Governorates
Kuwait consists of six governorates: Hawalli, Asimah, Farwaniyah, Jahra, Ahmadi and Mubarak Al-Kabeer.[2] Most Kuwaitis live in the governorates of Hawalli, Asimah and Farwaniyah.[2]
Historical populations
| Historical population | ||
|---|---|---|
| Year | Pop. | ±% |
| 1950 | 152,000 | — |
| 1960 | 264,000 | +73.7% |
| 1970 | 753,000 | +185.2% |
| 1980 | 1,377,000 | +82.9% |
| 1990 | 2,088,000 | +51.6% |
| 2000 | 1,941,000 | −7.0% |
| 2010 | 2,737,000 | +41.0% |
| Source:[3] | ||
| census year | Kuwaiti | non-Kuwaiti | Total | Change | ||||
|---|---|---|---|---|---|---|---|---|
| Number | % | Number | % | Number | % | |||
| 1975 | 307,755 | 30.9 | 687,082 | 69 | 994,837 | - | ||
| 1985 | 470,473 | 35 | 1,226,828 | 65 | 1,697,301 | 70.6 | ||
| 1995 | 653,616 | 41.5 | 921,954 | 58.5 | 1,575,570 | -7.2 | ||
| 2005 | 860,324 | 39.2 | 1,333,327 | 60.8 | 2,193,651 | 39.2 | ||
| 2011 | 1,089,969 | 36 | 1,975,881 | 64 | 3,065,850 | 39.8 | ||
| 2013 | 1,403,962 | 33 | 2,291,354 | 67 | 3,695,316 | 20 | ||
The biggest population difficulty in Kuwait involves the Bedoon, a stateless people numbering just over 100,000 who are classed as illegal residents and who are trying to claim Kuwaiti citizenship.[4] Critics argue that these people are Arabs who migrated from Iraq, Syria and Saudi Arabia; a large part of the problem the Bedoon face is that these other states do not consider them as their nationals either.[5] In 2013, a law was passed to grant citizenship to 4,000 of these people as part of an attempt to resolve the problem. However, the government has said that only a third of the Bedoon would qualify for possible naturalization as it considers that the rest hold other nationalities, with officials alleging that they have destroyed their documents in order to claim Kuwaiti citizenship.[4]
Vital statistics
- UN estimates
| Period | Live births per year | Deaths per year | Natural change per year | CBR* | CDR* | NC* | TFR* | IMR* |
|---|---|---|---|---|---|---|---|---|
| 1950-1955 | 8 000 | 2 000 | 6 000 | 43.7 | 12.3 | 31.4 | 7.21 | 113 |
| 1955-1960 | 9 000 | 2 000 | 7 000 | 40.0 | 9.6 | 30.4 | 7.21 | 90 |
| 1960-1965 | 16 000 | 3 000 | 13 000 | 43.4 | 7.6 | 35.8 | 7.31 | 70 |
| 1965-1970 | 30 000 | 4 000 | 26 000 | 48.8 | 6.3 | 42.5 | 7.41 | 53 |
| 1970-1975 | 43 000 | 5 000 | 38 000 | 47.6 | 5.2 | 42.4 | 6.90 | 40 |
| 1975-1980 | 49 000 | 5 000 | 44 000 | 40.7 | 4.2 | 36.5 | 5.89 | 29 |
| 1980-1985 | 58 000 | 5 000 | 52 000 | 37.1 | 3.4 | 33.6 | 5.10 | 22 |
| 1985-1990 | 51 000 | 5 000 | 45 000 | 26.5 | 2.8 | 23.7 | 3.34 | 16 |
| 1990-1995 | 33 000 | 5 000 | 28 000 | 18.0 | 2.7 | 15.3 | 2.20 | 13 |
| 1995-2000 | 43 000 | 5 000 | 38 000 | 24.1 | 3.0 | 21.1 | 2.93 | 11 |
| 2000-2005 | 39 000 | 6 000 | 32 000 | 18.5 | 3.1 | 15.4 | 2.24 | 10 |
| 2005-2010 | 47 000 | 8 000 | 39 000 | 18.7 | 3.1 | 15.6 | 2.32 | 8 |
| * CBR = crude birth rate (per 1000); CDR = crude death rate (per 1000); NC = natural change (per 1000); IMR = infant mortality rate per 1000 births; TFR = total fertility rate (number of children per woman) | ||||||||
- Registered births and deaths
| Average population (x 1000) | Live births | Deaths | Natural change | Crude birth rate (per 1000) | Crude death rate (per 1000) | Natural change (per 1000) | TFR | |
|---|---|---|---|---|---|---|---|---|
| 1961 | 296 | 12 942 | 2 504 | 10 438 | 43.7 | 8.4 | 35.2 | |
| 1962 | 337 | 15 204 | 2 180 | 13 024 | 45.1 | 6.5 | 38.6 | |
| 1963 | 384 | 17 397 | 2 139 | 15 258 | 45.4 | 5.6 | 39.8 | |
| 1964 | 433 | 19 428 | 2 618 | 16 810 | 44.8 | 6.0 | 38.8 | |
| 1965 | 484 | 21 950 | 2 454 | 19 496 | 45.3 | 5.1 | 40.3 | |
| 1966 | 536 | 23 732 | 2 813 | 20 919 | 44.3 | 5.3 | 39.0 | |
| 1967 | 588 | 28 334 | 3 111 | 25 223 | 48.2 | 5.3 | 42.9 | |
| 1968 | 642 | 33 026 | 3 346 | 29 680 | 51.5 | 5.2 | 46.3 | |
| 1969 | 697 | 35 135 | 3 378 | 31 757 | 50.4 | 4.8 | 45.6 | |
| 1970 | 753 | 33 842 | 3 735 | 30 107 | 44.9 | 5.0 | 40.0 | |
| 1971 | 811 | 35 558 | 3 832 | 31 726 | 43.8 | 4.7 | 39.1 | |
| 1972 | 870 | 37 688 | 4 149 | 33 539 | 43.3 | 4.8 | 38.5 | |
| 1973 | 931 | 40 165 | 4 601 | 35 564 | 43.2 | 4.9 | 38.2 | |
| 1974 | 992 | 41 060 | 4 693 | 36 367 | 41.4 | 4.7 | 36.7 | |
| 1975 | 1 054 | 42 861 | 4 778 | 38 083 | 40.7 | 4.5 | 36.1 | |
| 1976 | 1 116 | 46 039 | 4 661 | 41 378 | 41.3 | 4.2 | 37.1 | |
| 1977 | 1 179 | 46 864 | 5 365 | 41 499 | 39.8 | 4.6 | 35.2 | |
| 1978 | 1 243 | 48 010 | 4 936 | 43 074 | 38.6 | 4.0 | 34.7 | |
| 1979 | 1 309 | 48 273 | 5 028 | 43 245 | 36.9 | 3.8 | 33.0 | |
| 1980 | 1 377 | 51 090 | 4 932 | 46 158 | 37.1 | 3.6 | 33.5 | |
| 1981 | 1 446 | 52 041 | 4 678 | 47 363 | 36.0 | 3.2 | 32.8 | |
| 1982 | 1 514 | 54 257 | 4 992 | 49 265 | 35.8 | 3.3 | 32.5 | |
| 1983 | 1 584 | 55 617 | 4 654 | 50 963 | 35.1 | 2.9 | 32.2 | |
| 1984 | 1 660 | 56 776 | 4 544 | 52 232 | 34.2 | 2.7 | 31.5 | |
| 1985 | 1 742 | 55 087 | 4 711 | 50 376 | 31.6 | 2.7 | 28.9 | |
| 1986 | 1 836 | 53 845 | 4 390 | 49 455 | 29.3 | 2.4 | 26.9 | |
| 1987 | 1 937 | 52 412 | 4 113 | 48 299 | 27.1 | 2.1 | 24.9 | |
| 1988 | 2 028 | 53 080 | 4 581 | 48 499 | 26.2 | 2.3 | 23.9 | |
| 1989 | 2 084 | 52 858 | 4 628 | 48 230 | 25.4 | 2.2 | 23.1 | |
| 1990 | 2 088 | |||||||
| 1991 | 2 031 | 20 609 | 3 380 | 17 229 | 10.1 | 1.7 | 8.5 | |
| 1992 | 1 924 | 34 817 | 3 369 | 31 448 | 18.1 | 1.8 | 16.3 | |
| 1993 | 1 796 | 37 379 | 3 441 | 33 938 | 20.8 | 1.9 | 18.9 | |
| 1994 | 1 688 | 38 868 | 3 464 | 35 404 | 23.0 | 2.1 | 21.0 | |
| 1995 | 1 628 | 41 169 | 3 781 | 37 388 | 25.3 | 2.3 | 23.0 | |
| 1996 | 1 628 | 44 620 | 3 812 | 40 808 | 27.4 | 2.3 | 25.1 | |
| 1997 | 1 679 | 42 815 | 4 017 | 38 798 | 25.5 | 2.4 | 23.1 | |
| 1998 | 1 764 | 41 424 | 4 216 | 37 208 | 23.5 | 2.4 | 21.1 | |
| 1999 | 1 857 | 41 135 | 4 187 | 36 948 | 22.1 | 2.3 | 19.9 | |
| 2000 | 1 941 | 41 843 | 4 227 | 37 616 | 21.6 | 2.2 | 19.4 | |
| 2001 | 2 010 | 41 342 | 4 364 | 36 978 | 20.6 | 2.2 | 18.4 | |
| 2002 | 2 070 | 43 490 | 4 342 | 39 148 | 21.0 | 2.1 | 18.9 | |
| 2003 | 2 127 | 43 982 | 4 424 | 39 558 | 20.7 | 2.1 | 18.6 | |
| 2004 | 2 189 | 47 274 | 4 793 | 42 481 | 21.6 | 2.2 | 19.4 | |
| 2005 | 2 264 | 50 941 | 4 784 | 46 157 | 22.5 | 2.1 | 20.4 | |
| 2006 | 2 351 | 52 759 | 5 247 | 47 512 | 22.4 | 2.2 | 20.2 | |
| 2007 | 2 448 | 53 587 | 5 293 | 48 294 | 21.9 | 2.2 | 19.7 | |
| 2008 | 2 548 | 54 571 | 5 701 | 48 870 | 21.4 | 2.2 | 19.2 | |
| 2009 | 2 778 | 56 503 | 6 266 | 50 237 | 20.3 | 2.3 | 18.1 | |
| 2010 | 2 933 | 57 533 | 5 448 | 52 085 | 19.6 | 1.9 | 17.8 | |
| 2011 | 3 099 | 58 198 | 5 339 | 52 859 | 18.7 | 1.7 | 17.0 | 1.95 |
| 2012 | 59 753 | 5 950 | 53 803 | 18.4 | 1.8 | 16.6 | 1.86 | |
| 2013 | 59 426 | 5 909 | 53 517 | 17.3 | 1.7 | 15.6 | 1.72 | |
| 2014 | 61 313 | 6 031 | 55 282 | 16.3 | 1.6 | 14.7 | 1.90 | |
| 2015 | 59 271 | 6 481 | 52 790 | 14.9 | 1.6 | 13.3 | ||
| 2016 | 58 797 | 6 338 | 52 459 | 14.4 | 1.5 | 12.9 | 1.47 |
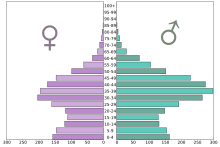
Structure of the population [9]
Structure of the population (10.04.2011) (Census - provisional) :
| Age Group | Male | Female | Total | % |
|---|---|---|---|---|
| Total | 1 738 372 | 1 327 478 | 3 065 850 | 100 |
| 0-4 | 138 688 | 128 265 | 266 953 | 8,71 |
| 5-9 | 116 278 | 109 797 | 226 075 | 7,37 |
| 10-14 | 104 034 | 98 101 | 202 135 | 6,59 |
| 15-19 | 96 131 | 87 401 | 183 532 | 5,99 |
| 20-24 | 132 661 | 128 040 | 260 701 | 8,50 |
| 25-29 | 219 431 | 173 309 | 392 740 | 12,81 |
| 30-34 | 249 945 | 159 492 | 409 437 | 13,35 |
| 35-39 | 201 460 | 133 526 | 334 986 | 10,93 |
| 40-44 | 170 762 | 108 085 | 278 847 | 9,10 |
| 45-49 | 121 610 | 76 804 | 198 414 | 6,47 |
| 50-54 | 83 022 | 48 509 | 131 531 | 4,29 |
| 55-59 | 49 821 | 30 238 | 80 059 | 2,61 |
| 60-64 | 25 262 | 18 688 | 43 950 | 1,43 |
| 65+ | 29 267 | 27 223 | 56 490 | 1,84 |
| Age group | Male | Female | Total | Percent |
|---|---|---|---|---|
| 0-14 | 359 000 | 336 163 | 695 163 | 22,67 |
| 15-64 | 1 350 105 | 964 092 | 2 314 197 | 75,48 |
| 65+ | 29 267 | 27 223 | 56 490 | 1,84 |
Life expectancy
| Period | Life expectancy in Years |
Period | Life expectancy in Years |
|---|---|---|---|
| 1950–1955 | 53.6 | 1985–1990 | 71.6 |
| 1955–1960 | 58.3 | 1990–1995 | 72.4 |
| 1960–1965 | 62.0 | 1995–2000 | 73.0 |
| 1965–1970 | 64.9 | 2000–2005 | 73.3 |
| 1970–1975 | 67.1 | 2005–2010 | 73.7 |
| 1975–1980 | 68.7 | 2010–2015 | 74.3 |
| 1980–1985 | 70.3 |
Source: UN World Population Prospects[10]
CIA World Factbook demographic statistics
The following demographic statistics are from the CIA World Factbook, unless otherwise indicated.
- Age structure
- 0–14 years: 25.8% (male 348,816; female 321,565)
- 15–64 years: 72.2% (male 1,153,433; female 720,392)
- 65 years and over: 2% (male 25,443; female 25,979) (2011 est.)
- Population growth rate
- 1.986% (2011 est.)
- Gender ratio
- at birth: 1.047 male(s)/female
- under 15 years: 1.04 male(s)/female
- 15–64 years: 1.79 male(s)/female
- 65 years and over: 1.65 male(s)/female
- total population: 1.54 male(s)/female (2011 est.)
- Life expectancy at birth
- total population: 77.09 years
- male: 75.95 years
- female: 78.3 years (2011 est.)
- Total fertility rate
- 2.64 children born/woman (2011 est.)
- Nationality
- noun: Kuwaiti(s)
- adjective: Kuwaiti
- Ethnic groups )[11]
- Kuwaiti 28%, other Arab 27.9%, Asian(mostly south) 37.8%, African 1.9%, other 1.1% (includes European, North American, South American, and Australian) (2013 est.)
- Languages[11]
- Religions[11]
- Muslim (official) 76.7%
- Christian 17.3%
- Other and Unspecified 5.9%
- Literacy
- definition: age 15 and over can read and write
- total population: 94%
See also
References
- ↑ http://www.thenational.ae/world/middle-east/kuwait-steps-up-deportations-of-expat-workers
- 1 2 "2013 Population Census". Government of Kuwait. 2013.
- ↑ World Population Prospects: The 2010 Revision Archived February 28, 2013, at the Wayback Machine.
- 1 2 "Kuwait MPs pass law to naturalise 4,000 stateless Bidun". BBC News. 20 March 2013.
- ↑ "Stateless in Kuwait: Who Are the Bidoon?". Open Society Foundations. 24 March 2011.
- ↑ World Population Prospects: The 2010 Revision
- ↑ United nations. Demographic Yearbooks
- ↑ Central Statistical Bureau
- ↑ http://unstats.un.org/unsd/demographic/products/dyb/dyb2.htm
- ↑ "World Population Prospects – Population Division – United Nations". Retrieved 2017-07-15.
- 1 2 3 "Middle East ::KUWAIT". CIA The World Factbook.
| Religions | |
|---|---|
| Foreign nationals | |
| From Asia | ||
|---|---|---|