Demographics of Norway

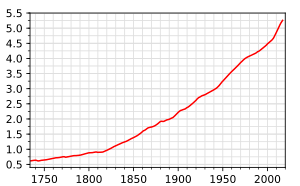
| Historical population | ||
|---|---|---|
| Year | Pop. | ±% |
| 1 | 100,000 | — |
| 1000 | 450,000 | +350.0% |
| 1500 | 250,000 | −44.4% |
| 1665 | 440,000 | +76.0% |
| 1769 | 723,618 | +64.5% |
| 1801 | 883,603 | +22.1% |
| 1825 | 1,051,318 | +19.0% |
| 1835 | 1,194,827 | +13.7% |
| 1855 | 1,490,047 | +24.7% |
| 1875 | 1,813,424 | +21.7% |
| 1885 | 1,951,429 | +7.6% |
| 1895 | 2,097,328 | +7.5% |
| 1900 | 2,242,995 | +6.9% |
| 1910 | 2,390,402 | +6.6% |
| 1920 | 2,653,024 | +11.0% |
| 1930 | 2,815,164 | +6.1% |
| 1940 | 2,982,224 | +5.9% |
| 1950 | 3,280,296 | +10.0% |
| 1960 | 3,594,771 | +9.6% |
| 1970 | 3,888,305 | +8.2% |
| 1980 | 4,092,340 | +5.2% |
| 1990 | 4,249,830 | +3.8% |
| 2000 | 4,478,497 | +5.4% |
| 2010 | 4,858,199 | +8.5% |
| 2018 | 5,295,619 | +9.0% |
| Source: Statistics Norway . | ||
This article is about the demographic features of the population of Norway, including population density, ethnicity, education level, health of the populace, economic status, religious affiliations and other aspects of the population.
Total population
The total population of Norway on 1 January 2018 was 5,295,619.[2] Statistics Norway estimated that the 5,000,000 milestone was reached on 19 March 2012.[3]
Population growth rate in 2017
- Norway: 0.7%
- Northern Norway: 0.3%
- Southern Norway: 1.0%
- Eastern Norway: 0.9%
- Trøndelag: 0.9%
- Western Norway: 0.3%
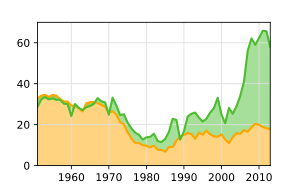
Total Fertility Rate from 1850 to 1899
The total fertility rate is the number of children born per woman. It is based on fairly good data for the entire period. Sources: Our World In Data and Gapminder Foundation.[4]
.jpg)
| Years | 1800 | 1801 | 1802 | 1803 | 1804 | 1805 | 1806 | 1807 | 1808 | 1809 | 1810[4] |
|---|---|---|---|---|---|---|---|---|---|---|---|
| Total Fertility Rate in Norway | 4.32 | 4.07 | 3.91 | 4.2 | 3.94 | 4.33 | 4.39 | 4.27 | 4 | 3.21 | 3.87 |
| Years | 1811 | 1812 | 1813 | 1814 | 1815 | 1816 | 1817 | 1818 | 1819 | 1820[4] |
|---|---|---|---|---|---|---|---|---|---|---|
| Total Fertility Rate in Norway | 3.99 | 4.26 | 3.76 | 3.53 | 4.4 | 5.05 | 4.67 | 4.43 | 4.59 | 4.79 |
| Years | 1821 | 1822 | 1823 | 1824 | 1825 | 1826 | 1827 | 1828 | 1829 | 1830[4] |
|---|---|---|---|---|---|---|---|---|---|---|
| Total Fertility Rate in Norway | 5 | 4.74 | 4.88 | 4.67 | 4.94 | 5.01 | 4.61 | 4.58 | 4.84 | 4.65 |
| Years | 1831 | 1832 | 1833 | 1834 | 1835 | 1836 | 1837 | 1838 | 1839 | 1840[4] |
|---|---|---|---|---|---|---|---|---|---|---|
| Total Fertility Rate in Norway | 4.46 | 4.3 | 4.42 | 4.56 | 4.7 | 4.23 | 4.13 | 4.36 | 3.84 | 4.01 |
| Years | 1841 | 1842 | 1843 | 1844 | 1845 | 1846 | 1847 | 1848 | 1849 | 1850[4] |
|---|---|---|---|---|---|---|---|---|---|---|
| Total Fertility Rate in Norway | 4.29 | 4.42 | 4.34 | 4.31 | 4.49 | 4.4 | 4.43 | 4.28 | 4.61 | 4.45 |
| Years | 1851 | 1852 | 1853 | 1854 | 1855 | 1856 | 1857 | 1858 | 1859 | 1860[4] |
|---|---|---|---|---|---|---|---|---|---|---|
| Total Fertility Rate in Norway | 4.6 | 4.46 | 4.6 | 4.93 | 4.61 | 4.42 | 4.54 | 4.62 | 4.82 | 4.63 |
| Years | 1861 | 1862 | 1863 | 1864 | 1865 | 1866 | 1867 | 1868 | 1869 | 1870[4] |
|---|---|---|---|---|---|---|---|---|---|---|
| Total Fertility Rate in Norway | 4.3 | 4.52 | 4.69 | 4.55 | 4.6 | 4.61 | 4.38 | 4.3 | 4.22 | 4.26 |
| Years | 1871 | 1872 | 1873 | 1874 | 1875 | 1876 | 1877 | 1878 | 1879 | 1880[4] |
|---|---|---|---|---|---|---|---|---|---|---|
| Total Fertility Rate in Norway | 4.29 | 4.4 | 4.41 | 4.59 | 4.67 | 4.68 | 4.69 | 4.64 | 4.71 | 4.53 |
| Years | 1881 | 1882 | 1883 | 1884 | 1885 | 1886 | 1887 | 1888 | 1889 | 1890[4] |
|---|---|---|---|---|---|---|---|---|---|---|
| Total Fertility Rate in Norway | 4.4 | 4.47 | 4.51 | 4.59 | 4.56 | 4.48 | 4.56 | 4.42 | 4.31 | 4.43 |
| Years | 1891 | 1892 | 1893 | 1894 | 1895 | 1896 | 1897 | 1898 | 1899[4] |
|---|---|---|---|---|---|---|---|---|---|
| Total Fertility Rate in Norway | 4.51 | 4.35 | 4.47 | 4.38 | 4.52 | 4.47 | 4.48 | 4.53 | 4.47 |
Vital statistics since 1900
Data according to Statistics Norway, which collects the official statistics for Norway.[5]
| Average population | Live births | Deaths | Natural change | Crude birth rate (per 1000) | Crude death rate (per 1000) | Natural change (per 1000) | Total fertility rates[fn 1][4][6] | |
|---|---|---|---|---|---|---|---|---|
| 1900 | 2 231 000 | 66 229 | 35 345 | 30 884 | 29.7 | 15.8 | 13.8 | 4.4 |
| 1901 | 2 255 000 | 67 303 | 33 821 | 33 482 | 29.8 | 15.0 | 14.8 | 4.37 |
| 1902 | 2 276 000 | 66 494 | 31 670 | 34 824 | 29.2 | 13.9 | 15.3 | 4.26 |
| 1903 | 2 288 000 | 65 470 | 33 847 | 31 623 | 28.6 | 14.8 | 13.8 | 4.16 |
| 1904 | 2 298 000 | 64 143 | 32 895 | 31 248 | 27.9 | 14.3 | 13.6 | 4.07 |
| 1905 | 2 309 000 | 62 601 | 34 050 | 28 551 | 27.1 | 14.7 | 12.4 | 3.95 |
| 1906 | 2 319 000 | 62 091 | 31 668 | 30 423 | 26.8 | 13.7 | 13.1 | 3.92 |
| 1907 | 2 329 000 | 61 302 | 33 345 | 27 957 | 26.3 | 14.3 | 12.0 | 3.87 |
| 1908 | 2 346 000 | 61 686 | 33 366 | 28 320 | 26.3 | 14.2 | 12.1 | 3.87 |
| 1909 | 2 368 000 | 63 324 | 32 111 | 31 213 | 26.7 | 13.6 | 13.2 | 3.96 |
| 1910 | 2 384 000 | 61 486 | 32 207 | 29 279 | 25.8 | 13.5 | 12.3 | 3.82 |
| 1911 | 2 401 000 | 61 727 | 31 691 | 30 036 | 25.7 | 13.2 | 12.5 | 3.8 |
| 1912 | 2 423 000 | 61 409 | 32 663 | 28 746 | 25.3 | 13.5 | 11.9 | 3.72 |
| 1913 | 2 447 000 | 61 294 | 32 442 | 28 852 | 25.0 | 13.3 | 11.8 | 3.64 |
| 1914 | 2 472 000 | 62 111 | 33 280 | 28 831 | 25.1 | 13.5 | 11.7 | 3.62 |
| 1915 | 2 498 000 | 58 975 | 33 425 | 25 550 | 23.6 | 13.4 | 10.2 | 3.37 |
| 1916 | 2 522 000 | 61 120 | 34 910 | 26 210 | 24.2 | 13.8 | 10.4 | 3.43 |
| 1917 | 2 551 000 | 63 969 | 34 699 | 29 270 | 25.1 | 13.6 | 11.5 | 3.53 |
| 1918 | 2 578 000 | 63 468 | 44 218 | 19 250 | 24.6 | 17.2 | 7.5 | 3.44 |
| 1919 | 2 603 000 | 59 486 | 35 821 | 23 665 | 22.9 | 13.8 | 9.1 | 3.17 |
| 1920 | 2 635 000 | 69 326 | 33 634 | 35 692 | 26.3 | 12.8 | 13.5 | 3.61 |
| 1921 | 2 668 000 | 64 610 | 30 698 | 33 912 | 24.2 | 11.5 | 12.7 | 3.31 |
| 1922 | 2 695 000 | 62 908 | 32 484 | 30 424 | 23.3 | 12.1 | 11.3 | 3.18 |
| 1923 | 2 713 000 | 61 731 | 31 543 | 30 188 | 22.8 | 11.6 | 11.1 | 3.09 |
| 1924 | 2 729 000 | 58 021 | 30 850 | 27 171 | 21.3 | 11.3 | 10.0 | 2.85 |
| 1925 | 2 747 000 | 54 066 | 30 481 | 23 585 | 19.7 | 11.1 | 8.6 | 2.61 |
| 1926 | 2 763 000 | 54 163 | 29 933 | 24 230 | 19.6 | 10.8 | 8.8 | 2.59 |
| 1927 | 2 775 000 | 50 175 | 31 141 | 19 034 | 18.1 | 11.2 | 6.9 | 2.38 |
| 1928 | 2 785 000 | 49 881 | 30 301 | 19 580 | 17.9 | 10.9 | 7.0 | 2.34 |
| 1929 | 2 795 000 | 48 372 | 32 023 | 16 349 | 17.3 | 11.5 | 5.8 | 2.23 |
| 1930 | 2 807 000 | 47 844 | 29 616 | 18 228 | 17.0 | 10.5 | 6.5 | 2.19 |
| 1931 | 2 824 000 | 45 989 | 30 674 | 15 315 | 16.3 | 10.9 | 5.4 | 2.07 |
| 1932 | 2 842 000 | 45 451 | 30 102 | 15 349 | 16.0 | 10.6 | 5.4 | 2.04 |
| 1933 | 2 858 000 | 42 114 | 28 943 | 13 171 | 14.7 | 10.1 | 4.6 | 1.86 |
| 1934 | 2 874 000 | 41 833 | 28 340 | 13 493 | 14.6 | 9.9 | 4.7 | 1.82 |
| 1935 | 2 889 000 | 41 321 | 29 747 | 11 574 | 14.3 | 10.3 | 4.0 | 1.78 |
| 1936 | 2 904 000 | 42 240 | 30 100 | 12 140 | 14.5 | 10.4 | 4.2 | 1.84 |
| 1937 | 2 919 000 | 43 808 | 30 217 | 13 591 | 15.0 | 10.4 | 4.7 | 1.84 |
| 1938 | 2 936 000 | 45 319 | 29 211 | 16 108 | 15.4 | 9.9 | 5.5 | 1.88 |
| 1939 | 2 954 000 | 46 603 | 29 870 | 16 733 | 15.8 | 10.1 | 5.7 | 2.00 |
| 1940 | 2 973 000 | 47 943 | 32 045 | 15 898 | 16.1 | 10.8 | 5.3 | 1.95 |
| 1941 | 2 990 000 | 45 773 | 32 209 | 13 564 | 15.3 | 10.8 | 4.5 | 1.83 |
| 1942 | 3 009 000 | 53 225 | 32 062 | 21 163 | 17.7 | 10.7 | 7.0 | 2.11 |
| 1943 | 3 032 000 | 57 281 | 31 623 | 25 658 | 18.9 | 10.4 | 8.5 | 2.26 |
| 1944 | 3 060 000 | 62 241 | 32 652 | 29 589 | 20.3 | 10.7 | 9.7 | 2.45 |
| 1945 | 3 091 000 | 61 814 | 30 030 | 31 784 | 20.0 | 9.7 | 10.3 | 2.43 |
| 1946 | 3 127 000 | 70 727 | 29 220 | 41 507 | 22.6 | 9.3 | 13.3 | 2.77 |
| 1947 | 3 165 000 | 67 625 | 29 894 | 37 731 | 21.4 | 9.4 | 11.9 | 2.66 |
| 1948 | 3 201 000 | 65 618 | 28 375 | 37 243 | 20.5 | 8.9 | 11.6 | 2.62 |
| 1949 | 3 234 000 | 63 052 | 29 082 | 33 970 | 19.5 | 9.0 | 10.5 | 2.52 |
| 1950 | 3 265 000 | 62 410 | 29 699 | 32 711 | 19.1 | 9.1 | 10.0 | 2.46 |
| 1951 | 3 296 000 | 60 571 | 27 736 | 32 835 | 18.4 | 8.4 | 10.0 | 2.47 |
| 1952 | 3 328 000 | 62 543 | 28 417 | 34 126 | 18.8 | 8.5 | 10.3 | 2.58 |
| 1953 | 3 361 000 | 62 985 | 28 412 | 34 573 | 18.7 | 8.5 | 10.3 | 2.64 |
| 1954 | 3 394 000 | 62 739 | 29 158 | 33 581 | 18.5 | 8.6 | 9.9 | 2.67 |
| 1955 | 3 427 000 | 63 552 | 29 099 | 34 453 | 18.5 | 8.5 | 10.1 | 2.76 |
| 1956 | 3 460 000 | 64 171 | 29 981 | 34 190 | 18.5 | 8.7 | 9.9 | 2.83 |
| 1957 | 3 492 000 | 63 063 | 30 560 | 32 503 | 18.1 | 8.8 | 9.3 | 2.83 |
| 1958 | 3 523 000 | 62 985 | 31 645 | 31 340 | 17.9 | 9.0 | 8.9 | 2.86 |
| 1959 | 3 553 000 | 63 005 | 31 761 | 31 244 | 17.7 | 8.9 | 8.8 | 2.88 |
| 1960 | 3 581 000 | 61 880 | 32 543 | 29 337 | 17.3 | 9.1 | 8.2 | 2.85 |
| 1961 | 3 610 000 | 62 555 | 33 313 | 29 242 | 17.3 | 9.2 | 8.1 | 2.91 |
| 1962 | 3 639 000 | 62 254 | 34 318 | 27 936 | 17.1 | 9.4 | 7.7 | 2.89 |
| 1963 | 3 667 000 | 63 290 | 36 850 | 26 440 | 17.3 | 10.0 | 7.2 | 2.91 |
| 1964 | 3 694 000 | 65 570 | 35 171 | 30 399 | 17.8 | 9.5 | 8.2 | 2.95 |
| 1965 | 3 723 000 | 66 277 | 35 317 | 30 960 | 17.8 | 9.5 | 8.3 | 2.89 |
| 1966 | 3 753 000 | 67 061 | 36 010 | 31 051 | 17.9 | 9.6 | 8.3 | 2.86 |
| 1967 | 3 785 000 | 66 779 | 36 216 | 30 563 | 17.6 | 9.6 | 8.1 | 2.82 |
| 1968 | 3 819 000 | 67 350 | 37 668 | 29 682 | 17.6 | 9.9 | 7.8 | 2.76 |
| 1969 | 3 851 000 | 67 746 | 38 994 | 28 752 | 17.6 | 10.1 | 7.5 | 2.70 |
| 1970 | 3 877 000 | 64 551 | 38 723 | 25 828 | 16.6 | 10.0 | 6.7 | 2.61 |
| 1971 | 3 903 000 | 65 550 | 38 981 | 26 569 | 16.8 | 10.0 | 6.8 | 2.51 |
| 1972 | 3 933 000 | 64 260 | 39 375 | 24 885 | 16.3 | 10.0 | 6.3 | 2.37 |
| 1973 | 3 961 000 | 61 208 | 39 958 | 21 250 | 15.5 | 10.1 | 5.4 | 2.28 |
| 1974 | 3 985 000 | 59 603 | 39 464 | 20 139 | 15.0 | 9.9 | 5.1 | 2.15 |
| 1975 | 4 007 000 | 56 345 | 40 061 | 16 284 | 14.1 | 10.0 | 4.1 | 2.00 |
| 1976 | 4 026 000 | 53 474 | 40 216 | 13 258 | 13.3 | 10.0 | 3.3 | 1.88 |
| 1977 | 4 043 000 | 50 877 | 39 824 | 11 053 | 12.6 | 9.9 | 2.7 | 1.77 |
| 1978 | 4 059 000 | 51 749 | 40 682 | 11 067 | 12.7 | 10.0 | 2.7 | 1.79 |
| 1979 | 4 073 000 | 51 580 | 41 632 | 9 948 | 12.7 | 10.2 | 2.4 | 1.77 |
| 1980 | 4 086 000 | 51 039 | 41 340 | 9 699 | 12.5 | 10.1 | 2.4 | 1.74 |
| 1981 | 4 100 000 | 50 708 | 41 893 | 8 815 | 12.4 | 10.2 | 2.2 | 1.69 |
| 1982 | 4 115 000 | 51 245 | 41 454 | 9 791 | 12.5 | 10.1 | 2.4 | 1.70 |
| 1983 | 4 128 000 | 49 937 | 42 224 | 7 713 | 12.1 | 10.2 | 1.9 | 1.67 |
| 1984 | 4 140 000 | 50 274 | 42 528 | 7 746 | 12.1 | 10.3 | 1.9 | 1.66 |
| 1985 | 4 153 000 | 51 134 | 44 372 | 6 762 | 12.3 | 10.7 | 1.6 | 1.68 |
| 1986 | 4 167 000 | 52 514 | 43 560 | 8 954 | 12.6 | 10.5 | 2.1 | 1.71 |
| 1987 | 4 187 000 | 54 027 | 44 959 | 9 068 | 12.9 | 10.7 | 2.2 | 1.80 |
| 1988 | 4 209 000 | 57 526 | 45 354 | 12 172 | 13.7 | 10.8 | 2.9 | 1.84 |
| 1989 | 4 227 000 | 59 303 | 45 173 | 14 130 | 14.0 | 10.7 | 3.3 | 1.88 |
| 1990 | 4 241 000 | 60 939 | 46 021 | 14 918 | 14.4 | 10.9 | 3.5 | 1.93 |
| 1991 | 4 262 000 | 60 808 | 44 923 | 15 885 | 14.3 | 10.5 | 3.7 | 1.92 |
| 1992 | 4 286 000 | 60 109 | 44 731 | 15 378 | 14.0 | 10.4 | 3.6 | 1.88 |
| 1993 | 4 312 000 | 59 678 | 46 597 | 13 081 | 13.8 | 10.8 | 3.0 | 1.86 |
| 1994 | 4 325 000 | 59 200 | 44 076 | 15 124 | 13.7 | 10.2 | 3.5 | 1.85 |
| 1995 | 4 359 000 | 60 292 | 45 190 | 15 102 | 13.8 | 10.4 | 3.5 | 1.85 |
| 1996 | 4 381 000 | 60 927 | 43 860 | 17 067 | 13.9 | 10.0 | 3.9 | 1.88 |
| 1997 | 4 405 000 | 59 801 | 44 595 | 15 206 | 13.6 | 10.1 | 3.5 | 1.87 |
| 1998 | 4 431 000 | 58 130 | 44 045 | 14 085 | 13.1 | 9.9 | 3.2 | 1.81 |
| 1999 | 4 462 000 | 59 191 | 45 139 | 14 052 | 13.3 | 10.1 | 3.1 | 1.85 |
| 2000 | 4 491 000 | 59 229 | 44 225 | 15 004 | 13.2 | 9.8 | 3.3 | 1.84 |
| 2001 | 4 514 000 | 56 674 | 44 153 | 12 521 | 12.6 | 9.8 | 2.8 | 1.78 |
| 2002 | 4 538 000 | 55 445 | 44 711 | 10 734 | 12.2 | 9.9 | 2.4 | 1.75 |
| 2003 | 4 565 000 | 56 496 | 42 788 | 13 708 | 12.4 | 9.4 | 3.0 | 1.80 |
| 2004 | 4 592 000 | 56 959 | 41 635 | 15 324 | 12.4 | 9.1 | 3.3 | 1.83 |
| 2005 | 4 623 000 | 56 756 | 41 232 | 15 524 | 12.3 | 8.9 | 3.4 | 1.80 |
| 2006 | 4 661 000 | 58 545 | 41 068 | 17 477 | 12.6 | 8.8 | 3.7 | 1.90 |
| 2007 | 4 709 000 | 58 459 | 41 954 | 16 505 | 12.4 | 8.9 | 3.5 | 1.88 |
| 2008 | 4 768 000 | 60 497 | 41 712 | 18 785 | 12.7 | 8.7 | 3.9 | 1.96 |
| 2009 | 4 829 000 | 61 807 | 41 449 | 20 358 | 12.8 | 8.6 | 4.2 | 1.98 |
| 2010 | 4 889 000 | 61 442 | 41 500 | 19 942 | 12.6 | 8.5 | 4.1 | 1.95 |
| 2011 | 4 953 000 | 60 220 | 41 393 | 18 827 | 12.1 | 8.3 | 3.8 | 1.88 |
| 2012 | 5 019 000 | 60 255 | 41 992 | 18 263 | 12.0 | 8.4 | 3.6 | 1.85 |
| 2013 | 5 079 000 | 58 995 | 41 282 | 17 713 | 11.7 | 8.1 | 3.6 | 1.78 |
| 2014 | 5 137 000 | 59 084 | 40 394 | 18 690 | 11.5 | 7.9 | 3.6 | 1.76 |
| 2015 | 5 165 000 | 59 058 | 40 727 | 18 331 | 11.4 | 7.9 | 3.5 | 1.73 |
| 2016 | 5 213 000 | 58 890 | 40 726 | 18 164 | 11.3 | 7.8 | 3.5 | 1.71 |
| 2017 | 5 258 000 | 56 633 | 40 774 | 15 859 | 10.8 | 7.8 | 3.0 | 1.62 |
| 2018 | 5 296 000 |
Current natural increase[7]
- Births from January–June 2017 =

- Births from January–June 2018 =
- Deaths from January–June 2017 =

- Deaths from January–June 2018 =
- Natural increase from January–June 2017 =
- Natural increase from January–June 2018 =
Total fertility rate
| County | Fertility rate (2017) |
|---|---|
| Østfold | 1.61 |
| Akershus | 1.68 |
| Oslo | 1.50 |
| Hedmark | 1.59 |
| Oppland | 1.54 |
| Buskerud | 1.62 |
| Vestfold | 1.58 |
| Telemark | 1.53 |
| Aust-Agder | 1.63 |
| Vest-Agder | 1.72 |
| Rogaland | 1.82 |
| Hordaland | 1.67 |
| Sogn og Fjordane | 1.79 |
| Møre og Romsdal | 1.74 |
| Sør-Trøndelag | 1.60 |
| Nord-Trøndelag | 1.74 |
| Nordland | 1.63 |
| Troms | 1.53 |
| Finnmark | 1.62 |
Life expectancy at birth from 1846 to 2015
Sources: Our World In Data and the United Nations.
1543-1950
| Years | 1846 | 1847 | 1848 | 1849 | 1850 | 1851 | 1852 | 1853 | 1854 | 1855 | 1856 | 1857 | 1858 | 1859 | 1860[8] |
|---|---|---|---|---|---|---|---|---|---|---|---|---|---|---|---|
| Life expectancy in Norway | 48.0 | 44.8 | 45.0 | 48.0 | 49.5 | 49.7 | 48.5 | 47.9 | 51.6 | 50.4 | 50.4 | 50.2 | 51.6 | 49.9 | 50.0 |
| Years | 1861 | 1862 | 1863 | 1864 | 1865 | 1866 | 1867 | 1868 | 1869 | 1870[8] |
|---|---|---|---|---|---|---|---|---|---|---|
| Life expectancy in Norway | 45.8 | 44.7 | 46.7 | 48.8 | 50.4 | 49.9 | 47.9 | 47.2 | 49.3 | 50.9 |
| Years | 1871 | 1872 | 1873 | 1874 | 1875 | 1876 | 1877 | 1878 | 1879 | 1880[8] |
|---|---|---|---|---|---|---|---|---|---|---|
| Life expectancy in Norway | 49.7 | 50.0 | 49.7 | 47.8 | 47.6 | 46.8 | 49.7 | 51.8 | 53.1 | 51.9 |
| Years | 1881 | 1882 | 1883 | 1884 | 1885 | 1886 | 1887 | 1888 | 1889 | 1890[8] |
|---|---|---|---|---|---|---|---|---|---|---|
| Life expectancy in Norway | 50.4 | 47.4 | 49.6 | 50.8 | 51.0 | 51.7 | 51.7 | 50.4 | 49.1 | 48.6 |
| Years | 1891 | 1892 | 1893 | 1894 | 1895 | 1896 | 1897 | 1898 | 1899 | 1900[8] |
|---|---|---|---|---|---|---|---|---|---|---|
| Life expectancy in Norway | 49.8 | 49.7 | 51.4 | 50.6 | 52.8 | 53.8 | 53.7 | 54.0 | 51.6 | 53.5 |
| Years | 1901 | 1902 | 1903 | 1904 | 1905 | 1906 | 1907 | 1908 | 1909 | 1910[8] |
|---|---|---|---|---|---|---|---|---|---|---|
| Life expectancy in Norway | 54.6 | 56.5 | 55.0 | 56.1 | 55.1 | 56.9 | 56.5 | 56.3 | 57.5 | 58.0 |
| Years | 1911 | 1912 | 1913 | 1914 | 1915 | 1916 | 1917 | 1918 | 1919 | 1920[8] |
|---|---|---|---|---|---|---|---|---|---|---|
| Life expectancy in Norway | 58.0 | 57.7 | 58.3 | 57.8 | 58.2 | 57.3 | 57.7 | 50.3 | 56.8 | 58.9 |
| Years | 1921 | 1922 | 1923 | 1924 | 1925 | 1926 | 1927 | 1928 | 1929 | 1930[8] |
|---|---|---|---|---|---|---|---|---|---|---|
| Life expectancy in Norway | 61.6 | 60.8 | 61.8 | 62.1 | 62.5 | 63.3 | 62.9 | 63.4 | 62.5 | 64.1 |
| Years | 1931 | 1932 | 1933 | 1934 | 1935 | 1936 | 1937 | 1938 | 1939 | 1940[8] |
|---|---|---|---|---|---|---|---|---|---|---|
| Life expectancy in Norway | 64.1 | 64.6 | 65.5 | 66.2 | 65.8 | 65.8 | 66.0 | 67.1 | 67.4 | 65.9 |
| Years | 1941 | 1942 | 1943 | 1944 | 1945 | 1946 | 1947 | 1948 | 1949 | 1950[8] |
|---|---|---|---|---|---|---|---|---|---|---|
| Life expectancy in Norway | 65.8 | 65.7 | 66.1 | 65.8 | 68.2 | 69.5 | 70.0 | 71.1 | 71.5 | 71.6 |
1950-2015
| Period | Life expectancy in Years |
Period | Life expectancy in Years |
|---|---|---|---|
| 1950–1955 | 72.8 | 1985–1990 | 76.3 |
| 1955–1960 | 73.5 | 1990–1995 | 77.3 |
| 1960–1965 | 73.5 | 1995–2000 | 78.3 |
| 1965–1970 | 73.9 | 2000–2005 | 79.3 |
| 1970–1975 | 74.4 | 2005–2010 | 80.6 |
| 1975–1980 | 75.3 | 2010–2015 | 81.6 |
| 1980–1985 | 76.0 |
Source: UN World Population Prospects[9]
Ethnicity
Ethnically, the residents of Norway are predominantly Norwegians, a North Germanic ethnic group descent. In Northern Norway live the Sami, who claim descent from people who settled the area around 8,000 years ago, probably from continental Europe through the Norwegian coast and through Finland along the inland glaciers. As of 2012, an official government study shows that 86.2% of the total population are ethnic Norwegians.[10] The national minorities of Norway include Scandinavian Romani, Roma, Jews, and Kvener, as well as a small Finnish community.
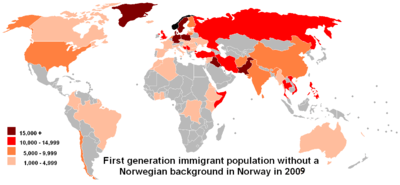
In the last decades, Norway has become home to increasing numbers of immigrants, foreign workers, and asylum-seekers from various parts of the world. Norway had a steady influx of immigrants from South Asia (mostly Pakistanis and Sri Lankans), East Asia (mainly Chinese), and Southeast Asia (e.g. Filipinos), Eastern Europe (e.g. Russians and Poles), Southern Europe (Greeks, Albanians and people from former Yugoslavia etc.), and Middle East countries (especially Iraqis and Palestinians), as well as Somalis, Turks, Moroccans, and some Latin Americans. After ten Eastern European and Baltic countries joined the EU in 2004, there has also been a substantial influx of people from Poland, Estonia, Latvia and Lithuania.
Immigrants constituted 13% of the population at the start of 2015, and an additional 2.6% were born in Norway by immigrant parents[11] (up from 8,3% and 1,5% in 2006[12]). The same year, 19% of births in Norway were to immigrant parents.[11] In 2006, non-Western immigrants constituted 75% of the total number of immigrants. They contribute much of the population growth. Among people of African descent in Oslo, almost 60% are younger than 30, compared to 20% of those of North American background.[12]
As of 2012, an official government study shows that more than 660,000 individuals (13.8%) are migrants and their descendants (110,000 second generation migrants born in Norway).[10]
Of these 660,000 immigrants and their descendants:
- 335,000 (51%)[10] have a Western background (Australia, New Zealand, North America, elsewhere in Europe)
- 325,000 (49%)[10] have a non-Western background.
In 2012, of the total 660 000 with immigrant background, 407,262 had Norwegian citizenship (62.2 percent).[13]
Immigrants were represented in all Norwegian municipalities. The cities or municipalities with the highest share of immigrants in 2012 was Oslo (26 percent) and Drammen (18 percent).[14] The share in Stavanger was 16%.[14] According to Reuters, Oslo is the "fastest growing city in Europe because of increased immigration".[15] In recent years, immigration has accounted for most of Norway's population growth.[12]
| Rank | Country of origin[16] | Population (2018)[17] |
|---|---|---|
| 1. | 110,509 | |
| 2. | 43,930 | |
| 3. | 42,406 | |
| 4. | 38,870 | |
| 5. | 37,412 | |
| 6. | 33,416 | |
| 7. | 29,889 | |
| 8. | 27,542 | |
| 9. | 26,218 | |
| 10. | 23,972 | |
| 11. | 23,065 | |
| 12. | 22,150 | |
| 13. | 21,237 | |
| 14. | 20,990 | |
| 15. | 20,762 |
Genetics of the native people of Norway
Y-chromosome DNA
Y-Chromosome DNA (Y-DNA) represents the male lineage, The Norwegian Y-chromosome pool may be summarized as follows where haplogroups R1 & I comprise generally more than 85% of the total chromosomes.[18]
Mitochondrial DNA
Mitochondrial DNA mtDNA represents the female lineage, Haplogroup H represent about 40% of the Norwegian mitochondrial DNA lineages[19]
Immigration
As of 2012, an official study shows that the quotient of the total population that is either born outside Norway, or has one or two parents born abroad, or has one or more grandparents born abroad is 1,100,000 to 5,017,500 (which equals 21.9%).[20]
About a half million of these, however, identify as ethnic Norwegians who may have, for example, Swedish or Danish ancestors. As of 2012, an official government study shows that 86.2%[10] of the total population are ethnic Norwegians and more than 660,000 individuals (13.8%)[10] are migrants and their descendants (110,000[10] second generation migrants born in Norway).
Of these 660,000 immigrants and their descendants:
- 335,000 (51%)[10] have a Western background (Australia, New Zealand, North America, elsewhere in Europe)
- 325,000 (49%)[10] have a non-Western background.
Other demographic statistics

Norway is an ancient country and it is claimed that as far back as 1665, there were already 440,000 people living here. Despite wars, steady growth through the ages has continued to the point where the Norway population in 2014 now stands at approximately 5,091,246.[21]
Historical landmarks were reached in 1825, when the population of Norway hit 1,051,318 and thereby exceeded one million for the first time in the country’s history and in 1900, the numbers had reached 2,240,032.[21]
Throughout the 20th century, population growth was steady and on a census by census basis, it generally increased in that century by between 3% and 4%.[21]
The following demographic statistics are from the World Population Review.[21]
- One birth every 4 minutes
- One death every 5 minutes
- One net migrant every 11 minutes
- Net gain of one person every 8 minutes
The following demographic statistics are from the CIA World Factbook, unless otherwise indicated.[6]
- Population
- 5,320,045 (July 2017 est.)
- 3,570,554 (1960)
- 2,376,952 (1910)
- 1,583,525 (1860)
- Population - comparative
Slightly greater than British Columbia, but slightly less than Singapore and Eritrea.
- Total fertility rate
- 1.85 children born/woman (2017 est.) Country comparison to the world: 145th
- Median age
- total: 39.2 years Country comparison to the world: 57th
- male: 38.4 years
- female: 40 years (2017 est.)
- total: 39.7 years (2010 est.)
- male: 38.8 years
- female: 40.5 years
- Mother's mean age at first birth
- 28.9 years
Note: data is calculated based on actual age at first births (2015 est.)
- Population growth rate
- 1.01% (2017 est.) Country comparison to the world: 113rd
- Birth rate
- 12.2 births/1,000 population (2017 est.) Country comparison to the world: 164th
- Death rate
- 8.1 deaths/1,000 population (2017 est.)
- Net migration rate
- 5.9 migrant(s)/1,000 population (2017 est.) Country comparison to the world: 17
- Life expectancy at birth
- total population: 81.9 years Country comparison to the world: 18th
- male: 79.8 years
- female: 84 years (2017 est.)
- Infant mortality rate
- total: 2.5 deaths/1,000 live births Country comparison to the world: 221st
- male: 2.8 deaths/1,000 live births
- female: 2.2 deaths/1,000 live births (2017 est.)
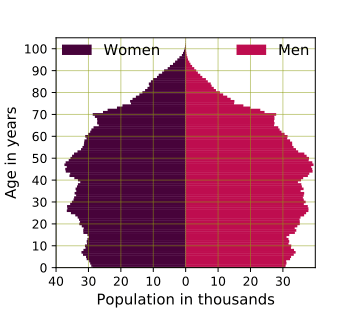
- Age structure
- 0-14 years: 18% (male 490,915/female 466,515) (2017 est.)
- 15-24 years: 12.58% (male 343,103/female 326,053)
- 25-54 years: 41.01% (male 1,125,334/female 1,056,330)
- 55-64 years: 11.71% (male 315,223/female 307,639)
- 65 years and over: 16.71% (male 409,057/female 479,876)
- 0–14 years: 18.8% (male 472,060; female 449,649) (2011 est)
- 15–64 years: 66.2% (male 1,662,852; female 1,593,501)
- 65 years and over: 15.0% (male 325,937; female 416,306)
- 0–14 years: 26.0% (male 476,748; female 452,559) (1960 est)
- 15–64 years: 63.0% (male 1,125,525; female 1,123,206)
- 65 years and over: 11.0% (male 175,485; female 214,184)
- 0–14 years: 35.0% (male 423,253; female 408,204) (1910 est)
- 15–64 years: 57.3% (male 640,835; female 722,443)
- 65 years and over: 7.7% (male 82,312; female 99,905)
- 0–14 years: 35.9% (male 288,510; female 280,249) (1860 est.)
- 15–64 years: 58.0% (male 446,391; female 472,405)
- 65 years and over: 6.1% (male 42,130; female 53,840)
- Ethnic groups
Norwegian 83.2% (includes about 60,000 Sami), other European 8.3%, other 8.5% (2017 est.)
- Languages
Bokmal Norwegian (official), Nynorsk Norwegian (official), small Sami- and Finnish-speaking minorities note: Sami has three dialects: Lule, North Sami, and South Sami; Sami is an official language in nine municipalities in Norway's three northernmost countries: Finnmark, Nordland, and Troms
- Religions
Church of Norway (Evangelical Lutheran - official) 71.5%, Roman Catholic 2.8%, other Christian 3.9%, Muslim 2.8%, other 2%, unspecified 7.5% (2016 est.)
- Dependency ratios
- total dependency ratio: 52.1 (2015 est.)
- youth dependency ratio: 27.3
- elderly dependency ratio: 24.8
- potential support ratio: 4
Note: data include Svalbard and Jan Mayen Islands
- Urbanization
- urban population: 82.2% of total population (2018)
- rate of urbanization: 1.4% annual rate of change (2015-20 est.)
Note: data include Svalbard and Jan Mayen Islands
- School life expectancy (primary to tertiary education)
- total: 18 years
- male: 17 years
- female: 18 years (2015)
- Unemployment, youth ages 15-24
- total: 11.1% Country comparison to the world: 118th
- male: 13%
- female: 9.3% (2016 est.)
- Sex ratio
- at birth: 1.05 male(s)/female (2004 est.)
- under 15 years: 1.05 male(s)/female
- 15–64 years: 1.04 male(s)/female
- 65 years and over: 0.72 male(s)/female
- total population: 0.98 male(s)/female
Religion
The Lutheran Church of Norway is the former state church and the vast majority remain at least nominal members. Other religions do, however, enjoy religious freedom and have prospered with immigration in recent years, particularly Islam and Roman Catholicism. Saint Olaf is the patron saint of Norway. He is regarded by some as the eternal king and has a reputation and place in history unchallenged by any other Norwegian King for the last 1000 years.
| Religion | Members | Percent | As of 2017[22] |
|---|---|---|---|
| Christianity | 4,080,412 | 77.6% | |
| The Church of Norway (Lutheran) | 3,740,920 | 71.1% | |
| Roman Catholicism | 152,022 | 2.9% | |
| Pentecostalism | 39,263 | 0.7% | |
| The Swedish Church in Norway | 9,483 | 0.2% | |
| Eastern Orthodox Christianity | 21,993 | 0.4% | |
| The Free Lutheran Church | 19,469 | 0.4% | |
| Jehovah's Witnesses | 12,479 | 0.2% | |
| The Mission Society | 10,843 | 0.2% | |
| Methodism | 10,432 | 0.2% | |
| Baptists | 10,510 | 0.2% | |
| Other Christianity | 52,998 | 1.0% | |
| Non-Christian religions | 186,811 | 3.6% | |
| Islam | 153,067 | 2.9% | |
| Buddhism | 17,351 | 0.3% | |
| Hinduism | 8,965 | 0.2% | |
| Sikhism | 3,654 | 0.1% | |
| Bahá'í Faith | 1,146 | 0.0% | |
| Judaism | 769 | 0.0% | |
| Other religions | 1,859 | 0.0% | |
| Non-religious and unknown | 898,175 | 17.1% | |
| Humanism | 92,919 | 1.8% | |
| Total | 5,258,317 | 100.0% |
Language
Official languages
Norwegian (the written standards Bokmål and Nynorsk).
Five Uralic languages – Finnish, South Sami, Lule Sami, North Sami and Kven – are additional official languages of some municipalities.
See also
Notes
- ↑ In fertility rates, 2.1 and above is a stable population and have been marked blue, 2 and below leads an aging population and the result is that the population reduces.
References
- 1 2 Data from Statistics Norway table 05803: Population, births, deaths, marriages, migration and population increase. Figures for 1735-1815 and 1838 are taken from Michael Drake: Population and Society in Norway 1735-1865. Before 1816 estimated mean population.
- ↑ Population per 1 January 2013 and population changes in 2012. Counties SSB, retrieved 14 September 2013
- ↑ Nina Berglund: Norwegians now number 5 million Norwegians now number 5 million News in English, 18 March 2012
- 1 2 3 4 5 6 7 8 9 10 11 12 Max Roser (2014), "Total Fertility Rate around the world over the last centuries", Our World In Data, Gapminder Foundation
- ↑ Statistics Norway
- 1 2 "World Factbook EUROPE : NORWAY", The World Factbook, July 12, 2018
- ↑ "Population and population changes". Statistics Norway. Retrieved 18 November 2017.
- 1 2 3 4 5 6 7 8 9 10 "Life expectancy". Our World in Data. Retrieved 2018-08-28.
- ↑ "World Population Prospects – Population Division – United Nations". Retrieved 2017-07-15.
- 1 2 3 4 5 6 7 8 9 "Archived copy". Archived from the original on 6 February 2013. Retrieved 2013-02-06.
- 1 2 Innvandrere og norskfødte med innvandrerforeldre, 1. januar 2015 Statistics Norway, 4 March 2015. Accessed 28 December 2015.
- 1 2 3 Fakta om innvandrebefolkningen i Oslo IMDi-rapport 5A-2007.
- ↑ "Three categories of immigration background, country of birth and citizenship by country background and sex. 1 January 2012 " Archived 20 November 2012 at the Wayback Machine.. Statistics Norway. 26 April 2012. Accessed 27 April 2012. Archived 7 August 2011.
- 1 2 Innvandrere og norskfødte med innvandrerforeldre, 1. januar 2012 Statistics Norway, retrieved 30 March 2013
- ↑ Hare, Sophie. "Factbox – facts about Norway". Reuters. 22 July 2011. Accessed 22 July 2011.
- ↑ Immigrants and Norwegian-born to immigrant parents
- ↑ "Immigrants and Norwegian-born to immigrant parents, 1 January 2018". Statistics Norway (in Norwegian).
- ↑ Helgason et al. 2000, Zerjal et al. 2001, Passarino et al. 2002, Rootsi et al. 2004, Dupuy et al. 2006, Lindqvist et al. 2006
- ↑ Passarino et al. 2002, Loogväli et al. 2004, Tambets et al. 2004, Lappalainen et al. 2006
- ↑ SSB: 1,1 million nordmenn har «innvandrerbakgrunn»
- 1 2 3 4 World Population Review: Norway Population 2018, 14 June 2018
- ↑ Statistics Norway – Church of Norway and other religious and philosophical communities
Norway articles | |||||||
|---|---|---|---|---|---|---|---|
| History |  | ||||||
| Geography | |||||||
| Politics | |||||||
| Economy |
| ||||||
| Society |
| ||||||
| |||||||
| Wikimedia Commons has media related to Demographics of Norway. |