Demographics of Hong Kong
 |
| Demographics and Culture of Hong Kong |
|---|
| Demographics |
| Culture |
| Other Hong Kong topics |
|
|
| Part of a series on |
| Ethnicity in Hong Kong |
|---|
This article is about the demographic features of the population of Hong Kong, including population density, ethnicity, education level, health of the populace, religious affiliations and other aspects of the population.
Hong Kong is one of the most densely populated areas in the world, with an overall density of some 6,300 people per square kilometre.[1] At the same time, Hong Kong has one of the world’s lowest birth rates—1.11 per woman of child-bearing age as of 2012, far below the replacement rate of 2.1. It is estimated that 26.8% of the population will be aged 65 or more in 2033, up from 12.1% in 2005. Hong Kong recorded 8.2 births per 1,000 people in 2005–2010.[2]
Ethnically, Hong Kong mainly consists of Han Chinese who constitute approximately 92% of the population.[3] Of these, many originate from various regions in Canton. There are also a number of descendants of immigrants from elsewhere in Southern China and around the world after the end of World War II.
Terminology
People from Hong Kong generally refer to themselves, in Cantonese, as Hèung Góng Yàhn (Chinese: 香港人; Cantonese Yale: Hèung Góng Yàhn; literally: "Hong Kong people"); however, the term is not restricted to those of Chinese descent, owing to Hong Kong's roughly 160-year colonial history that saw the civil servants and traders of British, Indian, Russian and other ethnic groups stationed in Hong Kong.
In English, the term 'Hong Kongers' (or sometimes 'Hongkongers') is also used to refer to Hong Kongese people, while the term 'Hongkongese' is sometimes used as an adjective to describe people or things related to Hong Kong.[4][5]
Population density
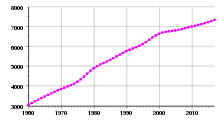
The following census data is available for Hong Kong between the years 1841–2011. In 2011, Hong Kong had a population of just over 7 million, with a density of approximately 6,300 people per square kilometer. This makes Hong Kong the fourth most densely populated region in the world, after Macau, Monaco, and Singapore.[1]
| Historical population | ||
|---|---|---|
| Year | Pop. | ±% p.a. |
| 1841 | 7,450 | — |
| 1851 | 32,983 | +16.04% |
| 1861 | 119,320 | +13.72% |
| 1871 | 120,124 | +0.07% |
| 1881 | 160,402 | +2.93% |
| 1891 | 221,441 | +3.28% |
| 1901 | 368,987 | +5.24% |
| 1911 | 456,739 | +2.16% |
| 1921 | 625,166 | +3.19% |
| 1931 | 840,473 | +3.00% |
| 1941 | 1,640,000 | +6.91% |
| 1945 | 600,000 | −22.23% |
| 1951 | 2,070,000 | +22.92% |
| 1961 | 3,128,648 | +4.22% |
| 1971 | 3,936,630 | +2.32% |
| 1981 | 5,183,400 | +2.79% |
| 1991 | 5,752,000 | +1.05% |
| 2001 | 6,714,300 | +1.56% |
| 2011 | 7,071,600 | +0.52% |
| 2017 | 7,409,800 | +0.78% |
| Sources: Census and Statistics Department,[6][7][8][9] CICRED,[10] Office for National Statistics[11] | ||
Ethnicity
Chinese groups
According to the 2016 by-census, 92% of the Hong Kong population is ethnic Chinese and 8% are other ethnic groups, including a large number of Filipino and Indonesian foreign domestic helpers, making up approximately 4% of the population.[13][14][15] The national census does not categorise Chinese ethnic subgroups. However, the majority of Hong Kongers of Chinese descent trace their ancestry to various parts of Southern China: the Guangzhou area, followed by Siyi (a region of four counties neighboring Guangzhou), Chaoshan (a region of North Guangdong home to Teochew speakers), Fujian and Shanghai.[16] Some Cantonese people also originate from Hakka-speaking villages in the New Territories.[17] Most Teochew-speaking migrants immigrated to Hong Kong from the late 1940s to the early 1970s, while migrants from Fujian province (previously Southern Min speakers, and increasingly more Central Min and Northern Min speakers) have constituted a large-growing number of migrants since 1978.[18] Many Taishanese and Cantonese also migrated after 1949. Currently, the major Chinese groups include the Punti (本地/圍頭), Hakka (客家), Cantonese (廣府, including Toishanese (台山/四邑)), Hoklo (福佬/鶴佬/學佬/閩南),[19] and Tanka (蜑家/水上, lit. boat dwellers).[20] Punti and Tanka are Hong Kong indigenous people, while Cantonese people (including Toishanese) are not Hong Kong indigenous people. For Hakka and Hoklo, they have both indigenous and non-indigenous people in Hong Kong.
Non-Chinese ethnic groups
The following lists ethnic groups with significant presence in Hong Kong in alphabetical order by category:
- East Asia
- Oceania
- Southeast Asia
- Filipinos
- Indonesians (mainly Javanese)
- Thais
Census data
Census data from 2006, 2011, and 2016.[21]
| Ethnic group |
2006 By-census | 2011 Census | 2016 By-census | |||
|---|---|---|---|---|---|---|
| Number | % | Number | % | Number | % | |
| Chinese | 6,522,148 | 95.0 | 6,620,393 | 93.6 | 6,752,202 | 92.0 |
| Filipino | 112,453 | 1.6 | 133,018 | 1.9 | 184,081 | 2.5 |
| Indonesian | 87,840 | 1.3 | 133,377 | 1.9 | 153,299 | 2.1 |
| White | 36,384 | 0.5 | 55,236 | 0.8 | 58,209 | 0.8 |
| Indian | 20,444 | 0.3 | 28,616 | 0.4 | 36,462 | 0.5 |
| Nepalese | 15,950 | 0.2 | 16,518 | 0.2 | 25,472 | 0.3 |
| Pakistani | 11,111 | 0.2 | 18,042 | 0.3 | 18,094 | 0.2 |
| Thai | 11,900 | 0.2 | 11,213 | 0.2 | 10,215 | 0.1 |
| Japanese | 13,189 | 0.2 | 12,580 | 0.2 | 9,976 | 0.1 |
| Other Asian | 12,663 | 0.2 | 12,247 | 0.2 | 19,589 | 0.3 |
| Others | 20,264 | 0.3 | 30,336 | 0.4 | 68,986 | 0.9 |
| Total | 6,864,346 | 7,071,576 | 7,336,585 | |||
Age groups
United Nations data
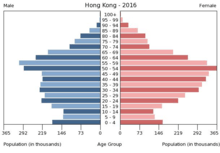
According to United Nations estimates from 1 July 2013, Hong Kong's population is distributed in the following age ranges, with the largest age group represented being 50–54 years:[22]
Population by age group
| Age group | Male | Female | Total | % |
|---|---|---|---|---|
| Total | 3,330,700 | 3,856,800 | 7,187,500 | 100 |
| 0–4 | 134,500 | 125,700 | 260,200 | 3.62 |
| 5–9 | 128,000 | 120,200 | 248,200 | 3.45 |
| 10–14 | 149,100 | 139,600 | 288,700 | 4.02 |
| 15–19 | 208,000 | 196,300 | 404,300 | 5.63 |
| 20–24 | 226,400 | 230,700 | 457,100 | 6.36 |
| 25–29 | 221,800 | 295,800 | 517,600 | 7.20 |
| 30–34 | 231,900 | 343,200 | 575,100 | 8.00 |
| 35–39 | 229,500 | 331,000 | 560,500 | 7.80 |
| 40–44 | 239,800 | 338,700 | 578,500 | 8.05 |
| 45–49 | 271,000 | 337,900 | 608,900 | 8.47 |
| 50–54 | 313,500 | 341,100 | 654,600 | 9.11 |
| 55–59 | 281,300 | 287,900 | 569,200 | 7.92 |
| 60–64 | 220,000 | 223,100 | 443,100 | 6.16 |
| 65–69 | 148,800 | 146,400 | 295,200 | 4.11 |
| 70–74 | 109,600 | 103,700 | 213,300 | 2.97 |
| 75–79 | 100,600 | 109,900 | 210,500 | 2.93 |
| 80–84 | 69,500 | 88,400 | 157,900 | 2.20 |
| 85+ | 47,400 | 97,200 | 144,600 | 2.01 |
Population by wider age groups
| Age group | Male | Female | Total | Percent |
|---|---|---|---|---|
| 0–14 | 411,600 | 385,500 | 797,100 | 11.09 |
| 15–64 | 2,443,200 | 2,925,700 | 5,368,900 | 74.70 |
| 65+ | 475,900 | 545,600 | 1,021,500 | 14.21 |
Hong Kong government data
The Hong Kong government provides the following estimates for mid-2013:[23]
- 0–14 years: 11.0% (male 408,000; female 382,600)
- 15–24 years: 11.7% (male 424,500; female 417,900)
- 25–34 years: 15.2% (male 454,900; female 639,700)
- 35–44 years: 15.9% (male 471,500; female 671,800)
- 45–54 years: 17.7% (male 587,900; female 681,700)
- 55–64 years: 14.2% (male 503,700; female 512,600)
- 65 and over: 14.3% (male 479,500; female 547,700)
Median age: 45.0 (2013 est.)
Sex ratio
According to The World Factbook in 2013, the Hong Kong population was divided into the following male/female ratios:
Male/female ratio by age group
- At birth: 1.07 male(s)/female
- 0–14 years: 1.09 male(s)/female
- 15–24 years: 1.01 male(s)/female
- 25–54 years: 0.88 male(s)/female
- 55–64 years: 1 male(s)/female
- 65 years and over: 0.88 male(s)/female
- Total population: 0.94 male(s)/female
Education level
According to The World Factbook estimates in 2002, 93.5% of the population over the age of 15 had attended schooling, including 96.9% of males and 89.6% of females.
Health and mortality
The following table shows birth rates and mortality rates in Hong Kong between 1950–2015.[24][25][26]
At the end of the 20th century, Hong Kong had one of the lowest birth rates in the world. However, the number of births doubled in the decade between 2001-2011, largely due to an increase in the number of children born in Hong Kong to women with residence in Mainland China. In 2001 there were 7,810 births to Mainland women (16%) out of a total of 48,219 births. This increased to 37,253 births to Mainland women (45%) out of a total of 82,095 births.[27]
Birth and mortality rates
| Average population (× 1,000) | Live births | Deaths | Natural change | Crude birth rate (per 1,000) | Crude death rate (per 1,000) | Natural change (per 1,000) | TFR | |
|---|---|---|---|---|---|---|---|---|
| 1950 | 1,974 | 60,600 | 18,465 | 42,135 | 30.7 | 9.4 | 21.3 | |
| 1951 | 2,044 | 68,500 | 20,580 | 47,920 | 34.0 | 10.2 | 23.8 | |
| 1952 | 2,141 | 71,976 | 19,459 | 52,517 | 33.9 | 9.2 | 24.7 | |
| 1953 | 2,253 | 75,544 | 18,300 | 57,244 | 33.7 | 8.2 | 25.5 | |
| 1954 | 2,371 | 83,317 | 19,283 | 64,034 | 35.2 | 8.2 | 27.1 | |
| 1955 | 2,490 | 90,511 | 19,080 | 71,431 | 36.3 | 7.7 | 28.7 | |
| 1956 | 2,607 | 96,746 | 19,295 | 77,451 | 37.0 | 7.4 | 29.6 | |
| 1957 | 2,721 | 97,834 | 19,365 | 78,469 | 35.8 | 7.1 | 28.7 | |
| 1958 | 2,834 | 106,624 | 20,554 | 86,070 | 37.4 | 7.2 | 30.2 | |
| 1959 | 2,951 | 104,579 | 20,250 | 84,329 | 35.2 | 6.8 | 28.4 | |
| 1960 | 3,075 | 110,667 | 19,146 | 91,521 | 36.1 | 6.2 | 29.9 | 5.014 |
| 1961 | 3,207 | 108,726 | 18,738 | 89,988 | 34.3 | 5.9 | 28.4 | 5.030 |
| 1962 | 3,344 | 119,166 | 20,933 | 98,233 | 36.1 | 6.3 | 29.7 | 4.980 |
| 1963 | 3,477 | 118,413 | 20,340 | 98,073 | 34.6 | 5.9 | 28.7 | 4.857 |
| 1964 | 3,596 | 111,436 | 18,657 | 92,779 | 31.8 | 5.3 | 26.5 | 4.665 |
| 1965 | 3,692 | 106,362 | 18,160 | 88,202 | 29.6 | 5.0 | 24.5 | 4.422 |
| 1966 | 3,763 | 96,436 | 19,261 | 77,175 | 26.6 | 5.3 | 21.3 | 4.152 |
| 1967 | 3,812 | 94,368 | 20,234 | 74,134 | 25.3 | 5.4 | 19.9 | 3.887 |
| 1968 | 3,850 | 83,641 | 19,444 | 64,197 | 22.0 | 5.1 | 16.9 | 3.649 |
| 1969 | 3,889 | 82,482 | 19,256 | 63,226 | 21.3 | 5.0 | 16.4 | 3.448 |
| 1970 | 3,942 | 79,132 | 19,996 | 59,136 | 20.0 | 5.1 | 14.9 | 3.284 |
| 1971 | 4,009 | 79,789 | 20,374 | 59,415 | 19.7 | 5.0 | 14.7 | 3.459 |
| 1972 | 4,088 | 80,344 | 21,397 | 58,947 | 19.5 | 5.2 | 14.3 | 3.315 |
| 1973 | 4,180 | 82,252 | 21,251 | 61,001 | 19.5 | 5.0 | 14.5 | 3.177 |
| 1974 | 4,283 | 83,589 | 21,879 | 61,710 | 19.3 | 5.1 | 14.3 | 2.967 |
| 1975 | 4,396 | 79,790 | 21,591 | 58,168 | 17.9 | 4.9 | 13.0 | 2.666 |
| 1976 | 4,519 | 78,511 | 22,628 | 55,883 | 17.4 | 5.1 | 12.3 | 2.480 |
| 1977 | 4,652 | 80,022 | 23,331 | 56,691 | 17.5 | 5.1 | 12.4 | 2.376 |
| 1978 | 4,788 | 80,957 | 23,816 | 57,141 | 17.3 | 5.1 | 12.2 | 2.272 |
| 1979 | 4,919 | 81,975 | 25,110 | 56,865 | 16.8 | 5.1 | 11.7 | 2.120 |
| 1980 | 5,039 | 85,290 | 24,995 | 60,295 | 17.0 | 4.9 | 12.1 | 2.047 |
| 1981 | 5,145 | 86,751 | 24,822 | 61,929 | 16.8 | 4.8 | 12.0 | 1.933 |
| 1982 | 5,239 | 86,120 | 25,384 | 60,736 | 16.4 | 4.8 | 11.5 | 1.860 |
| 1983 | 5,322 | 83,293 | 26,512 | 56,781 | 15.6 | 5.0 | 10.6 | 1.722 |
| 1984 | 5,394 | 77,297 | 25,510 | 51,787 | 14.4 | 4.7 | 9.7 | 1.559 |
| 1985 | 5,456 | 76,126 | 25,248 | 50,878 | 14.0 | 4.6 | 9.3 | 1.491 |
| 1986 | 5,508 | 71,620 | 25,902 | 45,718 | 13.0 | 4.7 | 8.3 | 1.367 |
| 1987 | 5,551 | 69,958 | 26,916 | 43,042 | 12.6 | 4.8 | 7.8 | 1.311 |
| 1988 | 5,592 | 75,412 | 27,659 | 47,753 | 13.4 | 4.9 | 8.5 | 1.400 |
| 1989 | 5,641 | 69,621 | 28,745 | 40,876 | 12.3 | 5.1 | 7.2 | 1.296 |
| 1990 | 5,704 | 67,731 | 29,136 | 38,595 | 12.0 | 5.1 | 6.9 | 1.272 |
| 1991 | 5,786 | 68,281 | 28,429 | 39,852 | 12.0 | 4.9 | 7.1 | 1.281 |
| 1992 | 5,884 | 70,949 | 30,550 | 40,399 | 12.3 | 5.2 | 7.1 | 1.347 |
| 1993 | 5,992 | 70,451 | 30,571 | 39,880 | 12.0 | 5.1 | 6.9 | 1.342 |
| 1994 | 6,101 | 71,646 | 29,905 | 41,741 | 11.9 | 4.9 | 7.0 | 1.355 |
| 1995 | 6,206 | 68,637 | 31,468 | 37,169 | 11.2 | 5.1 | 6.1 | 1.295 |
| 1996 | 6,304 | 63,291 | 32,176 | 31,115 | 9.9 | 5.1 | 4.8 | 1.191 |
| 1997 | 6,492 | 59,250 | 31,738 | 27,512 | 9.1 | 4.9 | 4.2 | 1.127 |
| 1998 | 6,550 | 52,977 | 32,847 | 20,130 | 8.1 | 5.0 | 3.1 | 1.016 |
| 1999 | 6,611 | 51,281 | 33,255 | 18,026 | 7.8 | 5.0 | 2.7 | 0.981 |
| 2000 | 6,675 | 54,134 | 33,758 | 20,376 | 8.1 | 5.1 | 3.1 | 1.032 |
| 2001 | 6,721 | 48,219 | 33,378 | 14,841 | 7.2 | 5.0 | 2.2 | 0.931 |
| 2002 | 6,728 | 48,209 | 34,267 | 13,942 | 7.1 | 5.1 | 2.0 | 0.941 |
| 2003 | 6,745 | 46,965 | 36,971 | 9,994 | 7.0 | 5.5 | 1.5 | 0.901 |
| 2004 | 6,781 | 49,796 | 36,918 | 12,878 | 7.3 | 5.4 | 1.9 | 0.922 |
| 2005 | 6,818 | 57,098 | 38,830 | 18,268 | 8.4 | 5.7 | 2.7 | 0.959 |
| 2006 | 6,871 | 65,626 | 37,457 | 28,169 | 9.6 | 5.5 | 4.1 | 0.984 |
| 2007 | 6,921 | 70,875 | 39,476 | 31,399 | 10.2 | 5.7 | 4.5 | 1.028 |
| 2008 | 6,951 | 78,822 | 41,796 | 37,026 | 11.3 | 6.0 | 5.3 | 1.064 |
| 2009 | 6,980 | 82,095 | 41,175 | 40,920 | 11.8 | 5.9 | 5.9 | 1.055 |
| 2010 | 7,024 | 88,584 | 42,194 | 46,390 | 12.6 | 6.0 | 6.6 | 1.127 |
| 2011 | 7 072 | 95,451 | 42,346 | 53,105 | 13.5 | 5.9 | 7.6 | 1.204 |
| 2012 | 7,155 | 91,558 | 43,917 | 47,641 | 12.8 | 6.1 | 6.7 | 1.285 |
| 2013 | 7,187 | 57,084 | 43,397 | 13,687 | 7.9 | 6.0 | 1.9 | 1.125 |
| 2014 | 7,242 | 62,305 | 45,087 | 17,218 | 8.6 | 6.2 | 2.4 | 1.235 |
| 2015 | 7,306 | 59,878 | 46,108 | 13,770 | 8.2 | 6.3 | 1.9 | 1.196 |
| 2016 | 7,337 | 60,803 | 46,900 | 13,903 | 8.3 | 6.4 | 1.9 | 1.205 |
| 2017 | 7,410 | 56,890 | 45,883 | 11,007 | 7.7 | 6.3 | 1.4 | 1.126 |
According to The World Factbook in 2013, the infant mortality rate in Hong Kong was 2.89 deaths/1,000 live births.
Life expectancy
According to The World Factbook in 2013, the average life expectancy for the total population was 82.2 years; 79.47 years for males and 85.14 years for females.
Hong Kong is the territory with the worlds highest life expectancy according to the United Nations.
| Period | Life expectancy in Years |
Period | Life expectancy in Years |
|---|---|---|---|
| 1950–1955 | 63.1 | 1985–1990 | 77.0 |
| 1955–1960 | 65.9 | 1990–1995 | 78.1 |
| 1960–1965 | 68.8 | 1995–2000 | 80.0 |
| 1965–1970 | 70.9 | 2000–2005 | 81.4 |
| 1970–1975 | 72.5 | 2005–2010 | 82.4 |
| 1975–1980 | 73.7 | 2010–2015 | 83.4 |
| 1980–1985 | 75.6 |
Source: UN World Population Prospects[28]
Marriage and fertility
According to The World Factbook in 2006, the average marriage age in Hong Kong was 30 years for males and 27 years for females, and the population was subdivided into the following categories:
Marital status
- Married: 57.8% (3,423,995)
- Never married: 32% (1,920,522)
- Divorced: 3.2% (189,563)
- Separated: 0.6% (34,722)
Fertility rate
The World Factbook in 2013 reported that the fertility rate in Hong Kong was 1.11 children born/woman.
Religion
Religion in Hong Kong (2016)[29]
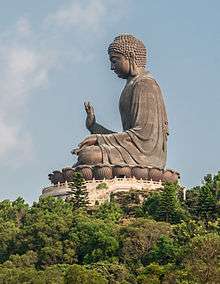
People in Hong Kong follow a diverse range of religions, although most people of Chinese descent follow Taoist, Confucian, or Buddhist faiths; specifically Chinese Buddhism. Another group present are those that follow non-organised Chinese folk religions, which may state that they do not follow a religion. Traditional religions including Chinese Buddhism were discouraged under British rule, which officially represented Christianity.[30] The handover of sovereignty from Britain to China has led to a resurgence of Buddhist and Chinese religions.[30]
| Region | 2008 | 2009 | 2010 | 2011 | 2012 | 2013 | 2016 |
| Buddhists | > 1 million | > 1 million | > 1 million | > 1 million | ≈ 1 million | ≈ 1 million | ≈ 1 million |
| Taoists | ≈ 1 million | ≈ 1 million | ≈ 1 million | ≈ 1 million | > 1 million | > 1 million | > 1 million |
| Protestant | 320,000 | 320,000 | 480,000 | 480,000 | 480,000 | ≈ 500,000 | 500,000 |
| Catholics | 350,000 | 350,000 | 353,000 | 363,000 | 363,000 | 368,000 | 384,000 |
| Muslims | 220,000 | 220,000 | 220,000 | 220,000 | 270,000 | 300,000 | 300,000 |
| Hindu | 40,000 | 40,000 | 40,000 | 40,000 | 40,000 | 40,000 | 100,000 |
| Sikhs | 10,000 | 10,000 | 10,000 | 10,000 | 10,000 | 10,000 | 12,000 |
See also
References
- 1 2 "Population - Overview | Census and Statistics Department". www.censtatd.gov.hk. Retrieved 2016-05-03.
- ↑ glenday, craig (2013). Guinness World Records. p. 121. ISBN 9781908843159.
- ↑ 2016 Population By-census – Summary Results (Report). Census and Statistics Department. February 2016. p. 37. Retrieved 14 March 2017.
- ↑ Poon Angela and Jenny Wong, Struggling for Democracy Under China: The Implications of a Politicised 'Hongkongese' Identity http://www.civic-exchange.org/publications/Intern/2004-JennyandAngela.pdf
- ↑ Sidney Cheung, Hong Kong Handover http://www.umich.edu/~iinet/journal/vol5no1/sidney2.html
- ↑ Census of Hongkong (PDF) (Report). Hongkong Register Office. 31 December 1853. p. 89 – via University of Hong Kong.
- ↑ Hong Kong Statistics 1947-1967 (PDF) (Report). Census and Statistics Department. 1969. p. 14.
- ↑
- Demographic Trends in Hong Kong 1981-2011 (PDF) (Report). Census and Statistics Department. December 2012. p. 8.
- ↑ June 2018. Hong Kong Monthly Digest of Statistics (Report). Census and Statistics Department. June 2018. p. 4.
- ↑ Fan, Shuh Ching (1974). "The Population of Hong Kong" (PDF). World Population Year: 1–2. OCLC 438716102.
- ↑ Census of England and Wales, 1871 (Report). Parliament of the United Kingdom. 30 July 1873. p. 322 – via Google Books.
- ↑ http://www.bycensus2016.gov.hk/en/bc-mt.html. Missing or empty
|title=(help) - ↑ 2011 Population Census – Summary Results (PDF) (Report). Census and Statistics Department. February 2012. p. 37. Retrieved 14 July 2013.
- ↑ http://www.census2011.gov.hk/pdf/EM.pdf#Page=28
- ↑ "Immigration Autonomy". Immigration Department Annual Report 2009-2010. Archived from the original on 23 June 2012. Retrieved 7 July 2012.
- ↑ Ng Sek Hong (2010). Labour Law in Hong Kong. Kluwer Law International. p. 19. ISBN 978-90-411-3307-6.
- ↑ Melvin Ember; Carol R. Ember; Ian Skoggard, eds. (2005). Encyclopedia of diasporas: immigrant and refugee cultures around the world. Diaspora communities. 2. Springer. pp. 94–95. ISBN 978-0-306-48321-9.
- ↑ Hu-DeHart, Evelyn (2006). Voluntary organizations in the Chinese Diaspora. Hong Kong University Press. pp. 122–125. ISBN 978-962-209-776-6.
- ↑ Kelly, Margaret. Fodor's China. Fodor's Travel Publications, 2011. ISBN 0307480534, 9780307480538. p. 392.
- ↑ Ng Lun, Ngai-ha. In: Ring, Trudy, Robert M. Salkin, Sharon La Boda (editors). International Dictionary of Historic Places: Asia and Oceania (Volume 5 of International Dictionary of Historic Places, Trudy Ring, ISBN 1884964052, 9781884964053). Taylor & Francis, 1996. ISBN 1884964044, 9781884964046. p. 358.
- ↑ http://www.bycensus2016.gov.hk/en/bc-mt.html. Missing or empty
|title=(help) - ↑ "United Nations Statistics Division - Demographic and Social Statistics". unstats.un.org. Retrieved 2016-05-03.
- ↑ HK Census. "HK Census." Statistical Table of population. Retrieved on 2007-03-16.
- ↑ B.R. Mitchell. International historical statistics 1750-2005: Africa, Asia and Oceania
- ↑ "United Nations Statistics Division - Demographic and Social Statistics". unstats.un.org. Retrieved 2016-05-03.
- ↑ Census and Statistics Department of the Government of the Hong Kong SAR
- ↑ The fertility trend in Hong Kong 1981-2009
- ↑ "World Population Prospects – Population Division – United Nations". Retrieved 2017-07-15.
- ↑ Hong Kong: The Facts - Religion and Custom HKSAR Government Home Affairs Bureau, May 2016.
- 1 2 Chan, Shun-hing. Leung, Beatrice. [2003] (2003). Changing Church and State Relations in Hong Kong, 1950-2000. Hong Kong: HK university press. Page 24. ISBN 962-209-612-3
- ↑ https://www.yearbook.gov.hk/2016/en/pdf/E21.pdf
External links
- Hong Kong Population History
- HK Facts
- TopNews.in - Baby boom pushes Hong Kong population above 7 million
- Census and Statistics Department - Latest Official HK Population Statistics