Demographics of Ukraine
| Demographics of Ukraine | |
|---|---|
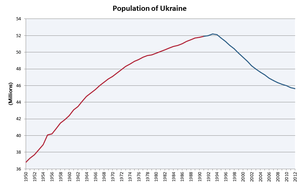 Population of Ukraine (in millions) from 1950-2012. | |
| Population |
42,386,403 |
| Growth rate |
−8.4 |
| Birth rate |
10.3 |
| Death rate |
14.7 |
| Life expectancy |
71.68 years |
| • male |
66.73 |
| • female |
76.46 |
| Fertility rate |
1.47 |
| Infant mortality rate |
7.4 deaths/1,000 |
| Net migration rate | −5.4 migrant(s)/1,000 population (2015) |
| Age structure | |
| 0–14 years |
|
| 15–64 years |
|
| 65 and over |
|
| Sex ratio | |
| At birth | 1.06 male(s)/female |
| Under 15 | 1.06 male(s)/female |
| 15–64 years | 0.92 male(s)/female |
| 65 and over | 0.51 male(s)/female |
| Nationality | |
| Nationality | noun: Ukrainian(s) adjective: Ukrainian |
| Major ethnic | Ukrainians (85.9%) 2015 |
| Minor ethnic | Russians (8.1%) 2015 |
| Language | |
| Official | Ukrainian |
| Spoken | Ukrainian, Russian, others |
The demographics of Ukraine include statistics on population growth, population density, ethnicity, education level, health, economic status, religious affiliations, and other aspects of the population of Ukraine.
The data in this article are based on the 2001 Ukrainian census which is the most recent,[2] the CIA World Factbook, and the State Statistics Committee of Ukraine. The next census is scheduled to take place in 2020.[3][4]
The total population of 42,386,403[1] depicted here excludes the Autonomous Republic of Crimea and Sevastopol which were annexed by Russia in 2014. (The total population including those territories is 44,727,181[5])
Historical data
There were roughly four million Ukrainians at the end of the 17th century.[6] The majority of the historical information is sourced from Demoscope.ru.[7] Please note that territory of modern Ukraine at the times listed above varied greatly. The western regions of Ukraine, west of Zbruch river, until 1939 for most of time were part of the Kingdom of Galicia and later the Polish Republic. The detailed information for those territories is missing, for more information see Demographics of Poland. The Crimean peninsula changed hands as well, in 1897 it was a part of the Taurida Governorate, but after the October Revolution became part of the Russian SFSR, and later was turned under the administration of the Ukrainian SSR.
The territory of Budjak (southern Bessarabia) became a part of the Ukrainian SSR in June 1940. The censuses of 1926 through 1989 were taken in the Ukrainian SSR. The census of 1897 is taken with the correspondence to nine gubernias that included in the territory of today's Ukraine. The statistics of 1906 records are taken from www.statoids.com which provides a broad degree of historical explanation on the situation in the Imperial Russia. The census statistics of 1931 was estimated by the professor Zenon Kuzela (1882–1952)[8] from Berlin. His calculations are as of 1 January 1931. This ethnographer is mentioned in the encyclopedia of Ukraine as one of the sources only available due to lack of the official census.[9][10]
The 2001 census was the first official census of the independent republic of Ukraine. Its data is given as on 1 January. The 2003–2009 stats were taken from the official website of Ukrstat and represent the data as of February of each year for the real population.
Vital statistics
Ukrainian provinces of the Russian Empire
The figures below refer to the nine governorates of the Russian Empire (Volhynia, Yekaterinoslav, Kiev, Podolia, Poltava, Taurida, Kharkov, Kherson and Chernigov) with a Ukrainian majority.[11]
| Average population (thousands) | Live births | Deaths | Natural change | Crude birth rate (per 1,000) | Crude death rate (per 1,000) | Natural change (per 1,000) | Total fertility rates | |
|---|---|---|---|---|---|---|---|---|
| 1900 | 24,969 | 1,203,334 | 660,723 | 542,611 | 48.2 | 26.5 | 21.7 | |
| 1901 | 25,505 | 1,123,519 | 657,883 | 465,636 | 44.1 | 25.8 | 18.3 | |
| 1902 | 25,935 | 1,207,512 | 681,580 | 525,932 | 46.6 | 26.3 | 20.3 | |
| 1903 | 26,449 | 1,188,404 | 663,067 | 525,337 | 44.9 | 25.1 | 19.9 | |
| 1904 | 26,961 | 1,228,116 | 682,068 | 546,048 | 45.6 | 25.3 | 20.3 | |
| 1905 | 28,210 | 1,160,308 | 779,107 | 381,201 | 41.1 | 27.6 | 13.5 | |
| 1906 | 27,949 | 1,225,951 | 724,045 | 501,906 | 43.9 | 25.9 | 18.0 | |
| 1907 | 28,418 | 1,279,027 | 701,451 | 577,576 | 45.0 | 24.7 | 20.3 | |
| 1908 | 29,069 | 1,232,862 | 692,624 | 540,238 | 42.4 | 23.8 | 18.6 | |
| 1909 | 29,700 | 1,226,155 | 744,818 | 481,337 | 41.3 | 25.1 | 16.2 | |
| 1910 | 30,297 | 1,225,658 | 839,491 | 386,167 | 40.5 | 27.7 | 12.7 | |
| 1911 | 30,858 | 1,240,985 | 670,742 | 570,243 | 40.2 | 21.7 | 18.5 | |
| 1912 | 30,580 | 1,245,358 | 654,157 | 591,201 | 40.7 | 21.4 | 19.3 | |
| 1913 | 31,142 | 1,222,277 | 715,924 | 506,353 | 39.2 | 23.0 | 16.3 | 6.00 |
| 1914 | 30,973 | 1,240,114 | 716,875 | 523,239 | 40.0 | 23.1 | 16.9 |
Between WWI and WWII
| Average population (thousands) | Live births | Deaths | Natural change | Crude birth rate (per 1,000) | Crude death rate (per 1,000) | Natural change (per 1,000) | Fertility rates | |
|---|---|---|---|---|---|---|---|---|
| 1924 | 27,400 | 1,150,577 | 484,880 | 665,697 | 42.0 | 17.7 | 24.3 | |
| 1925 | 28,000 | 1,185,028 | 531,819 | 653,209 | 42.3 | 19.0 | 23.3 | 5.39 |
| 1926 | 28,700 | 1,207,907 | 518,656 | 689,251 | 42.1 | 18.1 | 24.0 | |
| 1927 | 29,589 | 1,184,400 | 522,600 | 661,700 | 40.0 | 17.7 | 22.4 | |
| 1928 | 30,251 | 1,139,300 | 495,700 | 643,600 | 37.7 | 16.4 | 21.3 | |
| 1929 | 30,894 | 1,081,000 | 538,700 | 542,300 | 35.0 | 17.4 | 17.6 | |
| 1930 | 31,436 | 1,023,000 | 578,100 | 484,900 | 32.5 | 18.4 | 14.2 | |
| 1931 | 31,882 | 975,300 | 514,700 | 460,600 | 30.6 | 16.1 | 14.4 | |
| 1932 | 32,342 | 782,000 | 668,200 | 113,800 | 24.2 | 20.7 | 3.5 | |
| 1933 | 32,456 | 564,000 | 2,104,000 | -1,540,000 | 17.4 | 64.8 | -47.4 | |
| 1934 | 30,916 | 551,500 | 462,000 | 89,500 | 17.8 | 14.9 | 2.9 | |
| 1935 | 31,006 | 759,100 | 341,900 | 417,200 | 24.5 | 11.0 | 13.5 | |
| 1936 | 31,423 | 893,100 | 359,500 | 533,500 | 28.4 | 11.4 | 17.0 | |
| 1937 | 31,957 | 1,214,000 | 428,400 | 785,600 | 38.0 | 13.4 | 24.6 | |
| 1938 | 32,742 | 1,113,500 | 430,800 | 682,600 | 34.0 | 13.2 | 20.9 | |
| 1939 | 33,425 | 1,073,500 | 412,600 | 660,900 | 32.1 | 12.3 | 19.8 | |
| 1940 (b) | 40,649 | 1,100,000 | 27.3 | 3.80 |
(a) Information is given for Ukraine's territory within its old boundaries up to 17 September 1939 (b) Information is given for Ukraine's territory within its present-day boundaries, after the annexation of Eastern Galicia and Volhynia on September 1939
After WW II
| Average population (thousands) |
Live births | Deaths | Natural change | Crude birth rate (per 1,000) | Crude death rate (per 1,000) | Natural change (per 1,000) | Fertility rates | Urban fertility | Rural fertility | Abortions, reported | |
|---|---|---|---|---|---|---|---|---|---|---|---|
| 1946 | 753,493 | ||||||||||
| 1947 | 712,994 | ||||||||||
| 1948 | 757,783 | ||||||||||
| 1949 | 911,641 | ||||||||||
| 1950 | 36,905 | 844,585 | 315,300 | 529,300 | 22.9 | 8.5 | 14.3 | 2.81 | |||
| 1951 | 37,569 | 858,052 | 327,500 | 530,600 | 22.8 | 8.7 | 14.1 | ||||
| 1952 | 38,141 | 846,434 | 325,700 | 520,700 | 22.2 | 8.5 | 13.7 | ||||
| 1953 | 38,678 | 795,652 | 326,800 | 468,900 | 20.6 | 8.4 | 12.1 | ||||
| 1954 | 39,131 | 845,128 | 318,500 | 526,600 | 21.6 | 8.1 | 13.5 | ||||
| 1955 | 39,506 | 792,696 | 296,200 | 496,500 | 20.1 | 7.5 | 12.6 | 2.70 | |||
| 1956 | 40,082 | 822,569 | 293,000 | 529,600 | 20.5 | 7.3 | 13.2 | ||||
| 1957 | 40,800 | 847,781 | 304,800 | 543,000 | 20.8 | 7.5 | 13.3 | ||||
| 1958 | 41,512 | 873,483 | 286,700 | 586,800 | 21.0 | 6.9 | 14.1 | 2.30 | |||
| 1959 | 42,155 | 880,552 | 316,800 | 563,800 | 20.9 | 7.5 | 13.4 | 2.29 | |||
| 1960 | 42,469 | 878,768 | 296,171 | 582,597 | 20.7 | 7.0 | 13.7 | 2.24 | |||
| 1961 | 43,097 | 843,482 | 304,346 | 539,136 | 19.6 | 7.1 | 12.5 | 2.17 | |||
| 1962 | 43,559 | 823,151 | 331,454 | 491,697 | 18.9 | 7.6 | 11.3 | 2.14 | |||
| 1963 | 44,088 | 794,969 | 323,556 | 471,413 | 17.9 | 7.3 | 10.6 | 2.06 | |||
| 1964 | 44,664 | 741,668 | 315,340 | 426,328 | 16.5 | 7.0 | 9.5 | 1.96 | |||
| 1965 | 45,133 | 692,153 | 342,717 | 349,436 | 15.3 | 7.6 | 7.7 | 1.99 | |||
| 1966 | 45,548 | 713,492 | 344,850 | 368,642 | 15.6 | 7.5 | 8.1 | 2.02 | |||
| 1967 | 45,997 | 699,381 | 368,573 | 330,808 | 15.1 | 8.0 | 7.2 | 2.01 | |||
| 1968 | 46,408 | 693,064 | 374,440 | 318,624 | 14.9 | 8.0 | 6.8 | 1.99 | |||
| 1969 | 46,778 | 687,991 | 404,151 | 283,840 | 14.7 | 8.6 | 6.0 | 2.04 | |||
| 1970 | 47,127 | 719,213 | 418,679 | 300,534 | 15.2 | 8.9 | 6.4 | 2.10 | 1,130,315 | ||
| 1971 | 47,507 | 736,691 | 424,717 | 311,974 | 15.4 | 8.9 | 6.5 | 2.12 | |||
| 1972 | 47,903 | 745,696 | 443,038 | 302,658 | 15.5 | 9.2 | 6.3 | 2.08 | |||
| 1973 | 48,274 | 719,560 | 449,351 | 270,209 | 14.9 | 9.3 | 5.6 | 2.04 | |||
| 1974 | 48,571 | 736,616 | 455,970 | 280,646 | 15.1 | 9.4 | 5.8 | 2.04 | |||
| 1975 | 48,881 | 738,857 | 489,550 | 249,307 | 15.1 | 10.0 | 5.1 | 2.02 | 1,110,223 | ||
| 1976 | 49,151 | 747,069 | 500,584 | 246,485 | 15.2 | 10.2 | 5.0 | 1.99 | |||
| 1977 | 49,388 | 726,217 | 517,967 | 208,250 | 14.7 | 10.5 | 4.2 | 1.94 | |||
| 1978 | 49,578 | 732,187 | 529,681 | 202,506 | 14.7 | 10.7 | 4.1 | 1.96 | |||
| 1979 | 49,755 | 735,188 | 552,019 | 183,169 | 14.7 | 11.1 | 3.7 | 1.96 | |||
| 1980 | 50,044 | 742,489 | 568,243 | 174,246 | 14.8 | 11.4 | 3.5 | 1.95 | 1,197,000 | ||
| 1981 | 50,222 | 733,183 | 568,789 | 164,394 | 14.6 | 11.3 | 3.3 | 1.93 | 1,112,734 | ||
| 1982 | 50,388 | 745,591 | 568,231 | 177,360 | 14.8 | 11.3 | 3.5 | 1.94 | 1,131,437 | ||
| 1983 | 50,573 | 807,111 | 583,496 | 223,615 | 16.0 | 11.6 | 4.4 | 2.11 | 1,125,686 | ||
| 1984 | 50,768 | 792,035 | 610,338 | 181,697 | 15.6 | 12.0 | 3.6 | 2.08 | 1,127,627 | ||
| 1985 | 50,941 | 762,775 | 617,548 | 145,227 | 15.0 | 12.1 | 2.9 | 2.02 | 1,179,000 | ||
| 1986 | 51,143 | 792,574 | 565,150 | 227,424 | 15.5 | 11.1 | 4.4 | 2.13 | 1,166,039 | ||
| 1987 | 51,373 | 760,851 | 586,387 | 174,464 | 14.8 | 11.4 | 3.4 | 2.07 | 1,168,136 | ||
| 1988 | 51,593 | 744,056 | 600,725 | 143,331 | 14.4 | 11.6 | 2.8 | 2.04 | 1,080,029 | ||
| 1989 | 51,770 | 690,981 | 600,590 | 90,391 | 13.3 | 11.6 | 1.7 | 1.92 | 1.78 | 2.33 | 1,058,414 |
| 1990 | 51,838 | 657,202 | 629,602 | 27,600 | 12.7 | 12.1 | 0.6 | 1.84 | 1.69 | 2.27 | 1,019,038 |
| 1991 | 51,944 | 630,813 | 669,960 | −39,147 | 12.1 | 12.9 | −0.8 | 1.77 | 1.61 | 2.33 | 957,022 |
| 1992 | 52,056 | 596,785 | 697,110 | −100,325 | 11.4 | 13.4 | −2.0 | 1.67 | 1.48 | 2.19 | 932,272 |
| 1993 | 52,244 | 557,467 | 741,662 | −184,195 | 10.7 | 14.2 | −3.5 | 1.56 | 1.37 | 2.07 | 860,996 |
| 1994 | 52,114 | 521,545 | 764,669 | −243,124 | 10.0 | 14.7 | −4.7 | 1.47 | 1.28 | 1.97 | 798,538 |
| 1995 | 51,728 | 492,861 | 792,587 | −299,726 | 9.6 | 15.4 | −5.8 | 1.40 | 1.22 | 1.86 | 740,172 |
| 1996 | 51,297 | 467,211 | 776,717 | −309,506 | 9.2 | 15.2 | −6.1 | 1.33 | 1.16 | 1.77 | 687,035 |
| 1997 | 50,818 | 442,581 | 754,151 | −311,570 | 8.7 | 14.9 | −6.2 | 1.27 | 1.11 | 1.68 | 596,740 |
| 1998 | 50,370 | 419,238 | 719,954 | −300,716 | 8.4 | 14.4 | −6.0 | 1.20 | 1.04 | 1.62 | 525,329 |
| 1999 | 49,918 | 389,208 | 739,170 | −349,962 | 7.8 | 14.9 | −7.0 | 1.12 | 0.97 | 1.51 | 495,760 |
| 2000 | 49,429 | 385,126 | 758,082 | −372,956 | 7.8 | 15.4 | −7.6 | 1.11 | 0.96 | 1.49 | 434,223 |
| 2001 | 48,923 | 376,479 | 745,953 | −369,474 | 7.7 | 15.3 | −7.6 | 1.085 | 0.96 | 1.41 | 369,750 |
| 2002 | 48,457 | 390,687 | 754,911 | −364,224 | 8.1 | 15.7 | −7.6 | 1.12 | 1.03 | 1.47 | 345,967 |
| 2003 | 48,003 | 408,591 | 765,408 | −356,817 | 8.5 | 16.0 | −7.5 | 1.17 | 1.09 | 1.48 | 315,835 |
| 2004 | 47,622 | 427,259 | 761,263 | −334,004 | 9.0 | 16.0 | −7.0 | 1.21 | 1.12 | 1.53 | 289,065 |
| 2005 | 47,280 | 426,085 | 781,964 | −355,879 | 9.0 | 16.6 | −7.6 | 1.21 | 1.16 | 1.48 | 263,950 |
| 2006 | 46,929 | 460,368 | 758,093 | −297,725 | 9.8 | 16.2 | −6.4 | 1.31 | 1.21 | 1.61 | 229,618 |
| 2007 | 46,646 | 472,657 | 762,877 | −290,220 | 10.2 | 16.4 | −6.2 | 1.34 | 1.28 | 1.69 | 210,454 |
| 2008 | 46,372 | 510,588 | 754,462 | −243,874 | 11.0 | 16.3 | −5.3 | 1.46 | 1.31 | 1.72 | 201,087 |
| 2009 | 46,143 | 512,526 | 706,740 | −194,214 | 11.1 | 15.3 | −4.2 | 1.46 | 1.33 | 1.77 | 194,845 |
| 2010 | 45,962 | 497,689 | 698,235 | −200,546 | 10.8 | 15.2 | −4.4 | 1.44 | 1.31 | 1.78 | 176,774 |
| 2011 | 45,778 | 502,595 | 664,588 | −161,993 | 11.0 | 14.5 | −3.5 | 1.46 | 1.32 | 1.80 | 156,193 |
| 2012 | 45,633 | 520,704 | 663,139 | −142,435 | 11.4 | 14.5 | −3.1 | 1.53 | 1.39 | 1.87 | 141,396 |
| 2013 | 45,553 | 503,656 | 662,368 | −158,712 | 11.1 | 14.6 | −3.5 | 1.51 | 1.37 | 1.83 | |
| 2014 | 43,001 | 465,882 | 632,296 | −166,414 | 10.8 | 14.7 | −3.9 | 1.50 | 1.35 | 1.83 | |
| 2015 | 42,844 | 411,783 | 594,795 | −183,012 | 9.6 | 13.9 | −4.3 | 1.51 | 1.39 | 1.71 | |
| 2016 | 42,672 | 397,039 | 583,631 | −186,592 | 9.3 | 13.6 | −4.3 | 1.47 | 1.36 | 1.64 | |
| 2017 | 42,386 | 363,987 | 574,123 | −210,136 | 8.4 | 13.4 | −5.0 | 1.38 (e) |
(e) estimate
| Urban live births | Urban deaths | Urban natural change | Urban crude birth rate (per 1,000) | Urban crude death rate (per 1,000) | Urban natural change (per 1,000) | Rural live births | Rural deaths | Rural natural change | Rural crude birth rate (per 1,000) | Rural crude death rate (per 1,000) | Rural natural change (per 1,000) | |
|---|---|---|---|---|---|---|---|---|---|---|---|---|
| 1990 | 442,869 | 357,114 | 85,755 | 12.7 | 10.2 | 2.5 | 214,333 | 272,488 | −58,155 | 12.7 | 16.1 | −3.4 |
| 1991 | 419,205 | 380,988 | 38,917 | 11.9 | 10.8 | 1.1 | 211,608 | 288,972 | −77,364 | 12.6 | 17.2 | −4.6 |
| 1992 | 387,696 | 401,849 | −14,153 | 11.0 | 11.4 | −0.4 | 209,089 | 295,261 | −86,172 | 12.5 | 17.6 | −5.1 |
| 1993 | 356,833 | 432,462 | −75,629 | 10.1 | 12.2 | −2.1 | 200,634 | 309,200 | −108,566 | 12.0 | 18.5 | −6.5 |
| 1994 | 328,522 | 450,823 | −122,301 | 9.3 | 12.8 | −3.5 | 193,023 | 313,846 | −120,823 | 11.6 | 18.8 | −7.2 |
| 1995 | 308,408 | 476,434 | −168,026 | 8.8 | 13.6 | −4.8 | 184,453 | 316,153 | −131,700 | 11.1 | 19.1 | −8.0 |
| 1996 | 291,121 | 460,805 | −169,684 | 8.4 | 13.3 | −4.9 | 176,090 | 315,912 | −139,822 | 10.7 | 19.2 | −8.5 |
| 1997 | 274,961 | 444,446 | −169,485 | 8.0 | 13.0 | −5.0 | 167,620 | 309,705 | −142,805 | 10.2 | 18.9 | −8.7 |
| 1998 | 258,724 | 425,521 | −166,797 | 7.6 | 12.6 | −5.0 | 160,514 | 294,433 | −133,919 | 9.9 | 18.1 | −8.2 |
| 1999 | 239,408 | 439,986 | −200,578 | 7.1 | 13.1 | −6.0 | 149,800 | 299,184 | −149,384 | 9.3 | 18.5 | −9.2 |
| 2000 | 238,014 | 457,069 | −219,055 | 7.2 | 13.8 | −6.6 | 147,112 | 301,013 | −153,901 | 9.2 | 18.8 | −9.6 |
| 2001 | 237,228 | 450,329 | −213,101 | 7.2 | 13.8 | −6.6 | 139,250 | 295,623 | −156,373 | 8.7 | 18.6 | −9.9 |
| 2002 | 248,877 | 454,406 | −205,529 | 7.7 | 14.0 | −6.3 | 141,811 | 300,505 | −158,694 | 9.0 | 19.1 | −10.1 |
| 2003 | 266,415 | 459,965 | −193,550 | 8.3 | 14.3 | −6.0 | 142,174 | 305,443 | −163,269 | 9.1 | 19.6 | −10.5 |
| 2004 | 284,361 | 460,492 | −176,131 | 8.9 | 14.4 | −5.5 | 142,898 | 300,769 | −157,871 | 9.3 | 19.6 | −10.3 |
| 2005 | 284,257 | 471,561 | −187,304 | 8.9 | 14.8 | −5.9 | 141,829 | 310,400 | −168,571 | 9.4 | 20.5 | −11.1 |
| 2006 | 306,635 | 461,774 | −155,139 | 9.6 | 14.5 | −4.9 | 153,733 | 296,318 | −142,585 | 10.3 | 19.8 | −9.5 |
| 2007 | 314,065 | 466,253 | −152,188 | 9.9 | 14.7 | −4.8 | 158,592 | 296,624 | −138,032 | 10.7 | 20.1 | −9.4 |
| 2008 | 340,594 | 462,897 | −122,303 | 10.8 | 14.6 | −3.8 | 169,995 | 291,563 | −121,568 | 11.6 | 19.9 | −8.3 |
| 2009 | 339,497 | 432,294 | −92,797 | 10.8 | 13.7 | −2.9 | 173,028 | 274,445 | −101,417 | 11.9 | 18.9 | −7.0 |
| 2010 | 326,587 | 431,130 | −104,543 | 10.4 | 13.7 | −3.3 | 171,102 | 267,105 | −96,003 | 11.9 | 18.6 | −6.7 |
| 2011 | 328,934 | 411,025 | −82,091 | 10.5 | 13.1 | −2.3 | 173,661 | 253,563 | −79,902 | 12.1 | 17.7 | −5.6 |
| 2012 | 341,599 | 411,787 | −70,788 | 10.9 | 13.1 | −2.2 | 179,106 | 251,352 | −72,246 | 12.6 | 17.7 | −5.1 |
| 2013 | 330,284 | 412,552 | −82,268 | 10.5 | 13.1 | −2.6 | 173,372 | 249,816 | −76,444 | 12.3 | 17.7 | −5.4 |
| 2014 | 304,190 | 391,739 | −87,549 | 10.2 | 13.2 | −3.0 | 161,692 | 240,557 | −78,865 | 12.2 | 18.1 | −5.9 |
| 2015 | 266,082 | 358,749 | −92,667 | 10.4 | 13.2 | −2.8 | 145,699 | 236,047 | −90,348 | 11.3 | 18.0 | −6.7 |
| 2016 | 258,688 | 354,634 | −95,946 | 10.0 | 13.2 | −3.2 | 138,349 | 228,997 | −90,648 | 10.8 | 17.6 | −6.8 |
Note: Data excludes Crimea starting in 2014.[12]

Current vital statistics
- Number of births for January–June 2017 =

- Number of births for January–June 2018 =
- Number of deaths for January–June 2017 =

- Number of deaths for January–June 2018 =
- Natural increase from January–June 2017 =
- Natural increase from January–June 2018 =
Note: Starting 2014 territories of the Autonomous Republic of Crimea, the city of Sevastopol and part of the anti-terrorist operation zone are not included in Demographics of Ukraine. These territories are included to the Demographics of Russia. All datas from State Statistics Service of Ukraine. [16]
Life expectancy at birth
- total population: 71.37

- male: 66.34
- female: 76.22
Average life expectancy at age 0 of the total population.[17]
| Period | Life expectancy in Years |
|---|---|
| 1950–1955 | 61.83 |
| 1955–1960 | |
| 1960–1965 | |
| 1965–1970 | |
| 1970–1975 | |
| 1975–1980 | |
| 1980–1985 | |
| 1985–1990 | |
| 1990–1995 | |
| 1995–2000 | |
| 2000–2005 | |
| 2005–2010 | |
| 2010–2015 |
Total fertility rate
- 6.00
- 5.39
- 1.08
- 1.46
- 1.53
- 1.51
In 2001 Ukraine recorded the lowest fertility rate ever recorded in Europe for an independent country: 1.08 child/woman. During this year the number of children born was less than half of that born in 1987. Lower rates were recorded only in former East Germany, which registered 0.77 child/woman in 1994, as well as Taiwan (from 2008 to 2010), and both Hong Kong and Macau (from about 2000 to 2010). After neglect by the Kuchma administration, both the Yushchenko and the Yanukovych governments have made increasing the birth rate a priority.
Demographic statistics
Birth data by oblast
Note: Recent data for Donetsk and Luhansk Oblasts has been affected by the War in Donbass, and may only include births within the government-held parts of the oblasts.[18]
| Number of births by oblast for January–November | Birth/2016 | Birth/2015 | Death/2016 | Death/2015 |
|---|---|---|---|---|
| 33416 | 32382 | 27772 | 27767 | |
| 28473 | 30620 | 47934 | 49258 | |
| 25708 | 25007 | 29247 | 30010 | |
| 24246 | 25182 | 30479 | 31512 | |
| 21992 | 22864 | 38502 | 38965 | |
| 17772 | 15608 | 33464 | 36883 | |
| 17559 | 18485 | 25623 | 26046 | |
| 14862 | 15525 | 13880 | 14164 | |
| 14454 | 14809 | 13261 | 13426 | |
| 14430 | 15140 | 25533 | 25657 | |
| 14153 | 15126 | 22521 | 23237 | |
| 13547 | 14412 | 15616 | 16144 | |
| 12047 | 12307 | 12311 | 12602 | |
| 11958 | 12526 | 18301 | 19085 | |
| 11793 | 12768 | 18097 | 18702 | |
| 11503 | 12381 | 22084 | 22440 | |
| 9904 | 10626 | 15834 | 16316 | |
| 9877 | 10476 | 14891 | 15055 | |
| 9721 | 10560 | 18437 | 18315 | |
| 9461 | 9851 | 10399 | 10738 | |
| 9177 | 9912 | 13584 | 13962 | |
| 8189 | 8662 | 14810 | 14809 | |
| 8169 | 8959 | 16982 | 17322 | |
| 7816 | 8359 | 17515 | 18199 | |
| 5960 | 4978 | 12689 | 13401 |
| Number of births by oblast | Birth/2014 | Birth/2013 | Birth/2012 | Birth/2011 | Death/2014 | Death/2013 | Death/2012 | Death/2011 |
|---|---|---|---|---|---|---|---|---|
| 36497 | 36134 | 37087 | 36116 | 52722 | 51134 | 51486 | 52106 | |
| 35595 | 41034 | 42839 | 41720 | 71799 | 69345 | 70496 | 71042 | |
| 34821 | 33305 | 33887 | 32068 | 29992 | 28003 | 27840 | 27050 | |
| 30270 | 29542 | 30220 | 28904 | 32450 | 31666 | 31667 | 31162 | |
| 29465 | 29075 | 30384 | 29225 | 34155 | 33523 | 33648 | 33688 | |
| 27690 | 26700 | 27244 | 26317 | 41891 | 39465 | 40130 | 40079 | |
| 20900 | 20511 | 20966 | 20083 | 28264 | 27198 | 27161 | 26847 | |
| 18713 | 18134 | 18882 | 18198 | 27773 | 26498 | 26406 | 27033 | |
| 18377 | 18490 | 18968 | 18460 | 14808 | 14801 | 14813 | 14588 | |
| 17547 | 17437 | 18339 | 17894 | 25567 | 25453 | 25158 | 25376 | |
| 17169 | 17445 | 18316 | 17697 | 14714 | 14556 | 14302 | 14168 | |
| 16886 | 16716 | 17101 | 16497 | 17670 | 17358 | 16801 | 16657 | |
| 15115 | 15001 | 15486 | 15154 | 21185 | 20859 | 20685 | 20417 | |
| 14668 | 14700 | 15346 | 14620 | 13748 | 13666 | 13710 | 13842 | |
| 14631 | 14548 | 14881 | 14492 | 20408 | 20581 | 20362 | 20116 | |
| 14504 | 14296 | 14635 | 14167 | 24784 | 24358 | 24223 | 24384 | |
| 13076 | 13043 | 13515 | 13029 | 17750 | 17353 | 17277 | 17441 | |
| 12351 | 12100 | 12798 | 12473 | 20800 | 20477 | 20667 | 20848 | |
| 12308 | 12300 | 12643 | 12085 | 16141 | 16048 | 15904 | 15828 | |
| 11717 | 11807 | 12202 | 11964 | 15180 | 14682 | 14838 | 14829 | |
| 11679 | 11465 | 11592 | 11281 | 11619 | 11520 | 11321 | 11192 | |
| 11442 | 20531 | 21743 | 21320 | 22755 | 35822 | 36316 | 37256 | |
| 10576 | 10562 | 11029 | 10578 | 16716 | 16513 | 16521 | 16697 | |
| 10344 | 10411 | 11093 | 10473 | 19452 | 19219 | 19002 | 18833 | |
| 9552 | 9852 | 10222 | 10134 | 20324 | 19909 | 20208 | 20179 | |
| Birth rate by oblast | Birth/2014 | Birth/2013 | Birth/2012 | Birth/2011 | Death/2014 | Death/2013 | Death/2012 | Death/2011 |
|---|---|---|---|---|---|---|---|---|
| 14.8 | 15.1 | 15.9 | 15.3 | 12.7 | 12.6 | 12.4 | 12.3 | |
| 14.6 | 14.7 | 15.1 | 14.8 | 11.8 | 11.8 | 11.8 | 11.7 | |
| 14.1 | 14.1 | 14.8 | 14.1 | 13.2 | 13.1 | 13.2 | 13.3 | |
| 12.9 | 12.6 | 12.8 | 12.5 | 12.8 | 12.7 | 12.5 | 12.4 | |
| 12.3 | 12.1 | 12.7 | 12.2 | 14.3 | 14.0 | 14.1 | 14.1 | |
| 12.2 | 12.1 | 12.4 | 12.0 | 12.8 | 12.6 | 12.2 | 12.1 | |
| 12.1 | 11.9 | 12.2 | 11.7 | 16.4 | 15.8 | 15.8 | 15.6 | |
| 12.1 | 11.7 | 12.0 | 11.4 | 10.4 | 9.8 | 9.8 | 9.6 | |
| 12.0 | 11.9 | 12.2 | 11.9 | 16.8 | 16.5 | 16.3 | 16.0 | |
| 11.9 | 11.6 | 11.9 | 11.4 | 12.8 | 12.4 | 12.5 | 12.3 | |
| 11.5 | 11.4 | 11.7 | 11.1 | 15.1 | 14.9 | 14.7 | 14.6 | |
| 11.2 | 11.1 | 11.5 | 11.0 | 15.2 | 14.8 | 14.7 | 14.8 | |
| 11.2 | 11.1 | 11.3 | 11.0 | 15.6 | 15.7 | 15.5 | 15.2 | |
| 11.1 | 11.0 | 11.2 | 10.9 | 16.0 | 15.5 | 15.5 | 15.7 | |
| 10.9 | 10.8 | 11.2 | 10.9 | 15.9 | 15.7 | 15.4 | 15.5 | |
| 10.9 | 11.0 | 11.3 | 11.1 | 14.2 | 13.7 | 13.8 | 13.7 | |
| 10.8 | 10.7 | 11.0 | 10.5 | 17.0 | 16.7 | 16.5 | 16.6 | |
| 10.6 | 10.2 | 10.6 | 10.1 | 15.7 | 14.9 | 14.8 | 15.0 | |
| 10.1 | 9.8 | 9.9 | 9.6 | 15.3 | 14.4 | 14.6 | 14.6 | |
| 10.0 | 9.8 | 9.9 | 9.5 | 17.1 | 16.7 | 16.5 | 16.4 | |
| 9.8 | 9.6 | 10.1 | 9.8 | 16.5 | 16.2 | 16.2 | 16.3 | |
| 9.2 | 9.2 | 9.7 | 9.1 | 17.2 | 16.9 | 16.6 | 16.3 | |
| 9.0 | 9.2 | 9.4 | 9.3 | 19.2 | 18.6 | 18.7 | 18.5 | |
| 8.2 | 9.4 | 9.8 | 9.5 | 16.6 | 15.9 | 16.1 | 16.1 | |
| 5.1 | 9.1 | 9.6 | 9.3 | 10.2 | 15.9 | 16.0 | 16.3 |
Year in review 2013
Compared to 2012, amount of attrition increased by 16,278 persons, or 3.1 to 3.5 persons per 1,000 inhabitants real. Natural decrease was observed in 23 oblasts of the country, while natural increases were recorded only in the capital Kiev, Zakarpattya, Rivne and Volyn oblast (respectively 5,302, 3,689, 2,889 and 1,034 people).
Some regions registered a low natural decline, such as Chernivtsi, Ivano-Frankivsk, Sevastopol, Lviv, Ternopil, Crimea, Kherson and Odessa (respectively, −55, −642, −863, −2,124, −2,875, −2,974, −3,748 and −4,448 people). The largest declines were recorded in Donetsk, Luhansk, Dnipro, Kharkiv, Poltava and Chernihiv (respectively −28,311, −15,291, −15,007, −12,765, −10,062 and −10,057), regions which have in common a low birth rate and high mortality of a large urban population and a strong rural population aging.
Net migration rate
−5.4 migrant(s)/1,000 population (2015).
Infant mortality rate
- 9.1
- 9.0
- 8.4
- 8.0
- 8.9
- 8.6
- 7.8
| Infant mortality by oblast | Death/2012 | Death/2011 | Death/2010 | Death/2009 |
|---|---|---|---|---|
| 540 | 473 | 497 | 533 | |
| 370 | 343 | 347 | 329 | |
| 267 | 268 | 263 | 280 | |
| 262 | 255 | 233 | 244 | |
| 233 | 272 | 266 | 238 | |
| 203 | 234 | 243 | 252 | |
| 168 | 195 | 199 | 238 | |
| 166 | 186 | 148 | 149 | |
| 165 | 188 | 199 | 252 | |
| 154 | 169 | 182 | 174 | |
| 147 | 156 | 158 | 164 | |
| 134 | 89 | 109 | 174 | |
| 124 | 134 | 135 | 127 | |
| 122 | 101 | 125 | 132 | |
| 119 | 143 | 140 | 146 | |
| 109 | 145 | 170 | 157 | |
| 106 | 116 | 123 | 118 | |
| 103 | 139 | 112 | 119 | |
| 100 | 120 | 116 | 136 | |
| 97 | 97 | 104 | 112 | |
| 97 | 96 | 98 | 93 | |
| 94 | 80 | 82 | 103 | |
| 92 | 96 | 90 | 91 | |
| 85 | 86 | 87 | 105 | |
| 76 | 78 | 97 | 91 | |
| Infant mortality per 1,000 by Oblast | Death/2012 | Death/2011 | Death/2010 | Death/2009 |
|---|---|---|---|---|
| 12.7 | 11.4 | 12.0 | 12.3 | |
| 10.0 | 9.5 | 9.7 | 8.8 | |
| 9.6 | 8.1 | 10.0 | 10.5 | |
| 9.4 | 13.2 | 10.6 | 10.9 | |
| 9.2 | 7.9 | 8.1 | 9.9 | |
| 9.1 | 10.4 | 8.4 | 8.3 | |
| 9.0 | 6.2 | 7.5 | 11.8 | |
| 8.9 | 10.6 | 10.9 | 13.1 | |
| 8.8 | 9.2 | 9.2 | 9.7 | |
| 8.2 | 9.3 | 10.1 | 9.4 | |
| 8.1 | 8.9 | 9.2 | 9.4 | |
| 8.0 | 9.9 | 9.4 | 11.0 | |
| 8.0 | 8.9 | 9.1 | 8.5 | |
| 8.0 | 8.5 | 8.2 | 8.2 | |
| 8.0 | 8.0 | 8.2 | 7.5 | |
| 7.8 | 9.4 | 9.2 | 8.0 | |
| 7.8 | 8.0 | 7.3 | 7.5 | |
| 7.6 | 8.8 | 9.4 | 11.6 | |
| 7.5 | 8.9 | 9.2 | 9.3 | |
| 7.3 | 7.5 | 8.1 | 8.5 | |
| 7.0 | 7.9 | 8.2 | 7.7 | |
| 6.9 | 7.5 | 9.3 | 8.5 | |
| 6.4 | 8.8 | 10.3 | 9.1 | |
| 5.8 | 6.1 | 6.1 | 7.1 | |
| 5.7 | 7.2 | 7.0 | 7.1 |
Total fertility rate by oblast
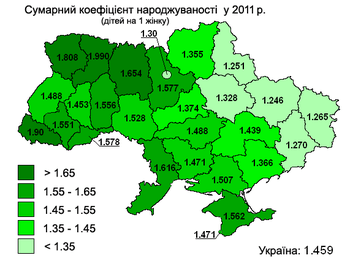
Although none of the oblasts in 2013 has recorded a higher fertility rate 2.10 children per woman. However, the rate has been in rural areas in the Rivne Oblast (2.50) and the Volyn Oblast (2.20). While a very close generational renewal rate was achieved in the Odessa Oblast (2.04), Zakarpattia Oblast (2.00), Mykolaiv Oblast (1.95), Chernivtsi Oblast (1.93) and Zhytomyr Oblast (1.91) weaker when they have been recorded in the Luhansk oblast (1.41), Sumy oblast (1.47) and Cherkasy Oblast (1.53).
The fertility rate of the highest urban areas were recorded in the Zakarpattia Oblast (1.80), the city of Sevastopol (1.57), Volyn Oblast (1.56), Kiev Oblast (1.56) and the Rivne Oblast (1.54). The lowest rates were recorded in the Sumy Oblast (1.23), Kharkiv Oblast (1.26), Cherkasy Oblast (1.28), Chernihiv Oblast (1.28), Chernivtsi Oblast (1.28), Luhansk oblast (1.28), Poltava oblast (1.29), Donetsk oblast (1.29) and Zaporizhia Oblast (1.32).
| Children born per woman by oblast | Total fertility rate/2013 | Total fertility rate/2012 | Total fertility rate/2011 | Total fertility rate/2010 |
|---|---|---|---|---|
| 2.00 | 2.08 | 1.99 | 1.93 | |
| 1.93 | 1.95 | 1.90 | 1.83 | |
| 1.86 | 1.92 | 1.81 | 1.85 | |
| 1.68 | 1.71 | 1.65 | 1.61 | |
| 1.65 | 1.71 | 1.62 | 1.58 | |
| 1.64 | 1.67 | 1.58 | 1.58 | |
| 1.63 | 1.64 | 1.58 | 1.53 | |
| 1.61 | 1.62 | 1.56 | 1.55 | |
| 1.60 | 1.63 | 1.55 | 1.58 | |
| 1.60 | 1.61 | 1.51 | 1.51 | |
| 1.57 | 1.61 | 1.51 | 1.50 | |
| 1.55 | 1.58 | 1.49 | 1.50 | |
| 1.55 | 1.57 | 1.47 | 1.44 | |
| 1.53 | 1.59 | 1.53 | 1.50 | |
| 1.51 | 1.53 | 1.46 | 1.45 | |
| 1.51 | 1.52 | 1.44 | 1.43 | |
| 1.48 | 1.50 | 1.45 | 1.46 | |
| 1.43 | 1.46 | 1.37 | 1.34 | |
| 1.40 | 1.41 | 1.33 | 1.34 | |
| 1.38 | 1.43 | 1.37 | 1.36 | |
| 1.37 | 1.40 | 1.36 | 1.36 | |
| 1.36 | 1.38 | 1.29 | 1.30 | |
| 1.32 | 1.34 | 1.27 | 1.26 | |
| 1.32 | 1.32 | 1.25 | 1.24 | |
| 1.30 | 1.36 | 1.25 | 1.23 | |
| 1.30 | 1.33 | 1.27 | 1.23 |
Other demographics statistics

The population of Ukraine has undergone a major crisis since the 1990s. This is mainly because of the high death rate and a very low birth rate. The country’s population is shrinking by over 150,000 people every year. However, things have changed a little since the year 2000. The birth rate, which was previously very low, has risen recently.[20]
The fertility rate, however, is fairly low: 1.29 children born/woman. The death rate of almost 15 deaths/1000 persons is higher than the birth rate, which is almost 9.59 births/1000 population.[20]
Demographic statistics according to the World Population Review.[20]
- One birth every 1 minutes
- One death every 48 seconds
- Net loss of one person every 2 minutes
- One net migrant every 26 minutes
Demographic statistics according to the CIA World Factbook, unless otherwise indicated.[21]
- Population
- 44,033,874 (July 2017 est.)
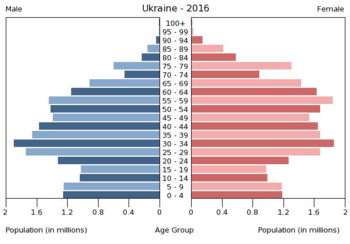
- Age structure
- 0-14 years: 15.76% (male 3,571,358/female 3,366,380)
- 15-24 years: 9.86% (male 2,226,142/female 2,114,853)
- 25-54 years: 44.29% (male 9,579,149/female 9,921,387)
- 55-64 years: 13.8% (male 2,605,849/female 3,469,246)
- 65 years and over: 16.3% (male 2,409,049/female 4,770,461) (2017 est.)
- 0–14 years: 15.1%
- 15–64 years: 69.3%
- 65 years and over: 15.6%
- 0–14 years: 14.8%
- 15–64 years: 69.2%

- 65 years and over: 16.0%
- 0–14 years: 21.6%
- 15–64 years: 66.7%
- 65 years and over: 11.7%
- Total fertility rate
- 1.54 children born/woman (2017 est.) Country comparison to the world: 191st
- Mother's mean age at first birth
- 24.9 years (2014 est.)
- Median age
- total: 40.6 years. Country comparison to the world: 48th
- male: 37.4 years
- female: 43.7 years (2017 est.)
- total: 39.8 years
- male: 39.7 years
- female: 40.1 years (2014 official)
- total: 39.7 years
- male: 39.5 years
- female: 40.1 years (2013 official)
- total: 34.8 years
- male: 31.9 years
- female: 37.7 years (1989 official)
- Population growth rate
- -0.41% (2017 est.) Country comparison to the world: 220th
- Life expectancy at birth
- total population: 72.1 years Country comparison to the world: 150th
- male: 67.4 years
- female: 77.1 years (2017 est.)
- Birth rate
- 10.3 births/1,000 population (2017 est.) Country comparison to the world: 189th
- Death rate
- 14.4 deaths/1,000 population (2017 est.)
- Net migration rate
- 0 migrant(s)/1,000 population (2017 est.) Country comparison to the world: 100th
- Ethnic groups
Ukrainian 77.8%, Russian 17.3%, Belarusian 0.6%, Moldovan 0.5%, Crimean Tatar 0.5%, Bulgarian 0.4%, Hungarian 0.3%, Romanian 0.3%, Polish 0.3%, Jewish 0.2%, other 1.8% (2001 est.)
- Languages
Ukrainian (official) 67.5%, Russian (regional language) 29.6%, other (includes small Crimean Tatar-, Moldovan/Romanian-, and Hungarian-speaking minorities) 2.9% (2001 est.)
Note: in February 2018, the Constitutional Court ruled that 2012 language legislation entitling a language spoken by at least 10% of an oblast's population to be given the status of "regional language" - allowing for its use in courts, schools, and other government institutions - was unconstitutional, thus making the law invalid; Ukrainian remains the country's only official nationwide
- Religions
Orthodox (includes Ukrainian Autocephalous Orthodox (UAOC), Ukrainian Orthodox - Kyiv Patriarchate (UOC-KP), Ukrainian Orthodox - Moscow Patriarchate (UOC-MP)), Ukrainian Greek Catholic, Roman Catholic, Protestant, Muslim, Jewish
Note: Ukraine's population is overwhelmingly Christian; the vast majority - up to two-thirds - identify themselves as Orthodox, but many do not specify a particular branch; the UOC-KP and the UOC-MP each represent less than a quarter of the country's population, the Ukrainian Greek Catholic Church accounts for 8-10%, and the UAOC accounts for 1-2%; Muslim and Jewish adherents each compose less than 1% of the total population (2013 est.)
- Urbanization
- urban population: 69.4% of total population (2018)
- rate of urbanization: -0.33% annual rate of change (2015-20 est.)
- School life expectancy (primary to tertiary education)
- total: 15 years
- male: 15 years
- female: 16 years (2014)
- Unemployment, youth ages 15–24
- total: 22.4% Country comparison to the world: 56th
- male: 22.7%
- female: 21.9% (2015 est.)
Statistic rate of regional capitals
| Birth rate in
regional centers |
Birth/2012 | Birth/2011 | Birth/2010 | Birth/2009 | Birth/2007 | Birth/2005 | Birth/2003 |
|---|---|---|---|---|---|---|---|
| Simferopol | 13.6 | 12.8 | 11.8 | 11.8 | 11.0 | 9.5 | 9.2 |
| Lutsk | 12.6 | 12.3 | 12.6 | 13.9 | 12.6 | 11.7 | 10.0 |
| Rivne | 12.6 | 12.0 | 11.8 | 12.3 | 10.9 | 10.1 | 9.4 |
| Uzhhorod | 12.1 | 11.9 | 12.0 | 12.4 | 12.8 | 12.6 | 10.8 |
| Kiev | 12.0 | 11.4 | 11.5 | 11.7 | 10.4 | 9.8 | 8.8 |
| Khmelnytskyi | 12.0 | 11.2 | 11.8 | 11.5 | 10.4 | 10.2 | 9.2 |
| Sevastopol | 12.0 | 11.1 | 11.0 | 11.2 | 10.5 | 9.6 | 8.7 |
| Kherson | 11.9 | 11.1 | 10.1 | 10.5 | 9.6 | 8.6 | 8.5 |
| Ternopil | 11.8 | 12.2 | 11.7 | 12.3 | 11.9 | 11.6 | 10.4 |
| Ivano-Frankivsk | 11.6 | 11.6 | 10.1 | 10.8 | 11.3 | 10.7 | 9.3 |
| Vinnytsia | 11.5 | 11.2 | 10.9 | 11.1 | 10.1 | 9.4 | 9.1 |
| Kropyvnytskyi | 11.5 | 11.1 | 10.5 | 11.3 | 10.5 | 8.9 | 8.4 |
| Zhytomyr | 11.4 | 11.5 | 10.8 | 11.7 | 10.6 | 9.5 | 8.7 |
| Sumy | 11.3 | 10.3 | 10.0 | 10.3 | 9.6 | 8.2 | 7.8 |
| Lviv | 11.0 | 10.4 | 10.0 | 10.5 | 9.7 | 9.3 | 9.0 |
| Ukraine Urban | 10.9 | 10.5 | 10.4 | 10.8 | 9.9 | 8.9 | 8.3 |
| Dnipro | 10.5 | 10.2 | 10.0 | 10.5 | 9.4 | 8.5 | 7.9 |
| Luhansk | 10.5 | 9.8 | 8.8 | 9.2 | 8.2 | 7.4 | 6.8 |
| Chernivtsi | 10.2 | 10.3 | 10.1 | 10.2 | 9.2 | 9.6 | 8.3 |
| Odessa | 10.1 | 9.8 | 9.6 | 9.9 | 9.0 | 8.3 | 7.5 |
| Cherkasy | 9.9 | 9.4 | 9.4 | 9.4 | 8.7 | 7.8 | 7.4 |
| Poltava | 9.9 | 9.1 | 8.8 | 9.7 | 8.4 | 7.8 | 7.3 |
| Zaporizhia | 9.5 | 9.2 | 9.2 | 9.3 | 8.9 | 8.2 | 7.5 |
| Mykolaiv | 9.4 | 9.3 | 9.1 | 9.4 | 8.7 | 8.0 | 7.9 |
| Chernihiv | 9.3 | 9.2 | 9.1 | 9.6 | 8.4 | 8.0 | 7.6 |
| Kharkiv | 9.2 | 8.9 | 8.8 | 9.2 | 8.4 | 7.6 | 7.1 |
| Donetsk | 9.1 | 8.7 | 8.6 | 9.0 | 8.2 | 7.5 | 6.6 |
| Death rate in
regional centers |
Death/2012 | Death/2011 | Death/2010 | Death/2009 | Death/2007 | Death/2005 | Death/2003 |
|---|---|---|---|---|---|---|---|
| Kherson | 15.2 | 15.6 | 14.0 | 14.2 | 14.9 | 14.8 | 14.5 |
| Luhansk | 14.2 | 14.3 | 13.6 | 13.4 | 13.8 | 14.2 | 14.1 |
| Simferopol | 14.0 | 14.8 | 13.6 | 13.8 | 15.3 | 15.3 | 15.2 |
| Sevastopol | 13.7 | 14.1 | 14.7 | 14.5 | 15.5 | 15.4 | 14.1 |
| Kropyvnytskyi | 13.7 | 13.7 | 13.8 | 14.0 | 14.4 | 14.1 | 14.1 |
| Dnipro | 13.5 | 13.7 | 14.1 | 13.8 | 15.1 | 15.1 | 16.0 |
| Donetsk | 13.4 | 13.5 | 14.0 | 13.9 | 15.2 | 15.4 | 14.7 |
| Zaporizhia | 13.2 | 13.4 | 14.2 | 13.8 | 15.0 | 14.7 | 14.2 |
| Ukraine Urban | 13.1 | 13.1 | 13.7 | 13.7 | 14.7 | 14.8 | 14.3 |
| Mykolaiv | 12.8 | 12.8 | 13.8 | 13.8 | 14.5 | 14.5 | 14.9 |
| Poltava | 12.8 | 12.6 | 13.2 | 13.0 | 13.7 | 13.6 | 13.6 |
| Sumy | 12.1 | 11.9 | 12.4 | 12.6 | 13.0 | 13.1 | 11.9 |
| Kharkiv | 12.0 | 11.8 | 12.4 | 12.2 | 13.1 | 13.1 | 13.0 |
| Odessa | 11.9 | 12.2 | 13.0 | 12.5 | 13.9 | 14.1 | 14.0 |
| Cherkasy | 11.2 | 10.7 | 11.3 | 11.2 | 11.7 | 11.7 | 11.0 |
| Chernihiv | 11.4 | 11.1 | 12.0 | 11.8 | 12.5 | 12.4 | 12.0 |
| Lviv | 11.0 | 10.8 | 10.5 | 10.8 | 11.5 | 11.4 | 11.5 |
| Zhytomyr | 10.7 | 10.9 | 11.2 | 11.1 | 12.0 | 12.2 | 11.4 |
| Uzhhorod | 10.3 | 10.2 | 10.5 | 11.3 | 12.0 | 12.4 | 10.3 |
| Kiev | 9.8 | 9.6 | 10.3 | 10.2 | 11.4 | 11.2 | 10.7 |
| Lutsk | 9.6 | 9.4 | 9.6 | 9.1 | 10.4 | 10.2 | 10.5 |
| Chernivtsi | 9.5 | 9.4 | 9.9 | 10.3 | 11.0 | 11.0 | 10.8 |
| Khmelnytskyi | 9.4 | 8.8 | 9.0 | 9.5 | 9.8 | 9.8 | 9.2 |
| Vinnytsia | 9.1 | 9.0 | 9.2 | 9.2 | 10.2 | 10.2 | 10.0 |
| Ivano-Frankivsk | 9.1 | 8.7 | 8.2 | 8.5 | 9.1 | 9.3 | 9.3 |
| Ternopil | 8.1 | 7.6 | 8.1 | 7.7 | 8.5 | 8.5 | 7.7 |
| Rivne | 7.9 | 7.8 | 8.7 | 8.6 | 9.0 | 9.2 | 8.8 |
Ethnic groups

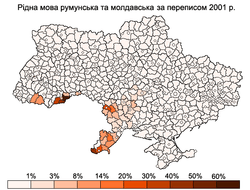
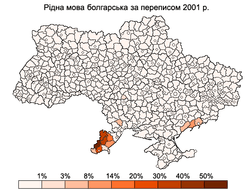
In 2001 year, Ukrainians 77.8%, Russian 17.3%, Romanian 1.1% (including Moldovan 0.8%), Belarusian 0.6%, Crimean Tatar 0.5%, Bulgarian 0.4%, Hungarian 0.3%, Polish 0.3%, Jewish 0.2%, Pontic Greeks 0.2% and other 1.6% (including Muslim Bulgarians, otherwise known as Torbesh and a microcosm of Swedes of Gammalsvenskby).[23]
Before World War II
| Ethnic group |
census 19261 | census 19392 | ||
|---|---|---|---|---|
| Number | % | Number | % | |
| Ukrainians | 23,218,860 | 80.0 | 23,667,509 | 76.5 |
| Russians | 2,677,166 | 9.2 | 4,175,299 | 13.5 |
| Jews | 1,574,428 | 5.4 | 1,532,776 | 5.0 |
| Germans | 393,924 | 1.4 | 392,458 | 1.3 |
| Poles | 476,435 | 1.6 | 357,710 | 1.2 |
| Moldavians / Romanians | 257,794 | 0.9 | 230,698 | 0.8 |
| Belarusians | 75,842 | 0.3 | 158,174 | 0.5 |
| Pontic Greeks | 104,666 | 0.4 | 107,047 | 0.4 |
| Bulgarians | 99,278 | 0.3 | 83,838 | 0.3 |
| Tatars | 22,281 | 0.1 | 55,456 | 0.2 |
| Romani | 13,578 | 0.0 | 10,443 | 0.0 |
| Others | 103,935 | 0.4 | 174,810 | 0.6 |
| Total | 29,018,187 | 30,946,218 | ||
| 1 Source: . | ||||
After World War II
| Ethnic group |
census 19591 | census 19702 | census 19793 | census 19894 | census 20015 | |||||
|---|---|---|---|---|---|---|---|---|---|---|
| Number | % | Number | % | Number | % | Number | % | Number | % | |
| Ukrainians | 32,158,493 | 76.8 | 35,283,857 | 74.9 | 36,488,951 | 73.6 | 37,419,053 | 72.7 | 37,541,693 | 77.5 |
| Russians | 7,090,813 | 16.9 | 9,126,331 | 19.4 | 10,471,602 | 21.1 | 11,355,582 | 22.1 | 8,334,141 | 17.2 |
| Belarusians | 290,890 | 0.7 | 385,847 | 0.8 | 406,098 | 0.8 | 440,045 | 0.9 | 275,763 | 0.6 |
| Moldovans | 241,650 | 0.8 | 265,902 | 0.8 | 293,576 | 0.8 | 324,525 | 0.9 | 258,619 | 0.8 |
| Crimean Tatars | 193 | 0.0 | 3,554 | 0.0 | 6,636 | 0.0 | 46,807 | 0.1 | 248,193 | 0.5 |
| Bulgarians | 219,419 | 0.5 | 234,390 | 0.5 | 238,217 | 0.5 | 233,800 | 0.5 | 204,574 | 0.4 |
| Hungarians | 149,229 | 0.4 | 157,731 | 0.3 | 164,373 | 0.3 | 163,111 | 0.3 | 156,566 | 0.3 |
| Romanians | 100,863 | 0.3 | 112,141 | 0.3 | 121,795 | 0.3 | 134,825 | 0.3 | 150,989 | 0.3 |
| Poles | 363,297 | 0.9 | 295,107 | 0.6 | 258,309 | 0.5 | 219,179 | 0.4 | 144,130 | 0.3 |
| Jews | 840,311 | 2.0 | 777,126 | 1.7 | 634,154 | 1.3 | 486,628 | 1.0 | 104,284 | 0.2 |
| Armenians | 28,024 | 0.1 | 33,439 | 0.1 | 38,646 | 0.1 | 54,200 | 0.1 | 99,894 | 0.2 |
| Greeks | 104,359 | 0.3 | 106,909 | 0.2 | 104,091 | 0.2 | 98,594 | 0.2 | 91,548 | 0.2 |
| Tatars | 61,334 | 0.2 | 72,658 | 0.2 | 83,906 | 0.2 | 86,875 | 0.2 | 73,304 | 0.2 |
| Romani | 22,515 | 0.1 | 30,091 | 0.1 | 34,411 | 0.1 | 47,917 | 0.1 | 47,587 | 0.1 |
| Azerbaijanis | 6,680 | 0.0 | 10,769 | 0.0 | 17,235 | 0.0 | 36,961 | 0.1 | 45,176 | 0.1 |
| Georgians | 11,574 | 0.0 | 14,650 | 0.0 | 16,301 | 0.0 | 23,540 | 0.1 | 34,199 | 0.1 |
| Germans | 23,243 | 0.1 | 29,871 | 0.1 | 34,139 | 0.1 | 37,849 | 0.1 | 33,302 | 0.1 |
| Gagauzs | 23,530 | 0.1 | 26,464 | 0.1 | 29,398 | 0.1 | 31,967 | 0.1 | 31,923 | 0.1 |
| Karaites | 3,301 | 0.0 | 2,596 | 0.0 | 1,845 | 0.0 | 1,404 | 0.0 | 1,196 | 0.0 |
| Others | 129,338 | 0.3 | 157,084 | 0.3 | 165,650 | 0.3 | 209,172 | 0.4 | 363,821 | 1.1 |
| Total | 41,869,046 | 47,126,517 | 49,609,333 | 51,452,034 | 48,240,902 | |||||
| 1 Source: . 2 Source: . 3 Source: . 4 Source: . 5 Source: . | ||||||||||
Ethnic Groups in Ukraine 2001 [24]
Languages
According to the latest census that took place, the following languages are common in Ukraine Ukrainian 67.5%, Russian 29.6%, Crimean Tatar, Urum (Turkic Greeks), Bulgarian, Moldovan, Polish, Hungarian. The below table gives the total population of various ethnic groups in Ukraine and the primary language, according to the 2001 census.[23]

| Ethnic group | Population | Native | Ukrainian | Russian | Other |
|---|---|---|---|---|---|
| Ukrainians | 37,541,693 | 31,970,728 | – | 5,544,729 | 532 |
| Russians | 8,334,141 | 7,993,832 | 328,152 | – | 402 |
| Moldovans | 258,619 | 181,124 | 27,775 | 45,607 | 1242 |
| Belarusians | 275,763 | 54,573 | 48,202 | 172,251 | – |
| Crimean Tatars | 248,193 | 228,373 | 184 | 15,208 | 43 |
| Bulgarians | 204,574 | 131,237 | 10,277 | 62,067 | 9 |
| Hungarians | 156,566 | 149,431 | 5,367 | 1,513 | 14 |
| Romanians | 150,989 | 138,522 | 9,367 | 2,297 | 170 |
| Poles | 144,130 | 18,660 | 102,268 | 22,495 | 390 |
| Jews | 103,591 | 3,213 | 13,924 | 85,964 | 16 |
| Armenians | 99,894 | 50,363 | 5,798 | 43,105 | 11 |
| Greeks | 91,548 | 5,829 | 4,359 | 80,992 | 9 |
| Tatars | 73,304 | 25,770 | 3,310 | 43,060 | 6 |
| Romani people | 47,587 | 21,266 | 10,039 | 6,378 | 6 |
| Azerbaijanis | 45,176 | 23,958 | 3,224 | 16,968 | 36 |
| Georgians | 34,199 | 12,539 | 2,818 | 18,589 | 15 |
| Germans | 33,302 | 4,056 | 7,360 | 21,549 | 20 |
| Gagauzs | 31,923 | 22,822 | 1,102 | 7,232 | 2 |
| Koreans | 12,711 | 2,223 | 700 | 9,662 | 0 |
| Uzbeks | 12,353 | 3,604 | 1,818 | 5,996 | 0 |
| Chuvash | 10,593 | 2,268 | 564 | 7,636 | 1 |
| Mordvinians | 9,331 | 1,473 | 646 | 7,168 | 0 |
| Turks | 8,844 | 7,923 | 133 | 567 | 0 |
| Lithuanians | 7,207 | 1,932 | 1,029 | 4,182 | 4 |
| Arabs | 6,575 | 4,071 | 897 | 1,235 | 0 |
| Slovaks | 6,397 | 2,633 | 2,665 | 335 | 0 |
| Czechs | 5,917 | 1,190 | 2,503 | 2,144 | 2 |
| Kazakhs | 5,526 | 1,041 | 822 | 3,470 | 11 |
| Latvians | 5,079 | 957 | 872 | 3,188 | 1 |
| Ossetians | 4,834 | 1,150 | 401 | 3,110 | 4 |
| Udmurts | 4,712 | 729 | 380 | 3,515 | 0 |
| Lezghinians | 4,349 | 1,507 | 330 | 2,341 | 4 |
| Tadjiks | 4,255 | 1,521 | 488 | 1,983 | 0 |
| Bashkirs | 4,253 | 843 | 336 | 2,920 | 0 |
| Mari people | 4,130 | 1,059 | 264 | 2,758 | 7 |
| Thai | 3,850 | 3,641 | 29 | 164 | 0 |
| Turkmens | 3,709 | 719 | 1,079 | 1,392 | 0 |
| Albanians | 3,308 | 1,740 | 301 | 1,181 | 0 |
| Assyrians | 3,143 | 883 | 408 | 1,730 | 0 |
| Chechens | 2,877 | 1,581 | 212 | 977 | 0 |
| Estonians | 2,868 | 416 | 321 | 2,107 | 4 |
| Chinese people | 2,213 | 1,817 | 73 | 307 | 0 |
| Kurds | 2,088 | 1,173 | 236 | 396 | 0 |
| Darghins | 1,610 | 409 | 199 | 955 | 0 |
| Komis | 1,545 | 330 | 127 | 1,046 | 0 |
| Karelians | 1,522 | 96 | 145 | 1,244 | 1 |
| Avars | 1,496 | 582 | 121 | 761 | 0 |
| Indo-Pakistanis | 1,483 | 1,092 | 26 | 192 | 0 |
| Abkhazians | 1,458 | 317 | 268 | 797 | 0 |
| Karaites | 1,196 | 72 | 160 | 931 | 0 |
| Komi-Permians | 1,165 | 160 | 79 | 898 | 1 |
| Kyrgyz people | 1,128 | 208 | 221 | 617 | 19 |
| Laks | 1,019 | 199 | 271 | 514 | 13 |
| Afghans | 1,008 | 551 | 60 | 213 | 0 |
| other | 3,228 | 1,027 | 144 | 790 | 0 |
| NA | 188,639 | 0 | 1,108 | 1,844 | 1 |
 |
 |
 |
|||
| Ukrainian | Russian | Romanian and Moldovan |
 |
 |
 |
|||
| Crimean-tatar | Bulgarian | Hungarian |
Religion
A 2016 survey conducted by the Razumkov Centre found that 70% of the population declared themselves believers in any religion, while 6.3% declared themselves non-believers, and 2.7% declared to be atheists.[25] Of the total Ukraian population, 81.9% declared to be Christians, comprising a 63.4% who declared to be Orthodox, 8.5% Greek Rite Catholics, 7.1% simply christians, 1.9% Protestants, and 1.0% Latin Rite Catholics. Islam comprises 1.1% of the population, while Judaism and Hinduism were the religions of 0.2% of the population each. A further 16.3% of the population believed in some other religion not identifying in one of those listed hitherto; it may comprise Rodnovery and other faiths.[25]
Among those Ukrainians who declared to believe in Orthodoxy, 38.1% declared to be members of the Ukrainian Orthodox Church of the Kievan Patriarchate (a body that is not canonically recognized by the Eastern Orthodox Church), while 23.0% declared to be members of the Ukrainian Orthodox Church of the Moscovian Patriarchate (which is an autonomous Orthodox church under the Russian Orthodox Church). A further 2.7% were members of the Ukrainian Autocephalous Orthodox Church, which, like the Kievan Patriarchate, is not recognized by the Eastern Orthodox Church.[26] Among the remaining Orthodox Ukrainians, 32.3% declared to be "simply Orthodox", without affiliation to any patriarchate, while a further 3.1% declared that they "did not know" which patriarchate or Orthodox church they belonged to.[25]
Regional differences
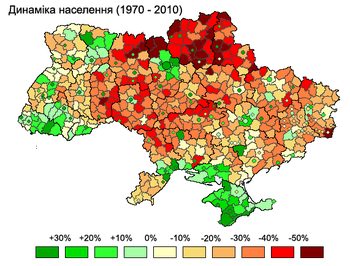
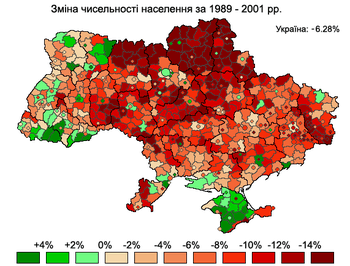
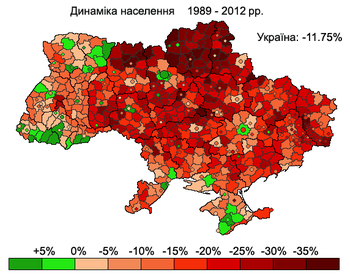
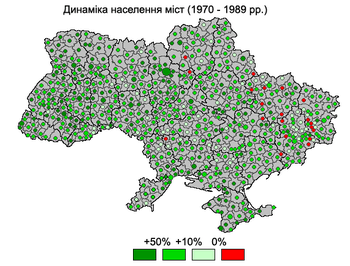
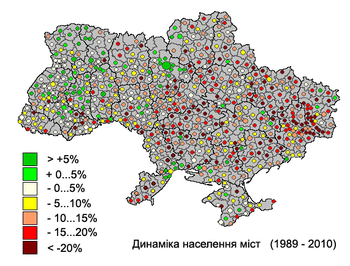
Regional differences in population change
Between the Soviet census of 1989 and the Ukrainian census of 2001, Ukraine's population declined from 51,706,600 to 48,457,020,[27] a loss of 2,926,700 people or 5.7% of the 1989 population. However, this trend has been quite uneven and varied regionally. Two regions in western Ukraine — Rivne and Zakarpattia, saw slight population increases of .3% and .5% respectively. A third western Ukrainian region, Volyn, lost less than .1% of its population between 1989 and 2001.[27] Collectively, between 1989 and 2001 the seven westernmost regions of Ukraine lost 167,500 people or 1.7% of their 1989 population. The total population of these regions in 2001 was 9,593,800.[27]
Between 1989 and 2001, the population of Kiev City increased by .3% [27] due to positive net-migration. Outside the capital, the central, southern and eastern regions experienced a severe decline in population. Between 1989 and 2001, the Donetsk region lost 491,300 people or 9.2% of its 1989 population, and neighbouring Luhansk region lost 11% of its population.[27] Chernihiv region, in central Ukraine northeast of Kiev, lost 170,600 people or 12% of its 1989 population, the highest percentage loss in of any region in Ukraine. In southern Ukraine, Odessa region lost 173,600 people, or 6.6% of its 1989 population. By 2001, Crimea's population declined by 29,900 people, representing only 1.4% of the 1989 population.[27]
However, this was due to the influx of approximately 200,000 Crimean Tatars – a number equivalent to approximately 10% of Crimea's 1989 population – who arrived in Crimea after 1989 and whose population in that region increased by a factor of 6.4 from 38,000 to 243,400 between 1989 and 2001.[28] Collectively, the net population loss in the regions of Ukraine outside the westernmost regions was 2,759,200 people or 6.6% of the 1989 population. The total population of these regions in 2001 was 39,186,100.[27]
Thus, from 1989–2001 the pattern of population change was one of slight growth in Kiev, slight declines in western Ukraine, large declines in eastern, central and southern Ukraine and slight decline in Crimea due to a large influx of Crimean Tatars.
 |
 |
 |
|||
| All population, 2012 | Urban population, 2009 | Rural population, 2009 |
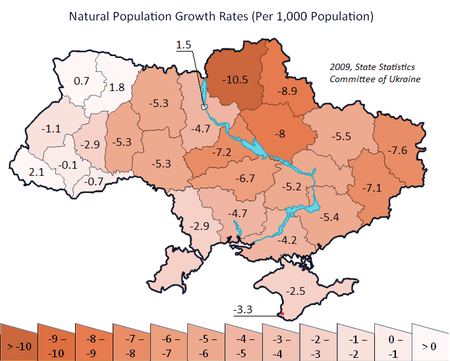
Regional differences in birth and fertility rates

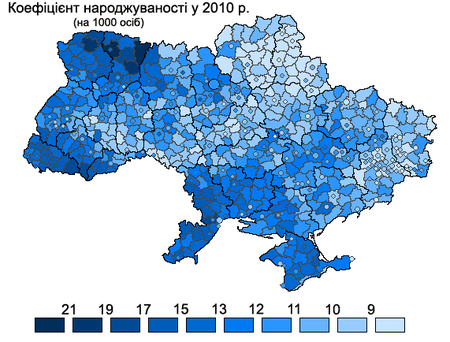
Ukraine's total fertility rate is one of the lowest in Europe.[29][30] However, significant regional differences in birth rates may account for some of the demographic differences. In the third quarter of 2007, for instance, the highest birth rate among Ukrainian regions occurred in Volyn Oblast, with a birth rate of 13.4/1,000 people, compared to the Ukrainian country-wide average of 9.6/1,000 people.[31] Volyn's birthrate is higher than the average birth rate of any European country with the exceptions of Iceland and Albania.[32]
In 2007, for the first time since 1990, five Ukrainian regions (Zakarpattia Oblast, Rivne Oblast, Volyn Oblast, Lviv Oblast, and Kiev Oblast) experienced more births than deaths.[33] This demonstrates a positive trend of increasing birthrates in the last couple of years throughout Ukraine. The ratio of births to deaths in those regions in 2007 was 119%, 117%, 110%, 100.7%, and 108%, respectively.[33]
With the exception of Kiev region, all of the regions with more births than deaths were in the less industrially developed regions of western Ukraine. According to a spokesperson for Ukraine's Ministry of Justice, the overall ratio of births to deaths in Ukraine had improved from 1 to 1.7 in 2004–2005 to 1 to 1.4 in 2008. However, the worst birth to death ratios in the country were in the eastern and central oblasts of Donetsk, Luhansk, Cherkasy and Poltava. In these regions, for every birth there were 2.1 deaths.[34]
Notably, western Ukraine never experienced the Holodomor, as Poland, Czechoslovakia, and Romania ruled it at the time, helping to explain the better demographics there, as the rural population was never devastated. Specifically, during the time of the Holodomor, Poland ruled Ivano-Frankivsk, Lviv, Rivne, Ternopil, and Volyn Oblasts, whereas Zakarpattia Oblast was under Czechoslovak rule, and Romania controlled Chernivtsi Oblast and the Budjak section of Odessa Oblast.
Abortion behavior in the North, South, East and Center regions of Ukraine are relatively homogeneous while the Western region differs greatly. Overall, the abortion rate in western Ukraine is three times lower than in other regions; however this is not due to an increased use of modern contraceptive methods in the West, but simply due to the fact that pregnant women in the Western regions are more likely to keep their babies.[35] Donetsk and Dniproptrovsk oblasts in eastern and central Ukraine have the country's highest rate of abortions.[36]
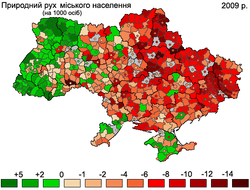
Regional differences and death rates and health
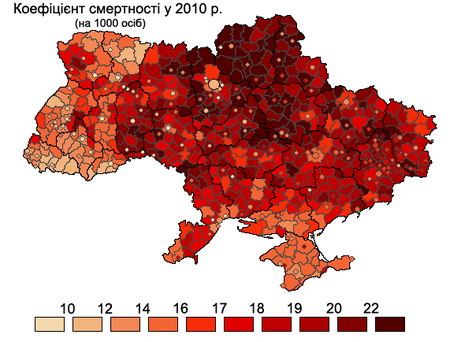
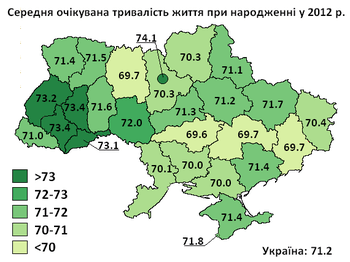
Death rates also vary widely by region; Eastern and southern Ukraine have the highest death rates in the country, and the life expectancy for children born in Chernihiv, Dnipropetrovsk, Donetsk, Kherson, Kropyvnytskyi, Luhansk, Mikolaiv, and Odessa regions is 1.5 years lower than the national average.[37]
Ukraine had a suicide rate of 29.6 per 100,000 population in 1998, a significant increase from the suicide rate of 19 per 100,000 in 1988. Suicides are more frequent in the industrially developed regions and in the rural areas of the country than in the cities; In western Ukraine, the suicide rate was lower than the national average at 11.1 per 100,000.[38]
The Southern and eastern Ukrainian regions also suffer from the highest rates of HIV and AIDS, which impacts life expectancy. In late 2000, 60% of all AIDS cases in Ukraine were concentrated in the Odessa, Dnipropetrovsk, and Donetsk regions.[39] A major reason for this is the fact that the urbanized and industrialized regions in the East and South of Ukraine suffered most from the economic crisis in the 1990s, which in turn led to the spread of unemployment, alcoholism, and drug abuse, thus setting the conditions for wider spread of the epidemic.[40]
Regional differences in income
In terms of income, the rural western and central regions of Ukraine are the poorest while Kiev and the industrialized eastern regions of Ukraine are the wealthiest. In December 2010 the average monthly income in Ukraine was 2629 hryvnias. The poorest regions in Ukraine, Volyn and Chernihiv, had monthly incomes of 1995 and 1951 hryvnias, respectively. In contrast, the monthly income in the city of Kiev was 4174 hryvnias per month, the city of Sevastopol 2712 hryvnias per month, and in Kiev region was 2647 per month. Outside of the capital and the city of Sevastopol, the wealthiest regions were Donetsk and Luhansk, whose monthly incomes were 2654 and 2631 hryvnias per month, respectively.[41]
In terms of poverty rates, the western and southern regions of Ukraine (particularly rural areas within those regions) have the country's highest poverty rates while Ukraine's eastern regions have the lowest poverty rates. In 2001, 39 percent of Ukraine's population could be defined as poor when the World Bank's poverty threshold of a dollar per day per capita was used. According to these standards, 49 percent of rural western Ukrainians and 45 percent of urban western Ukrainians were poor. In southern Ukraine, the percentages of poor were 51 and 40 percent, respectively. In contrast, 35% of urban and rural Ukrainians were poor based on per capita income less than one dollar per day in the regions of Eastern Ukraine. When poverty was measured according to the percentage of the population who spent 80% or more of their income on food, regional differences shrank somewhat. In the western regions of Ukraine, 28 percent of rural residents and 9 percent of urban residents spent 80% of their income or more on food. In Ukraine's eastern regions, 19 percent of rural and 11 percent of urban residents spent 80% or more of their income on food.[42]
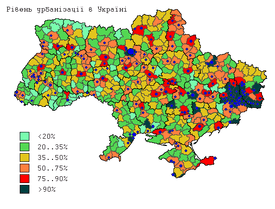
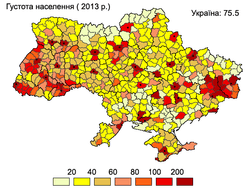
Urbanization
 |
 |
 | ||
| Urbanization rate, 2011 | Population density, 2011 | Median population of rural settlements, 2011 |
Migration
Ukraine is the major source of migrants in Russia and many of the member states of the European Union. During the 1990s and early 2000s, Ukraine's sputtering economy and political inestability contributed to rising emigration, especially to nearby Russia, Poland and Hungary, but also to other States such as Italy, Portugal, Spain, Turkey, Israel, Russia and Canada. Although estimates vary, approximately two to three million Ukrainian citizens are currently working abroad, most of them illegally, in construction, service, housekeeping, and agriculture industries. Eastern Ukrainians are likely to immigrate to Russia while western Ukrainians are likely to move to the E.U.
Between 1991 and 2004, the government counted 2,537,400 individuals who emigrated; 1,897,500 moved to other post-Soviet states, and 639,900 moved to other, mainly Western, states.[43]
By the early 2000s, Ukrainian embassies reported that 300,000 Ukrainian citizens were working in Poland, 200,000 in Italy, approximately 200,000 in the Czech Republic, 150,000 in Portugal, 100,000 in Spain, 35,000 in Turkey, 20,000 in the United States and small significant numbers in Austria, Belgium, France, Germany, Greece, Sweden, Switzerland and the UK. The largest number of Ukrainian workers abroad, about one million, are in the Russian Federation. Since 1992, 232,072 persons born in Ukraine have emigrated to the US.
From the point of view of the economic impact on natives, more appropriate than the absolute numbers is the volume of immigration as a proportion of the native population. Russia have the highest rate of Ukrainian emigrants as a proportion of the native population, while the much larger Italy has the largest absolute confirmed number of Ukrainian emigrants (leaving aside Poland Portugal and the Czech Republic , for which there is conflicting data).
See also
- Health in Ukraine
- Demographic history of Crimea
- Ethnic groups in Ukraine
General:
References
- 1 2 "Population as of January 1, 2018. Average annual populations in 2017: Excluding the temporarily occupied territories of the Autonomous Republic of Crimea, and the city of Sevastopol". State Statistics Service of Ukraine. 23 February 2018. Retrieved 14 September 2018.
- ↑ Population census of Ukraine, 2001
- ↑ "All-Ukrainian population census". State Statistics Service of Ukraine. 2016. Retrieved 22 April 2016.
- ↑ "Ukraine's Demographic Reality". Population Reference Bureau.
- ↑ ПРЕДВАРИТЕЛЬНАЯ ОЦЕНКА ЧИСЛЕННОСТИ ПОСТОЯННОГО НАСЕЛЕНИЯ на 1 января 2017 г. и в среднем за 2016 г. [Estimated population as of 1 January 2017 and on the average for 2016] (XLS). Russian Federal State Statistics Service (in Russian). 2017. Retrieved 21 April 2017.
- ↑ Ukraine, Orest Subtelny, page 152, 2000
- ↑ "ru:Институт демографии Национального исследовательского университета 'Высшая школа экономики'" [Institute of Demography of the National Research University "Graduate School of Economics']. Demoscope.ru (in Russian). 21 March 2013. ISSN 1726-2887. Retrieved 10 December 2016.
- ↑ Brief description of Zenon Kuzela (Kuzelya) (in English)
- ↑ Ukraine: A Concise Encyclopedia Vol. 1, Book by Volodymyr Kubiyovych; University of Toronto Press, 1963
- ↑ Posted availability of the book
- ↑ Statistical Yearbooks of the Russian Empire
- ↑ Number of live births, deaths and natural increase (decrease) of the population (0,1)
- ↑ Demographic yearbook, 2001 (PDF). New York: United Nations. 2003. ISBN 92-1-051094-1. Retrieved 22 April 2016.
- ↑ Общий коэффициент смертности (на 1000 населения): Украина: 1950-2013 [Crude death rate (per 1,000 people): Ukraine: 1950-2013]. Demoscope Weekly (in Russian). Archived from the original on 21 March 2016. Retrieved 22 April 2016.
- ↑ Державна служба статистикі України [State Statistics Committee of Ukraine]. State Statistics Committee of Ukraine (in Ukrainian). Archived from the original on 15 September 2002. Retrieved 14 December 2009.
- ↑ Природний рух населення у січні–серпні 2018 року1|accessdate=15 September 2018}}
- ↑ "World Population Prospects - Population Division - United Nations". esa.un.org. Retrieved 2018-08-26.
- ↑ Населення та міграція 2016
- ↑ State Statistics Committee of Ukraine – Natural increase in population in 2010 Retrieved on 20 May 2011
- 1 2 3 "Ukraine Population 2018", World Population Review
- ↑ "The World FactBook - Ukraine", The World Factbook, July 12, 2018
- ↑ State Statistics Committee of Ukraine – Population, as of 1 January 2013. Average annual populations 2012
- 1 2 Population census 2001: Population by nationality Archived 15 March 2007 at the Wayback Machine.
- ↑ Ukraine PEOPLE 2017 SOURCE: 2017 CIA WORLD FACTBOOK AND OTHER SOURCES
- 1 2 3 РЕЛІГІЯ, ЦЕРКВА, СУСПІЛЬСТВО І ДЕРЖАВА: ДВА РОКИ ПІСЛЯ МАЙДАНУ (Religion, Church, Society and State: Two Years after Maidan), 2016 report by Razumkov Center in collaboration with the All-Ukrainian Council of Churches. pp. 27-29.
- ↑ "State Department of Ukraine on Religious". 2003 Statistical report. Archived from the original on 4 December 2004. Retrieved 27 January 2008.
- 1 2 3 4 5 6 7 "About number and composition population of Ukraine by data: All-Ukrainian census of the population 2001". State Statistics Committee of Ukraine. 2003. Archived from the original on 14 June 2007.
- ↑ About number and composition population of Autonomous Republic of Crimea by data All-Ukrainian population census Archived 4 December 2007 at the Wayback Machine.
- ↑ Рождаемость в Украине самая низкая в Европе, Demoscope.ru, 16–29 April 2007 (in Russian)
- ↑ United Nations Department of Economic and Social Affairs, Population Division (2007). "United Nations World Population Prospects: 2006 revision, Table A.15" (PDF). New York: UN. Retrieved 26 September 2010.
- ↑ MIGnews: Volyn Region – Fertility Leader in Ukraine, 10 October 2007. Retrieved 19 October 2007.
- ↑ CIA world factbook.
- 1 2 Ukrainian News: Birth Rate Exceeds Death Rate in Five Regions of Ukraine First Since 1990s 4 October 2007. Retrieved 19 October 2007.
- ↑ Inna Filipenko. The Day. Births and deaths: A record-breaking half million children were born in Ukraine last year. #3. 3 February 2009. Retrieved 8 December 2009.
- ↑ Natalia LEvchuk, Brienna Perelli-Harris. (2009). Declining Fertility in UKraine: What is the role of abortion and contraception? Max Planck Institute for Demographic Research
- ↑ World Bank Report, Chapter 3: Demographic Forecast Under the HIV/AIDS Epidemic
- ↑ Unicef. (2004). The Situation of Children and Young People at the Regional Level in Ukraine Prepared by Ukraine Country Statistical Team Co-ordinator: Iryna Kalachova State Statistic Committee, Kiev
- ↑ Kryzhanovskaya, Ludmila; Pilyagina, Galina. (1999). Suicidal behavior in the Ukraine, 1988–1998.. Crisis: The Journal of Crisis Intervention and Suicide Prevention. Vol 20(4), 1999, 184-190.
- ↑ The International Encyclopedia of Sexuality of the Kinsey Institute. Tamara V. Hovorun, Ph.D., and Borys M. Vornyk, Ph.D. (Medicine). Rewritten and updated in 2003 by T. V. Hovorun and B. M. Vornyk(2003) Ukraine.
- ↑ Vulnerability Assessment of People Living With HIV (PLHIV) in Ukraine United Nations Development Programme, page 24 – Retrieved on 8 December 2009
- ↑ Average Income in Ukraine Per Region Per Month, 2010 State Statistics Committee of Ukraine
- ↑ Institute for Economic Research and Policy Consulting, German Advisory Group on Economic Reform
- ↑ By Olena Malynovska, National Institute for International Security Problems, Kyiv Caught Between East and West, Ukraine Struggles with Its Migration Policy
External links
- State Committee for Statistics of Ukraine, official website at the Library of Congress Web Archives (archived 2002-09-15)
- Trafficking in and enslavement of women Follow-up to the Fourth World Conference on Women, 2–13 March 1998
- Migration News, 2001 University of California, Davis
- The demographic situation in Ukraine: present state. tendencies, and predictions, Razumkov Centre
- On the status of observance and protection of the rights of Ukrainian citizens abroad the Special Report of the Ukrainian Parliament Commissioner for Human Rights
- News on Trafficking of Ukrainian Women, 2000-01 Trafficking in Women from Ukraine Research Project, University of Rhode Island
- Caught Between East and West, Ukraine Struggles with Its Migration Policy By Olena Malynovska, National Institute for International Security Problems, Kyiv, January 2006
- Emigration from Ukraine, 23 October 2003 The Economist (subscription required)
- Meslé, France; Pison, Gilles; Vallin, Jacques (2005). "France-Ukraine: Demographic Twins Separated by History" (PDF). Population and societies (413): 1–4. Archived from the original (PDF) on 19 May 2011.
- Vallin, Jacques; Meslé, France; Adamets, Serguei; Pyrozhkov, Serhii (2002). "A New Estimate of Ukrainian Population Losses during the Crises of the 1930s and 1940s" (PDF). Population Studies. 56 (3): 249–264. doi:10.1080/00324720215934. PMID 12553326.
- Mortality and Causes of Death in 20th-Century Ukraine