Demographics of Portugal
| Historical population | ||
|---|---|---|
| Year | Pop. | ±% |
| 1422 | 1043274 (Adult male population) | — |
| 1527 | 1262376 (Adult male population) | — |
| 1636 | 1100000 (Adult male population) | — |
| 1736 | 2,143,368 | — |
| 1770 | 2,850,444 | +33.0% |
| 1776 | 3,352,310 | +17.6% |
| 1801 | 2,931,930 | −12.5% |
| 1811 | 2,876,602 | −1.9% |
| 1838 | 3,200,000 | +11.2% |
| 1849 | 3,411,454 | +6.6% |
| 1864 | 4,188,419 | +22.8% |
| 1878 | 4,550,699 | +8.6% |
| 1890 | 5,049,729 | +11.0% |
| 1900 | 5,423,132 | +7.4% |
| 1911 | 5,969,056 | +10.1% |
| 1920 | 6,032,991 | +1.1% |
| 1930 | 6,825,883 | +13.1% |
| 1940 | 7,722,152 | +13.1% |
| 1950 | 8,510,240 | +10.2% |
| 1960 | 8,851,240 | +4.0% |
| 1970 | 8,648,369 | −2.3% |
| 1981 | 9,833,041 | +13.7% |
| 1991 | 9,862,540 | +0.3% |
| 2001 | 10,356,117 | +5.0% |
| 2011 | 10,562,178 | +2.0% |
| 2017* | 10,291,027 | −2.6% |
| Source: INE 2011[1][2][3] *Estimate | ||
This article is about the demographic features of the population of Portugal, including population density, ethnicity, education level, health of the populace, economic status, religious affiliations and other aspects of the population.
In 2010 Portugal had 10,572,721 inhabitants.
Portugal is a fairly linguistically and religiously homogeneous country. Ethnically, the Portuguese people are mainly a combination of ancient paleolithic populations, and the proto-Celtic, Celtic and Iberian tribes, para-Celtic Lusitanians. Some other groups, like the Romans, Germanic (Visigoths, Suevi, Buri, Alans and Vandals) and later the Moorish (Berber), Sephardic Jewish, and the French also passed through the country.
Today, Ukrainians, Moldovans, Romanians, Russians, Bulgarians, Brazilians, and Venezuelans form the major foreign communities in the country. Members of PALOP countries (Portuguese-speaking African countries) are also immigrants and form communities in the country..[4] Portuguese is spoken throughout the country, with only the villages of Miranda do Douro's Mirandese language recognised as a locally co-official language.
Total Fertility Rate from 1850 to 1899
The total fertility rate is the number of children born per woman. It is based on fairly good data for the entire period. Sources: Our World In Data and Gapminder Foundation.[5]
| Years | 1850 | 1851 | 1852 | 1853 | 1854 | 1855 | 1856 | 1857 | 1858 | 1859 | 1860[5] |
|---|---|---|---|---|---|---|---|---|---|---|---|
| Total Fertility Rate in Portugal | 4.5 | 4.47 | 4.44 | 4.41 | 4.38 | 4.35 | 4.33 | 4.3 | 4.27 | 4.24 | 4.21 |
| Years | 1861 | 1862 | 1863 | 1864 | 1865 | 1866 | 1867 | 1868 | 1869 | 1870[5] |
|---|---|---|---|---|---|---|---|---|---|---|
| Total Fertility Rate in Portugal | 4.18 | 4.15 | 4.12 | 4.09 | 4.1 | 4.11 | 4.12 | 4.14 | 4.15 | 4.16 |
| Years | 1871 | 1872 | 1873 | 1874 | 1875 | 1876 | 1877 | 1878 | 1879 | 1880[5] |
|---|---|---|---|---|---|---|---|---|---|---|
| Total Fertility Rate in Portugal | 4.17 | 4.18 | 4.19 | 4.2 | 4.21 | 4.22 | 4.23 | 4.24 | 4.23 | 4.22 |
| Years | 1881 | 1882 | 1883 | 1884 | 1885 | 1886 | 1887 | 1888 | 1889 | 1890[5] |
|---|---|---|---|---|---|---|---|---|---|---|
| Total Fertility Rate in Portugal | 4.91 | 4.19 | 4.18 | 4.17 | 4.16 | 4.15 | 4.38 | 4.3 | 4.38 | 4.24 |
| Years | 1891 | 1892 | 1893 | 1894 | 1895 | 1896 | 1897 | 1898 | 1899[5] |
|---|---|---|---|---|---|---|---|---|---|
| Total Fertility Rate in Portugal | 4.16 | 4.06 | 4.15 | 3.86 | 3.9 | 3.9 | 3.95 | 3.93 | 3.89 |
Vital statistics since 1900


| [6][7][8][9] | Average population | Live births | Deaths | Natural change | Crude birth rate (per 1000) | Crude death rate (per 1000) | Natural change (per 1000) | Total fertility rates[fn 1][5][10][11][12] |
|---|---|---|---|---|---|---|---|---|
| 1900 | 5,410,000 | 165 245 | 110 330 | 54 915 | 30.5 | 20.3 | 10.2 | 3.96 |
| 1901 | 5,460,000 | 170 773 | 114 130 | 56 643 | 31.3 | 20.9 | 10.4 | 4.07 |
| 1902 | 5,490,000 | 176 029 | 108 378 | 67 651 | 32.0 | 19.7 | 12.4 | 4.16 |
| 1903 | 5,560,000 | 183 138 | 111 685 | 71 453 | 33.0 | 20.1 | 12.8 | 4.29 |
| 1904 | 5,600,000 | 176 726 | 105 572 | 71 154 | 31.6 | 18.9 | 12.7 | 4.11 |
| 1905 | 5,660,000 | 179 746 | 112 756 | 66 990 | 31.8 | 20.0 | 11.8 | 4.13 |
| 1906 | 5,690,000 | 182 920 | 125 243 | 57 677 | 32.1 | 22.0 | 10.2 | 4.17 |
| 1907 | 5,730,000 | 176 417 | 113 254 | 63 163 | 30.7 | 19.7 | 11.0 | 3.99 |
| 1908 | 5,790,000 | 175 268 | 115 876 | 59 392 | 30.3 | 20.0 | 10.2 | 3.94 |
| 1909 | 5,850,000 | 174 753 | 112 421 | 62 332 | 29.9 | 19.2 | 10.8 | 3.89 |
| 1910 | 5,890,000 | 186 953 | 113 161 | 73 792 | 31.7 | 19.2 | 12.6 | 4.12 |
| 1911 | 5,960,000 | 230 033 | 130 900 | 99 133 | 38.6 | 22.0 | 16.6 | 5.02 |
| 1912 | 5,960,000 | 207 870 | 119 578 | 88 292 | 34.9 | 20.1 | 14.8 | 4.54 |
| 1913 | 5,970,000 | 193 906 | 123 054 | 70 852 | 32.5 | 20.6 | 11.9 | 4.22 |
| 1914 | 5,980,000 | 188 479 | 115 526 | 72 953 | 31.5 | 19.3 | 12.0 | 4.09 |
| 1915 | 5,990,000 | 195 225 | 122 513 | 72 712 | 32.6 | 20.5 | 12.0 | 4.24 |
| 1916 | 6,000,000 | 192 780 | 129 389 | 63 391 | 32.1 | 21.6 | 10.7 | 4.17 |
| 1917 | 6,000,000 | 188 391 | 134 082 | 54 309 | 31.4 | 22.3 | 9.0 | 4.08 |
| 1918 | 6,020,000 | 178 687 | 248 978 | -70 291 | 29.7 | 41.4 | -11.6 | 3.86 |
| 1919 | 6,020,000 | 166 162 | 152 856 | 13 306 | 27.6 | 25.4 | 2.2 | 3.59 |
| 1920 | 6,040,000 | 202 908 | 142 862 | 60 046 | 33.6 | 23.7 | 9.9 | 4.37 |
| 1921 | 6,070,000 | 197 022 | 126 316 | 70 706 | 32.4 | 20.8 | 11.7 | 4.21 |
| 1922 | 6,170,000 | 203 727 | 125 747 | 77 980 | 33.1 | 20.4 | 12.6 | 4.3 |
| 1923 | 6,240,000 | 207 172 | 141 775 | 65 397 | 33.2 | 22.7 | 10.4 | 4.32 |
| 1924 | 6,310,000 | 207 440 | 126 052 | 81 388 | 32.8 | 20.0 | 12.8 | 4.26 |
| 1925 | 6,370,000 | 208 434 | 117 413 | 91 021 | 32.6 | 18.4 | 14.3 | 4.24 |
| 1926 | 6,470,000 | 214 633 | 127 959 | 86 674 | 33.5 | 19.8 | 13.8 | 4.36 |
| 1927 | 6,550,000 | 199 399 | 123 382 | 76 017 | 31.0 | 18.8 | 12.2 | 4.03 |
| 1928 | 6,620,000 | 211 314 | 124 088 | 87 226 | 31.9 | 18.7 | 13.1 | 4.15 |
| 1929 | 6,720,000 | 200 874 | 118 824 | 82 050 | 29.9 | 17.7 | 12.2 | 3.89 |
| 1930 | 6,804,000 | 202 529 | 116 352 | 86 177 | 29.7 | 17.1 | 12.8 | 3.86 |
| 1931 | 6,860,000 | 204 120 | 115 225 | 88 895 | 29.7 | 16.8 | 13.0 | 3.86 |
| 1932 | 6,968,000 | 208 062 | 118 895 | 89 167 | 29.9 | 17.1 | 12.8 | 3.89 |
| 1933 | 7,057,000 | 204 315 | 120 996 | 83 319 | 28.9 | 17.2 | 11.8 | 3.88 |
| 1934 | 7,147,000 | 203 158 | 118 539 | 84 619 | 28.4 | 16.6 | 11.8 | 3.74 |
| 1935 | 7,237,000 | 203 943 | 123 051 | 80 892 | 28.2 | 17.0 | 11.2 | 3.59 |
| 1936 | 7,326,000 | 205 615 | 119 003 | 86 612 | 28.1 | 16.2 | 11.8 | 3.45 |
| 1937 | 7,416,000 | 198 217 | 117 291 | 80 926 | 26.7 | 15.8 | 10.9 | 3.39 |
| 1938 | 7,506,000 | 199 467 | 115 331 | 84 136 | 26.6 | 15.4 | 11.2 | 3.34 |
| 1939 | 7,595,000 | 198 888 | 116 075 | 82 813 | 26.2 | 15.3 | 10.9 | 3.28 |
| 1940 | 7,696,000 | 187 892 | 120 486 | 67 406 | 24.4 | 15.7 | 8.8 | 3.22 |
| 1941 | 7,750,000 | 184 336 | 134 937 | 49 399 | 23.8 | 17.4 | 6.4 | 3.12 |
| 1942 | 7,810,000 | 187 503 | 126 531 | 60 972 | 24.0 | 16.1 | 7.8 | 3.14 |
| 1943 | 7,890,000 | 198 101 | 121 887 | 76 214 | 25.1 | 15.3 | 9.7 | 3.27 |
| 1944 | 7,960,000 | 201 373 | 119 275 | 82 098 | 25.3 | 14.8 | 10.3 | 3.28 |
| 1945 | 8,040,000 | 209 131 | 115 596 | 93 535 | 26.0 | 14.2 | 11.6 | 3.39 |
| 1946 | 8,100,000 | 205 825 | 120 800 | 85 025 | 25.4 | 14.9 | 10.5 | 3.29 |
| 1947 | 8,180,000 | 200 488 | 110 437 | 90 051 | 24.5 | 13.5 | 11.0 | 3.14 |
| 1948 | 8,262,000 | 220 981 | 107 576 | 113 405 | 26.7 | 13.0 | 13.7 | 3.42 |
| 1949 | 8,333,000 | 212 260 | 117 499 | 94 761 | 25.5 | 14.1 | 11.4 | 3.23 |
| 1950 | 8,405,000 | 205 163 | 102 798 | 102 365 | 24.4 | 12.2 | 12.2 | 3.1 |
| 1951 | 8,459,000 | 207 870 | 105 473 | 102 397 | 24.6 | 12.5 | 12.1 | 3.1 |
| 1952 | 8,496,000 | 211 213 | 100 486 | 110 727 | 24.9 | 11.8 | 13.0 | 3.1 |
| 1953 | 8,534,000 | 202 135 | 97 460 | 104 675 | 23.7 | 11.4 | 12.3 | 3.1 |
| 1954 | 8,570,000 | 197 536 | 95 088 | 102 448 | 23.0 | 11.1 | 12.0 | 3.1 |
| 1955 | 8,610,000 | 209 790 | 99 472 | 110 318 | 24.4 | 11.6 | 12.8 | 3.1 |
| 1956 | 8,647,000 | 202 667 | 106 919 | 95 748 | 23.4 | 12.4 | 11.1 | 3.11 |
| 1957 | 8,680,000 | 211 494 | 101 784 | 109 710 | 24.4 | 11.7 | 12.6 | 3.12 |
| 1958 | 8,725,000 | 212 467 | 91 891 | 120 576 | 24.4 | 10.5 | 13.8 | 3.13 |
| 1959 | 8,826,000 | 213 062 | 97 754 | 115 308 | 24.3 | 11.1 | 13.1 | 3.15 |
| 1960 | 8,865,000 | 213 895 | 95 007 | 118 888 | 23.9 | 10.6 | 13.3 | 3.16 |
| 1961 | 8,929,000 | 217 516 | 99 590 | 117 926 | 24.3 | 11.1 | 13.2 | 3.18 |
| 1962 | 8,994,000 | 220 200 | 96 864 | 123 336 | 24.4 | 10.7 | 13.7 | 3.18 |
| 1963 | 9,031,000 | 212 152 | 98 011 | 114 141 | 23.4 | 10.8 | 12.6 | 3.19 |
| 1964 | 9,034,000 | 217 136 | 96 878 | 120 258 | 23.8 | 10.6 | 13.2 | 3.19 |
| 1965 | 8,999,000 | 210 299 | 95 187 | 115 112 | 23.0 | 10.4 | 12.6 | 3.18 |
| 1966 | 8,931,000 | 206 940 | 100 088 | 106 852 | 22.7 | 11.0 | 11.7 | 3.16 |
| 1967 | 8,875,000 | 202 061 | 95 816 | 106 245 | 22.2 | 10.5 | 11.7 | 3.13 |
| 1968 | 8,837,000 | 194 962 | 94 661 | 100 301 | 21.4 | 10.4 | 11.0 | 3.09 |
| 1969 | 8,758,000 | 189 739 | 101 088 | 88 651 | 20.9 | 11.1 | 9.7 | 3.05 |
| 1970 | 8,663,000 | 180 690 | 93 093 | 87 597 | 20.4 | 10.5 | 9.9 | 2.99 |
| 1971 | 8,624,000 | 181 243 | 98 688 | 82 555 | 21.0 | 11.4 | 9.6 | 2.94 |
| 1972 | 8,637,000 | 174 685 | 90 315 | 84 370 | 20.2 | 10.5 | 9.8 | 2.88 |
| 1973 | 8,630,000 | 172 324 | 95 435 | 76 889 | 20.0 | 11.1 | 8.9 | 2.83 |
| 1974 | 8,879,000 | 171 979 | 96 928 | 75 051 | 19.6 | 11.1 | 8.6 | 2.77 |
| 1975 | 9,308,000 | 179 648 | 97 936 | 81 712 | 19.8 | 10.8 | 9.0 | 2.71 |
| 1976 | 9,404,000 | 186 712 | 102 027 | 84 685 | 20.0 | 10.9 | 9.1 | 2.65 |
| 1977 | 9,508,000 | 181 064 | 96 111 | 84 953 | 19.2 | 10.2 | 9.0 | 2.57 |
| 1978 | 9,609,000 | 167 467 | 96 194 | 71 273 | 17.5 | 10.1 | 7.5 | 2.48 |
| 1979 | 9,714,000 | 160 311 | 92 732 | 67 579 | 16.6 | 9.6 | 7.0 | 2.39 |
| 1980 | 9,819,000 | 158 352 | 94 971 | 63 381 | 16.2 | 9.7 | 6.5 | 2.29 |
| 1981 | 9,884,000 | 152 102 | 95 892 | 56 210 | 15.4 | 9.7 | 5.7 | 2.18 |
| 1982 | 9,940,000 | 151 029 | 92 551 | 58 478 | 15.3 | 9.4 | 5.9 | 2.07 |
| 1983 | 9,976,000 | 144 327 | 96 367 | 47 960 | 14.6 | 9.7 | 4.9 | 1.97 |
| 1984 | 10,017,000 | 142 805 | 97 227 | 45 578 | 14.4 | 9.8 | 4.6 | 1.87 |
| 1985 | 10,031,000 | 130 492 | 97 339 | 33 153 | 13.2 | 9.8 | 3.3 | 1.78 |
| 1986 | 10,035,000 | 126 748 | 95 828 | 30 920 | 12.7 | 9.6 | 3.1 | 1.71 |
| 1987 | 10,025,000 | 123 218 | 95 423 | 27 795 | 12.3 | 9.5 | 2.8 | 1.65 |
| 1988 | 10,014,000 | 122 121 | 98 236 | 23 885 | 12.3 | 9.9 | 2.4 | 1.60 |
| 1989 | 9,996,000 | 118 560 | 96 220 | 22 340 | 11.9 | 9.7 | 2.2 | 1.53 |
| 1990 | 9,983,000 | 116 383 | 103 115 | 13 268 | 11.8 | 10.4 | 1.3 | 1.51 |
| 1991 | 9,950,000 | 116 415 | 104 361 | 12 054 | 11.7 | 10.5 | 1.2 | 1.43 |
| 1992 | 9,955,000 | 115 018 | 101 161 | 13 857 | 11.5 | 10.2 | 1.4 | 1.49 |
| 1993 | 9,974,000 | 114 030 | 106 384 | 7 646 | 11.4 | 10.7 | 0.8 | 1.54 |
| 1994 | 10,009,000 | 109 287 | 99 621 | 9 666 | 10.9 | 10.0 | 1.0 | 1.42 |
| 1995 | 10,044,000 | 107 184 | 103 939 | 3 245 | 10.7 | 10.4 | 0.3 | 1.37 |
| 1996 | 10,084,000 | 110 363 | 107 259 | 3 104 | 11.0 | 10.7 | 0.3 | 1.45 |
| 1997 | 10,134,000 | 113 047 | 105 157 | 7 890 | 11.2 | 10.4 | 0.8 | 1.48 |
| 1998 | 10,187,000 | 113 510 | 106 574 | 6 936 | 11.2 | 10.5 | 0.7 | 1.48 |
| 1999 | 10,249,000 | 116 038 | 108 268 | 7 770 | 11.4 | 10.7 | 0.8 | 1.49 |
| 2000 | 10,331,000 | 120 071 | 105 813 | 14 258 | 11.8 | 10.4 | 1.4 | 1.57 |
| 2001 | 10,395,000 | 112 825 | 105 582 | 7 243 | 11.0 | 10.3 | 0.7 | 1.45 |
| 2002 | 10,445,000 | 114 456 | 106 690 | 7 766 | 11.0 | 10.3 | 0.7 | 1.47 |
| 2003 | 10,473,000 | 112 589 | 109 148 | 3 441 | 10.8 | 10.5 | 0.3 | 1.44 |
| 2004 | 10,495,000 | 109 356 | 102 371 | 6 985 | 10.4 | 9.7 | 0.7 | 1.40 |
| 2005 | 10,512,000 | 109 457 | 107 839 | 1 618 | 10.4 | 10.2 | 0.2 | 1.40 |
| 2006 | 10,533,000 | 105 514 | 102 362 | 3 152 | 10.0 | 9.7 | 0.3 | 1.36 |
| 2007 | 10,553,000 | 102 567 | 103 888 | -1 321 | 9.7 | 9.8 | -0.1 | 1.33 |
| 2008 | 10,563,000 | 104 594 | 104 280 | 314 | 9.8 | 9.8 | 0.0 | 1.37 |
| 2009 | 10,573,000 | 99 491 | 104 434 | -4 943 | 9.4 | 9.8 | -0.4 | 1.32 |
| 2010 | 10,573,000 | 101 381 | 105 954 | -4 573 | 9.5 | 10.0 | -0.5 | 1.37 |
| 2011 | 10,542,000 | 97 000 | 102 500 | -5 500 | 9.2 | 9.7 | -0.5 | 1.30 |
| 2012 | 10,487,000 | 90 026 | 107 598 | -17 572 | 8.5 | 10.2 | -1.7 | 1.28 |
| 2013 | 10,427,000 | 82 787 | 106 543 | -23 756 | 7.9 | 10.2 | -2.3 | 1.21 |
| 2014 | 10,375,000 | 82 367 | 104 790 | -22 423 | 7.9 | 10.1 | -2.2 | 1.23 |
| 2015 | 10,341,000 | 85 500 | 108 511 | -23 011 | 8.2 | 10.5 | -2.3 | 1.30 |
| 2016 | 10,309,000 | 87 126 | 110 535 | -23 409 | 8.5 | 10.7 | -2.2 | 1.36 |
| 2017 | 10,291,000 | 86 154 | 109 586 | -23 432 | 8.4 | 10.7 | -2.3 | 1.37 |
Natural increase current
- Number of births for January-June 2017 =

- Number of births for January-June 2018 =

- Number of deaths for January-June 2017 =

- Number of deaths for January-June 2018 =

- Natural growth for January-June 2017 =
- Natural growth for January-June 2018 =
Other demographic statistics
Portugal has traditionally been one of the most homogenous countries in the world but steady immigration has changed that to some extent.[14]
It may be surprising to learn however, that much of this immigration has taken place over the last twenty years and back in 1992, just 1.3% of the Portugal population was made up of other nationalities. By 2007, however, that figure had risen to 4.1%.[14]
The following demographic statistics are from the World Population Review.[14]
- One birth every 7 minutes
- One death every 5 minutes
- Net loss of one person every 13 minutes
- One net migrant every 90 minutes
The following demographic statistics are from the CIA World Factbook, unless otherwise indicated.[12]
- Population
- 10,839,514 (July 2017 est.)
- Age structure
- 0-14 years: 15.34% (male 866,004/female 797,004)
- 15-24 years: 11.36% (male 653,672/female 577,800)
- 25-54 years: 41.72 (male 2,298,920/female 2,223,184)
- 55-64 years: 12.18% (male 617,036/female 702,992)
- 65 years and over: 19.4% (male 861,270/female 1,241,632) (2017 est.)
- 0–14 years: 16.1% (male 906,062/female 831,992)
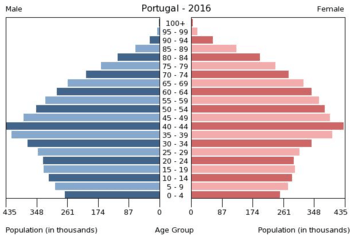
- 15–64 years: 65.7% (male 3,548,140/female 3,538,562). The biggest population age group is 35–39.
- 65 years and over: 18.1% (male 800,339/female 1,156,361) (2012 est.)
- Median age
- total: 42.2 years Country comparison to the world: 30th
- male: 40.2 years
- female: 44.4 years (2017 est.)
- Total fertility rate
- 1.53 children born/woman (2017 est.) Country comparison to the world: 192nd
- Mother's mean age at first birth
- 30.2 years (2015 est.)
- Life expectancy at birth
| Period | Life expectancy in Years |
Period | Life expectancy in Years |
|---|---|---|---|
| 1950–1955 | 60.3 | 1985–1990 | 74.0 |
| 1955–1960 | 62.4 | 1990–1995 | 74.9 |
| 1960–1965 | 64.5 | 1995–2000 | 76.0 |
| 1965–1970 | 66.4 | 2000–2005 | 77.6 |
| 1970–1975 | 68.3 | 2005–2010 | 79.3 |
| 1975–1980 | 70.4 | 2010–2015 | 80.5 |
| 1980–1985 | 72.5 |
Source: UN World Population Prospects[15]
- Population growth rate
- 0.04% (2017 est.). Country comparison to the world: 189th
- Birth rate
- 9 births/1,000 population (2017 est.) Country comparison to the world: 207th
- Death rate
- 11.1 deaths/1,000 population (2017 est.)
- Net migration rate
- 2.5 migrant(s)/1,000 population (2017 est.) Country comparison to the world: 38th
- Religions
Roman Catholic 81%, other Christian 3.3%, other (includes Jewish, Muslim, other) 0.6%, none 6.8%, unspecified 8.3% note: represents population 15 years of age and older (2011 est.)
- Infant mortality rate
- total: 4.3 deaths/1,000 live births. Country comparison to the world: 189th
- male: 4.8 deaths/1,000 live births
- female: 3.9 deaths/1,000 live births (2017 est.)
- Infant mortality rate
| Year | Deaths/1,000 live births |
| 2000 | 5.5 |
| 2001 | 5.0 |
| 2002 | 5.0 |
| 2003 | 4.1 |
| 2004 | 3.8 |
| 2005 | 3.5 |
| 2006 | 3.3 |
| 2007 | 3.4 |
| 2008 | 3.3 |
| 2009 | 3.6 |
| 2010 | 2.5 |
| 2011 | |
| 2012 | 4.6 |
| 2017 | 4.3 |
- Dependency ratios
- total dependency ratio: 53.4
- youth dependency ratio: 21.6
- elderly dependency ratio: 31.8
- potential support ratio: 3.1 (2015 est.)
- Urbanization
- urban population: 65.2% of total population (2018)
- rate of urbanization: 0.47% annual rate of change (2015-20 est.)
- Unemployment, youth ages 15-24
- total: 28% Country comparison to the world: 41st
- male: 27.2%
- female: 28.8% (2016 est.)
- Sex ratio
- at birth: 1.07 male(s)/female
- under 15 years: 1.09 male(s)/female
- 15–64 years: 1 male(s)/female
- 65 years and over: 0.69 male(s)/female
- total population: 0.95 male(s)/female (2011 est.)
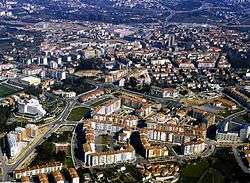
Urban organization
Metropolitan areas and agglomerations
As of 2001 Census, Portugal had two significant agglomerations: Lisbon Metropolitan Region (3.34 million inhabitants) and Northern Littoral Urban-Metropolitan Region (or Porto Metropolitan Agglomeration) with 2.99 million people, the later with a polycentric nature.[16] These broader agglomerations are distinct from the political metropolitan areas of Lisbon and Porto – Grande Área Metropolitana de Lisboa (2,8 million) and Grande Área Metropolitana do Porto (1,8 million). Together they hold 43% of the total population.
| Image | City | Metropolitan area | Subregion | Core municipality |
|---|---|---|---|---|
 |
Lisbon | 2,815,851[16] | 2,042,326 | 545,245 |
 |
Porto | 1,758,531[16] | 1,401,805 | 237,559 |
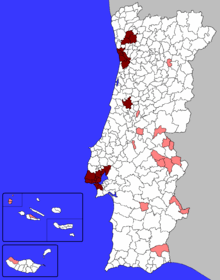
Largest urban areas
When considering the number of inhabitants in consistent single urban areas, de facto cities in mainland Portugal, per the new with increased density of human-created structures, and excluding suburban and rural areas, Portugal has two cities with about one million inhabitants each (Lisbon and Porto), ten others with more than 50,000 inhabitants and 14 cities with populations between 20,000 and 40,000 inhabitants.[16]


Note: the following table does not include cities in the Portuguese islands of Madeira and Azores in mid-Atlantic Ocean.
| City | Metropolitan Area | Agglomeration |
|---|---|---|
| Cities with about 50,000 inh. (2001 Census) | ||
| Leiria | ||
| Amora | Lisbon Metropolitan Region | |
| Portimão | ||
| Faro | ||
| Évora | ||
| Cities with about 40,000 inh. (2001 Census) | ||
| Viana do Castelo | ||
| Covilhã | ||
| Castelo Branco | ||
| Santarém | Lisbon Metropolitan Region | |
| Alverca do Ribatejo | Lisbon Metropolitan Region | |
| Vila Nova de Famalicão | Northern Littoral Urban-Metropolitan Region | |
| Figueira da Foz | ||
| Guarda | ||
| Caldas da Rainha | Lisbon Metropolitan Region | |
| Olhão | ||
| Santo Tirso | Greater Porto | Northern Littoral Urban-Metropolitan Region |
| Vila Real | ||
| Póvoa de Santa Iria | Greater Lisbon | Lisbon Metropolitan Region |
Largest cities
Portugal has 151 localities with city status (cidade). Every city is included into a municipality (município). This is a list of population by city, which means that it refers to the number of inhabitants in the city proper, excluding inhabitants from the same municipality but living outside the urban area of the city in other civil parishes (freguesias) of the municipality. In some cases, the entire municipality and the city proper cover the same territory.[17]
Largest municipalities by population
Denotes the number of inhabitants in the municipality area; area is in km2; only for populations of over 100,000 inhabitants.
People
Nationality
- noun: Portuguese (singular and plural)
- adjective: Portuguese
Languages
The main language is Portuguese. Mirandês (the Mirandese language), is also recognised, and has special protection in the area of Miranda do Douro.
Immigration
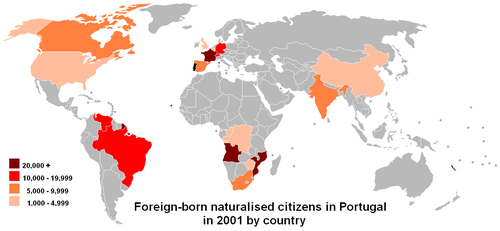
In 1992, 1.3% of the population was foreign, by 2007 the number had grown to 4.1% or 435,736 people.[18]
Since the independence of the former African colonies, Portugal saw a steady immigration from Africa, most notably Cape Verde, Angola and Guinea-Bissau, but also São Tomé and Príncipe, Mozambique and former Portuguese India in Asia.
Portugal saw migration waves due to labor shortages since 1999, first from Eastern Europe (1999–2002), in two distinctive groups, a Slav (Ukraine, Russia and Bulgaria) and an East Latin (Romania and Moldavia), that stopped and started declining as the labour market became saturated.
Since 2003, most of the immigrants came from Brazil, China and the Indian subcontinent. Family reunification was seen as important for a successful integration in the country, thus the government eased it, and in 2006, more than 6 in 10 new immigrants were family members of legal foreign residents in the country.[19]
There is also a significant number of elderly Western European residents in search of quality of life, namely from France, German, the Netherlands and United Kingdom.
| The 20 largest legal immigrant communities in 2007 compared with their numbers in 1999 * : European Union citizenship | ||||
| Country of origin | Number in 1999 | Number in 2007 | Growth in percentage | |
|---|---|---|---|---|
| 20,851 | 66,354 | + 218% | ||
| 43,951 | 63,925 | + 45% | ||
| 123 | 39,480 | + 31998% | ||
| 17,721 | 32,728 | + 85% | ||
| 14,217 | 23,733 | + 67% | ||
| 13,335 | 23,608 | + 77% | ||
| 224 | 19,155 | + 8451% | ||
| 11,122 | 18,030 | + 62% | ||
| 9,605 | 15,498 | + 61% | ||
| 3 | 14,053 | + 468333% | ||
| 4,809 | 10,627 | + 121% | ||
| 6,499 | 10,556 | + 62% | ||
| 2,762 | 10,448 | + 278% | ||
| 7,975 | 8,264 | + 4% | ||
| 3,675 | 6,589 | + 79% | ||
| 2,700 | 5,985 | + 122% | ||
| 4,502 | 5,681 | + 26% | ||
| 448 | 5,114 | + 1042% | ||
| 347 | 5,028 | + 1349% | ||
| 1,211 | 4,104 | + 239% | ||
In 2008, SEF, the foreigners and borders bureau, started using a new integrated information system, incompatible with previous statistics. The foreign population grew 1% from 435,736 in 2007 to 440,277. One in four immigrants is Brazilian.[20]
| Immigrants | |
| Country of origin | Number in 2011 |
|---|---|
| 162,604 | |
| 139 703 | |
| 94,484 | |
| 73,084 | |
| 61 953 | |
| 33,172 | |
| 29,578 | |
| 28,000 | |
| Nationality appliance | |
| Previous nationality | Number in 2008 |
|---|---|
| 9,926 | |
| 8,391 | |
| 4,589 | |
| 4,463 | |
| 4,449 | |
Ethnic minorities and persons with disabilities
Anti-racism laws prohibit and penalize racial discrimination in housing, business, and health services. In 2007 approximately 332,137 legal immigrants live in the country, representing approximately 5% of the population. The country also has a resident Romani (Gypsy) population of approximately 40,000 people.
Discrimination against persons with disabilities in employment, education, access to health care, or the provision of other state services is illegal. The law mandates access to public buildings and to newly built private buildings for such persons.
Religion
The great majority of the Portuguese population belongs to the Roman Catholic Church. Religious observance remains strong in northern areas, with the population of Lisbon and southern areas generally less devout and strongly anticlerical. Religious minorities include a little over 300,000 Protestants and Mormons. There are also about 50,000 Muslims and 10,000 Hindus. Most of them came from Goa, a former Portuguese colony on the west coast of India (Some Muslims also came from former two Portuguese African colonies with important Muslim minorities: Guinea-Bissau and Mozambique). There are also about 1,000 Jews. Portugal is also home to less than 10,000 Buddhists, mostly Chinese from Macau and a few Indians from Goa.
Literacy
- definition: age 15 and over can read and write
- total population: 99.62%
- male: 99.55%
- female: 99.63% (2015)[22]
Notes
- ↑ In fertility rates, 2.1 and above is a stable population and have been marked blue, 2 and below leads an aging population and the result is that the population reduces.
See also
- Portugal census
- Portugal
- Romani people in Portugal
References
- ↑ Nuno Valério (coord.), Estatísticas Históricas Portuguesas, Vol. I, pp. 33, 37 e 51. INE, 2001. (PDF: 4,18 MB)
- ↑ INE, CENSOS 2001 Resultados Definitivos, Informação à Comunicação Social, 21 October 2002.
- ↑ INE, Estimativas de População Residente, Portugal, NUTS II, NUTS III e Municípios – 2006, Informação à Comunicação Social, 3 August 2007.
- ↑ "Portugal Ethnic Groups | Study.com". Study.com. Retrieved 11 April 2017.
- 1 2 3 4 5 6 7 Max Roser (2014), "Total Fertility Rate around the world over the last centuries", Our World In Data, Gapminder Foundation
- ↑ B.R. Mitchell. European historical statistics, 1750–1975.
- ↑ "United Nations. Demographic Yearbook 1948" (PDF). Unstats.un.org. Retrieved 3 October 2017.
- ↑ "Statistics Portugal". Ine.pt. Retrieved 3 October 2017.
- ↑ "PORDATA – População residente: total e por sexo". Pordata.pt. Retrieved 3 October 2017.
- ↑ "2011 WORLD POPULATION DATA SHEET" (PDF). Prb.org. Retrieved 3 October 2017.
- ↑ "2012 – Negative birth rate decreases further – Portugal – Portuguese American Journal". Portuguese-american-journal.com. Retrieved 3 October 2017.
- 1 2 "World Factbook EUROPE : PORTUGAL", The World Factbook, July 12, 2018
- ↑ "Monthly Statistical Bulletin". Instituto Nacional de Estatística. Statistics Portugal. Retrieved 25 September 2018.
- 1 2 3 World Population Review: Portugal Population 2018, 14 June 2018
- ↑ "World Population Prospects – Population Division – United Nations". Retrieved 2017-07-15.
- 1 2 3 4 Fernando Nunes da Silva (2005), Alta Velocidade em Portugal, Desenvolvimento Regional, CENSUR, IST Archived 24 June 2009 at the Wayback Machine.
- ↑ UMA POPULAÇÃO QUE SE URBANIZA, Uma avaliação recente – Cidades, 2004 Archived 6 October 2014 at the Wayback Machine. Nuno Pires Soares, Instituto Geográfico Português (Geographic Institute of Portugal)
- ↑ População Estrangeira em Território Nacional (pdf) (in Portuguese), SEF, 2008, retrieved 12 September 2008
- ↑ Imigração: Novos imigrantes legais em Portugal aumentaram 50% em 2006 – OCDE Archived 10 February 2012 at the Wayback Machine. – RTP.pt
- ↑ Um em cada quatro imigrantes é de nacionalidade brasileira – Diário de Notícias
- ↑ "Census – Final results : Portugal – 2011". Statistics Portugal. 20 November 2012. Retrieved 21 November 2012.
- ↑ "Portugal". Uis.unesco.org. Retrieved 3 October 2017.