Demography of the Netherlands
| Demographics of the Netherlands | |
|---|---|
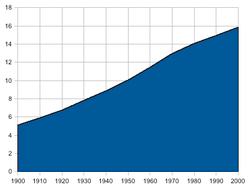 Population of Netherlands (1900-2000) in millions. | |
| Population | 17,132,911 (64th) |
| Density | 415 per km² (31st) |
| Growth rate | 0.39% (189th) |
| Birth rate | 10.3 births/1,000 (161st) |
| Death rate | 8.78 deaths/1,000 (77th) |
| Life expectancy | 79.55 years (34th) |
| • male | 76.94 years |
| • female | 82.30 years |
| Fertility rate | 1.653 children/woman (2015) |
| Age structure | |
| 0–14 years | 17.4% |
| 15–64 years | 67.7% |
| 65 and over | 14.9% |
| Sex ratio | |
| Total | 0.98 male/female |
| At birth | 1.05 male/female |
| Under 15 | 1.05 male/female |
| 15–64 years | 1.02 male/female |
| 65 and over | 0.75 male/female |
| Nationality | |
| Nationality | Dutch |
| Major ethnic | Dutch 79.3% |
| Minor ethnic |
Other European 6.3% Indo 4.9% Turks 2.4% Moroccans 2.2% Surinamese 2.1% Caribbeans 0.9% Chinese 0.3% Iraqis 0.3% Other 3.9% |
| Language | |
| Official | Dutch, Frisian |
This article is about the demographic features of the population of the Netherlands, including population density, ethnicity, education level, health of the population, economic status, religious affiliations and other aspects of the population.
Population size
The Netherlands is the 66th most populated country in the world, and as of March 21, 2016, it has a population of 17,000,000.
Between 1900 and 1950 the population doubled from 5.1 to 10.0 million people. From 1951 to 2000 the population increased from 10.0 to 15.9 million people, increasing by a smaller proportion.[1]
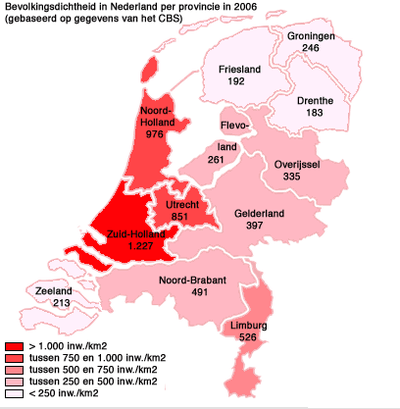

The Netherlands is the thirty-first most densely populated country in the world. The 17,000,000[2] Dutch men, women and children are concentrated on an area of 41,526 km²;[3] this means that the country has a population density of 409 per km² (August 2018:415 per km2), or over 502 per km² if only the land area, 33,883 km²,[3] is counted. If only the land area of the provinces, 33,718 km², is counted, 500 inhabitants/km² were reached in the first half of 2014 or possibly in the last few days of 2013. 511 inhabitants per square kilometer were reached in August 2018.
Bangladesh and South Korea are larger and more densely populated (hence have a larger population). There are 21 more countries (12 independent ones and 9 dependent territories) with a larger population density, but they all have a smaller population (hence a smaller area). If the water area is not counted then Taiwan is larger, and there are 16 more countries (9 independent ones and 7 dependent territories) with a larger population density.
As a result of these demographic characteristics the Netherlands has had to plan its land use strictly. Since 1946 the Ministry of Housing, Spatial Planning and the Environment has been occupied with the national coordination of land use. Because of its high population density the Netherlands has also reclaimed land from the sea by poldering. Between 1927 and 1968 an entire province, Flevoland was created. It currently (2015) houses more than 400,000 people. Because of these policies, the Dutch have been able to combine high levels of population density with extremely high levels of agricultural production.
Even though the Netherlands is so densely populated, it has no municipalities with a population over 1 million, although the two largest municipalities of the country do score well over a million if the complete city region is counted, including the neighbouring satellite towns that often are physically connected to the main municipality. Moreover, the "four big cities" (Amsterdam, Rotterdam, The Hague and Utrecht) can in many ways be regarded as a single metropolitan area, the Randstad ("rim city" or "edge city") with about 7 million inhabitants around an agricultural "green heart" (het Groene Hart).
| Rank | Name | Province | Pop. | Rank | Name | Province | Pop. | ||
|---|---|---|---|---|---|---|---|---|---|
.jpg) Amsterdam .jpg) Rotterdam |
1 | Amsterdam | North Holland | 855,896 | 11 | Apeldoorn | Gelderland | 161,181 |  The Hague  Utrecht |
| 2 | Rotterdam | South Holland | 638,751 | 12 | Haarlem | North Holland | 159,819 | ||
| 3 | The Hague | South Holland | 531,935 | 13 | Enschede | Overijssel | 158,276 | ||
| 4 | Utrecht | Utrecht | 347,526 | 14 | Arnhem | Gelderland | 157,277 | ||
| 5 | Eindhoven | North Brabant | 229,184 | 15 | Amersfoort | Utrecht | 155,215 | ||
| 6 | Tilburg | North Brabant | 215,631 | 16 | Zaanstad | North Holland | 154,826 | ||
| 7 | Almere | Flevoland | 203,997 | 17 | 's-Hertogenbosch | North Brabant | 153,429 | ||
| 8 | Groningen | Groningen | 202,900 | 18 | Haarlemmermeer | North Holland | 147,302 | ||
| 9 | Breda | North Brabant | 183,749 | 19 | Zwolle | Overijssel | 126,158 | ||
| 10 | Nijmegen | Gelderland | 175,928 | 20 | Zoetermeer | South Holland | 124,719 | ||
Births and deaths
| % | Male | Age | Female | % |
| 0.36 | 85+ | 1.05 | ||
| 0.60 | 80-84 | 1.18 | ||
| 1.14 | 75-79 | 1.74 | ||
| 1.55 | 70-74 | 1.95 | ||
| 1.93 | 65-69 | 2.13 | ||
| 2.30 | 60-64 | 2.33 | ||
| 2.77 | 55-59 | 2.69 | ||
| 3.73 | 50-54 | 3.60 | ||
| 3.65 | 45-49 | 3.54 | ||
| 3.93 | 40-44 | 3.81 | ||
| 4.27 | 35-39 | 4.08 | ||
| 4.25 | 30-34 | 4.05 | ||
| 3.63 | 25-29 | 3.54 | ||
| 3.04 | 20-24 | 2.93 | ||
| 2.96 | 15-19 | 2.83 | ||
| 3.11 | 10-14 | 2.97 | ||
| 3.20 | 05-09 | 3.06 | ||
| 3.11 | 00-04 | 2.98 | ||
| Data: International Data Base (2000) | ||||
| Historical population | ||
|---|---|---|
| Year | Pop. | ±% |
| 1900 | 5,104,000 | — |
| 1910 | 5,858,000 | +14.8% |
| 1920 | 6,754,000 | +15.3% |
| 1930 | 7,825,000 | +15.9% |
| 1940 | 8,834,000 | +12.9% |
| 1950 | 10,026,773 | +13.5% |
| 1960 | 11,417,254 | +13.9% |
| 1970 | 12,957,621 | +13.5% |
| 1980 | 14,091,014 | +8.7% |
| 1990 | 14,892,574 | +5.7% |
| 2000 | 15,863,950 | +6.5% |
| 2010 | 16,574,989 | +4.5% |
| 2017 | 17,081,507 | +3.1% |
| Source: Statistics Netherlands | ||
The Dutch population is ageing. Furthermore, life expectancy has increased because of developments in medicine, and in addition to this, the Netherlands has seen increasing immigration. Despite these developments combined with the population boom after the Second World War, the low birth rate has caused extremely low population growth: 2005 saw the lowest absolute population growth since 1900.
This demographic development has consequences for health care and social security policy. As the Dutch population ages, the proportion of people of working age, as a percentage of the entire population, decreases. Important policy advisors like the CBS (Statistical Office) and the CPB (Planning Office) have pointed out that this will cause problems with the current system of old age pensions: fewer people will work to pay for old age pensions, while there will be more people receiving those pensions. Furthermore, the costs of health care are also projected to increase. These developments have caused several cabinets, most notably the recent second Balkenende cabinet to reform the system of health care and social security to increase participation in the labour market and make people more conscious of the money they spend on health care.
In 2003, the annual birth rate per thousand was highest in the province of Flevoland (15.9). The overall lifelong Total fertility rate (TFR), was highest in the province of Flevoland (2.0) and lowest in the province of Limburg (1.6). The municipality with the highest TFR was Urk (3.23) followed by Valkenburg (2.83), Graafstroom (2.79) and Staphorst (2.76). The lowest TFRs were recorded in Vaals (1.11) and Thorn (1.21).[5]
The total population at December 31, 2006 was 16,356,914. The population loss due to net emigration was 35,502 (an estimated 40-50% of emigrants were ethnic non-Dutch).
In 2007, there were 117,000 immigrants (including 7000 Germans, 6000 Poles, 5000 Bulgarians, 3000 Turks and 2000 Moroccans) and 123,000 emigrants. Nearly half the emigrants were native Dutch, followed at a distance by nearly 5000 Poles and more than 3000 Germans. There was an observable increase in net immigration from the former USSR, Bulgaria and Romania.[6]
The annual death rate was lowest in the municipalities of Valkenburg (2.9 per 1000), Zeewolde (3.2), Renswoude (3.4), Westervoort and Zeevang (both 3.9). The highest annual death rates were recorded in Warmond (22.3 per 1000), Laren (19.9) and Doorn (18.8).[7]
16.4% of the total births in 2003 were to parents of non-European origin, although they account for only 12.4% of the population in the 25-34 age group. For example, 3.8% of the births were ethnic Moroccan, although they were only 2.26% of the 25-34 age group. Respective figures were 3.27% and 3.0% for Turks. The TFR for Moroccans in 2003 was 3.3 while the general TFR was 1.73. TFR was 2.3 for Turks, 1.7 for Surinamese, 1.8 for Arubans, 3.0 for Africans and 1.8 for Americans.[8] (These figures compare with a figure of around 2.1 required to maintain a stable overall population figure.)
According to Statistics Netherlands, for the year 2007, the TFR for those born in Netherlands was 1.72[9] (1.65 in 2000). TFR of Moroccan immigrants was 2.87 (3.22 in 2000) and that of Turkish immigrants was 1.88 (2.18 in 2000).[10]
Life expectancy from 1850 to 1950
Sources: Our World In Data
1850-1950
| Years | 1850 | 1851 | 1852 | 1853 | 1854 | 1855 | 1856 | 1857 | 1858 | 1859 | 1860[11] |
|---|---|---|---|---|---|---|---|---|---|---|---|
| Life expectancy in the Netherlands | 39.8 | 40.0 | 38.6 | 38.6 | 38.6 | 34.5 | 38.8 | 35.5 | 34.7 | 30.9 | 36.9 |
| Years | 1861 | 1862 | 1863 | 1864 | 1865 | 1866 | 1867 | 1868 | 1869 | 1870[11] |
|---|---|---|---|---|---|---|---|---|---|---|
| Life expectancy in the Netherlands | 36.4 | 38.3 | 38.3 | 37.5 | 36.4 | 33.6 | 39.2 | 37.7 | 40.4 | 37.3 |
| Years | 1871 | 1872 | 1873 | 1874 | 1875 | 1876 | 1877 | 1878 | 1879 | 1880[11] |
|---|---|---|---|---|---|---|---|---|---|---|
| Life expectancy in the Netherlands | 32.9 | 36.5 | 39.2 | 41.3 | 38.2 | 40.4 | 42.0 | 41.1 | 41.9 | 40.3 |
| Years | 1881 | 1882 | 1883 | 1884 | 1885 | 1886 | 1887 | 1888 | 1889 | 1890[11] |
|---|---|---|---|---|---|---|---|---|---|---|
| Life expectancy in the Netherlands | 42.8 | 43.7 | 42.3 | 41.3 | 43.2 | 41.9 | 44.9 | 44.2 | 44.3 | 44.4 |
| Years | 1891 | 1892 | 1893 | 1894 | 1895 | 1896 | 1897 | 1898 | 1899 | 1900[11] |
|---|---|---|---|---|---|---|---|---|---|---|
| Life expectancy in the Netherlands | 44.2 | 43.9 | 45.8 | 46.9 | 46.6 | 48.6 | 49.4 | 49.1 | 49.3 | 48.4 |
| Years | 1901 | 1902 | 1903 | 1904 | 1905 | 1906 | 1907 | 1908 | 1909 | 1910[11] |
|---|---|---|---|---|---|---|---|---|---|---|
| Life expectancy in the Netherlands | 48.7 | 50.6 | 51.5 | 50.9 | 52.1 | 52.7 | 53.5 | 52.7 | 54.9 | 55.1 |
| Years | 1911 | 1912 | 1913 | 1914 | 1915 | 1916 | 1917 | 1918 | 1919 | 1920[11] |
|---|---|---|---|---|---|---|---|---|---|---|
| Life expectancy in the Netherlands | 53.1 | 57.2 | 57.3 | 57.2 | 57.2 | 56.2 | 55.6 | 47.6 | 55.0 | 57.8 |
| Years | 1921 | 1922 | 1923 | 1924 | 1925 | 1926 | 1927 | 1928 | 1929 | 1930[11] |
|---|---|---|---|---|---|---|---|---|---|---|
| Life expectancy in the Netherlands | 59.7 | 59.8 | 62.0 | 62.9 | 63.1 | 63.0 | 62.6 | 63.7 | 62.2 | 64.7 |
| Years | 1931 | 1932 | 1933 | 1934 | 1935 | 1936 | 1937 | 1938 | 1939 | 1940[11] |
|---|---|---|---|---|---|---|---|---|---|---|
| Life expectancy in the Netherlands | 64.3 | 65.4 | 66.0 | 66.6 | 66.5 | 66.7 | 67.0 | 67.4 | 67.7 | 65.4 |
| Years | 1941 | 1942 | 1943 | 1944 | 1945 | 1946 | 1947 | 1948 | 1949 | 1950[11] |
|---|---|---|---|---|---|---|---|---|---|---|
| Life expectancy in the Netherlands | 65.3 | 65.8 | 64.4 | 61.3 | 55.4 | 67.6 | 69.5 | 71.1 | 70.3 | 71.4 |
Vital statistics
The following table presents the evolution since 1900; click on "show" to display the table:[12]
| Population () | Live births (total) | Deaths (total) | Natural change (total) | Birth rate (per mille) |
Mortality rate (per mille) |
Natural change (per mille) |
TFR |
IMR (per mille) |
Life expectancy males | Life expectancy females | |
|---|---|---|---|---|---|---|---|---|---|---|---|
| 1900 | 5 142 | 162 611 | 92 043 | 70 568 | 31.6 | 17.9 | 13.7 | 4.45 | 155.2 | ||
| 1901 | 5 221 | 168 380 | 89 967 | 78 413 | 32.3 | 17.2 | 15.0 | 4.53 | 149.3 | ||
| 1902 | 5 305 | 168 728 | 86 248 | 82 480 | 31.8 | 16.3 | 15.5 | 4.46 | 129.9 | ||
| 1903 | 5 389 | 170 108 | 83 933 | 86 175 | 31.6 | 15.6 | 16.0 | 4.42 | 135.1 | ||
| 1904 | 5 470 | 171 495 | 87 091 | 84 404 | 31.4 | 15.9 | 15.4 | 4.38 | 136.9 | ||
| 1905 | 5 551 | 170 767 | 85 016 | 85 751 | 30.8 | 15.3 | 15.4 | 4.29 | 130.9 | ||
| 1906 | 5 632 | 170 952 | 83 259 | 87 693 | 30.4 | 14.8 | 15.6 | 4.23 | 127.1 | ||
| 1907 | 5 710 | 171 506 | 82 250 | 89 256 | 30.0 | 14.4 | 15.6 | 4.18 | 111.9 | ||
| 1908 | 5 786 | 171 861 | 86 936 | 84 925 | 29.7 | 15.0 | 14.7 | 4.13 | 124.8 | ||
| 1909 | 5 862 | 170 766 | 80 283 | 90 483 | 29.1 | 13.7 | 15.4 | 4.04 | 99.1 | ||
| 1910 | 5 899 | 168 894 | 79 984 | 88 910 | 28.6 | 13.6 | 15.1 | 3.94 | 107.9 | ||
| 1911 | 5 976 | 166 527 | 86 786 | 79 741 | 27.9 | 14.5 | 13.3 | 3.81 | 137.2 | ||
| 1912 | 6 054 | 170 269 | 74 647 | 95 622 | 28.1 | 12.3 | 15.8 | 3.84 | 87.0 | ||
| 1913 | 6 145 | 173 541 | 75 867 | 97 674 | 28.2 | 12.3 | 15.9 | 3.85 | 91.4 | ||
| 1914 | 6 251 | 176 831 | 77 739 | 99 092 | 28.3 | 12.4 | 15.9 | 3.86 | 94.8 | ||
| 1915 | 6 364 | 167 426 | 79 613 | 87 813 | 26.3 | 12.5 | 13.8 | 3.59 | 86.8 | ||
| 1916 | 6 480 | 172 572 | 84 024 | 88 548 | 26.6 | 13.0 | 13.7 | 3.64 | 84.5 | ||
| 1917 | 6 612 | 173 112 | 87 273 | 85 839 | 26.2 | 13.2 | 13.0 | 3.59 | 86.8 | ||
| 1918 | 6 705 | 167 636 | 115 440 | 52 196 | 25.0 | 17.2 | 7.8 | 3.47 | 103.9 | ||
| 1919 | 6 752 | 164 447 | 89 646 | 74 801 | 24.4 | 13.3 | 11.1 | 3.36 | 94.0 | ||
| 1920 | 6 820 | 192 987 | 81 525 | 111 462 | 28.3 | 12.0 | 16.3 | 3.89 | 83.3 | ||
| 1921 | 6 921 | 189 546 | 77 002 | 112 544 | 27.4 | 11.1 | 16.3 | 3.75 | 86.1 | ||
| 1922 | 7 032 | 181 886 | 80 381 | 101 505 | 25.9 | 11.4 | 14.4 | 3.54 | 77.6 | ||
| 1923 | 7 150 | 187 512 | 72 809 | 114 703 | 26.2 | 10.2 | 16.0 | 3.55 | 66.8 | ||
| 1924 | 7 264 | 182 430 | 71 167 | 111 263 | 25.1 | 9.8 | 15.3 | 3.39 | 60.6 | ||
| 1925 | 7 366 | 178 545 | 72 121 | 106 424 | 24.2 | 9.8 | 14.4 | 3.26 | 58.4 | ||
| 1926 | 7 472 | 177 498 | 73 357 | 104 141 | 23.8 | 9.8 | 13.9 | 3.18 | 61.1 | ||
| 1927 | 7 576 | 175 098 | 77 614 | 97 484 | 23.1 | 10.2 | 12.9 | 3.08 | 58.7 | ||
| 1928 | 7 678 | 179 028 | 73 816 | 105 212 | 23.3 | 9.6 | 13.7 | 3.09 | 52.3 | ||
| 1929 | 7 781 | 177 216 | 83 224 | 93 992 | 22.8 | 10.7 | 12.1 | 3.00 | 59.0 | ||
| 1930 | 7 884 | 182 310 | 71 682 | 110 628 | 23.1 | 9.1 | 14.0 | 3.03 | 50.9 | ||
| 1931 | 7 999 | 177 387 | 77 048 | 100 339 | 22.2 | 9.6 | 12.5 | 2.88 | 49.6 | ||
| 1932 | 8 122 | 178 525 | 73 059 | 105 466 | 22.0 | 9.0 | 13.0 | 2.83 | 46.3 | ||
| 1933 | 8 237 | 171 289 | 72 096 | 99 193 | 20.8 | 8.8 | 12.0 | 2.66 | 43.9 | ||
| 1934 | 8 341 | 172 214 | 70 164 | 102 050 | 20.6 | 8.4 | 12.2 | 2.63 | 42.6 | ||
| 1935 | 8 433 | 170 425 | 73 660 | 96 765 | 20.2 | 8.7 | 11.5 | 2.57 | 40.0 | ||
| 1936 | 8 516 | 171 675 | 73 923 | 97 752 | 20.2 | 8.7 | 11.5 | 2.51 | 38.9 | ||
| 1937 | 8 598 | 170 220 | 75 516 | 94 704 | 19.8 | 8.8 | 11.0 | 2.53 | 38.1 | ||
| 1938 | 8 684 | 178 422 | 77 043 | 101 379 | 20.5 | 8.9 | 11.7 | 2.63 | 36.5 | ||
| 1939 | 8 781 | 180 917 | 75 841 | 105 076 | 20.6 | 8.6 | 12.0 | 2.64 | 33.7 | ||
| 1940 | 8 879 | 184 846 | 87 722 | 97 124 | 20.8 | 9.9 | 10.9 | 2.67 | 39.1 | ||
| 1941 | 8 965 | 181 959 | 89 716 | 92 243 | 20.3 | 10.0 | 10.3 | 2.61 | 43.6 | ||
| 1942 | 9 042 | 189 975 | 76 040 | 113 935 | 21.0 | 8.4 | 12.6 | 2.71 | 39.5 | ||
| 1943 | 9 102 | 209 379 | 91 438 | 117 941 | 23.0 | 10.0 | 13.0 | 2.98 | 40.1 | ||
| 1944 | 9 174 | 219 946 | 108 087 | 111 859 | 24.0 | 11.8 | 12.2 | 3.13 | 46.3 | ||
| 1945 | 9 262 | 209 607 | 141 398 | 68 209 | 22.6 | 15.3 | 7.4 | 2.96 | 79.7 | ||
| 1946 | 9 423 | 284 456 | 80 151 | 204 305 | 30.2 | 8.5 | 21.7 | 3.97 | 38.7 | ||
| 1947 | 9 629 | 267 348 | 77 646 | 189 702 | 27.8 | 8.1 | 19.7 | 3.70 | 33.5 | ||
| 1948 | 9 800 | 247 923 | 72 459 | 175 464 | 25.3 | 7.4 | 17.9 | 3.41 | 29.3 | ||
| 1949 | 9 956 | 236 177 | 81 077 | 155 100 | 23.7 | 8.1 | 15.6 | 3.22 | 26.8 | ||
| 1950 | 10 114 | 229 718 | 75 929 | 153 789 | 22.7 | 7.5 | 15.2 | 3.10 | 26.7 | 70.3 | 72.6 |
| 1951 | 10 264 | 228 405 | 77 560 | 150 845 | 22.3 | 7.6 | 14.7 | 3.05 | 26.7 | 70.2 | 72.8 |
| 1952 | 10 382 | 231 888 | 76 346 | 155 542 | 22.3 | 7.4 | 15.0 | 3.09 | 24.1 | 71.0 | 73.3 |
| 1953 | 10 493 | 227 964 | 80 901 | 147 063 | 21.7 | 7.7 | 14.0 | 3.03 | 23.7 | 70.4 | 73.0 |
| 1954 | 10 615 | 228 173 | 79 623 | 148 550 | 21.5 | 7.5 | 14.0 | 3.03 | 22.6 | 71.0 | 73.8 |
| 1955 | 10 751 | 229 222 | 81 708 | 147 514 | 21.3 | 7.6 | 13.7 | 3.03 | 21.6 | 70.9 | 71.4 |
| 1956 | 10 889 | 231 492 | 84 809 | 146 683 | 21.3 | 7.8 | 13.5 | 3.05 | 20.2 | 71.0 | 74.1 |
| 1957 | 11 021 | 233 892 | 82 961 | 150 931 | 21.2 | 7.5 | 13.7 | 3.08 | 18.4 | 71.4 | 74.6 |
| 1958 | 11 186 | 236 859 | 84 491 | 152 368 | 21.2 | 7.6 | 13.6 | 3.11 | 18.5 | 71.5 | 74.8 |
| 1959 | 11 346 | 242 518 | 86 072 | 156 446 | 21.4 | 7.6 | 13.8 | 3.17 | 18.1 | 71.2 | 75.2 |
| 1960 | 11 480 | 239 128 | 87 825 | 151 303 | 20.8 | 7.7 | 13.2 | 3.12 | 17.9 | 71.4 | 75.3 |
| 1961 | 11 637 | 247 407 | 88 321 | 159 086 | 21.3 | 7.6 | 13.7 | 3.22 | 17.0 | 71.5 | 75.7 |
| 1962 | 11 890 | 246 150 | 93 969 | 152 181 | 20.7 | 7.9 | 12.8 | 3.18 | 17.0 | 71.0 | 75.6 |
| 1963 | 12 042 | 249 879 | 95 734 | 154 145 | 20.8 | 8.0 | 12.8 | 3.19 | 15.8 | 71.0 | 75.8 |
| 1964 | 12 212 | 250 914 | 93 437 | 157 477 | 20.5 | 7.7 | 12.9 | 3.17 | 14.8 | 71.3 | 76.3 |
| 1965 | 12 377 | 245 216 | 98 026 | 147 190 | 19.8 | 7.9 | 11.9 | 3.04 | 14.4 | 71.1 | 76.1 |
| 1966 | 12 535 | 239 611 | 100 516 | 139 095 | 19.1 | 8.0 | 11.1 | 2.90 | 14.7 | 71.0 | 76.1 |
| 1967 | 12 597 | 238 678 | 99 792 | 138 886 | 18.9 | 7.9 | 11.0 | 2.81 | 13.4 | 71.2 | 76.6 |
| 1968 | 12 725 | 237 112 | 104 989 | 132 123 | 18.6 | 8.3 | 10.4 | 2.72 | 13.6 | 70.9 | 76.4 |
| 1969 | 12 958 | 247 588 | 107 615 | 139 973 | 19.1 | 8.3 | 10.8 | 2.75 | 13.2 | 70.9 | 76.3 |
| 1970 | 13 032 | 238 912 | 109 619 | 129 293 | 18.3 | 8.4 | 9.9 | 2.57 | 12.7 | 70.8 | 76.5 |
| 1971 | 13 266 | 227 180 | 110 243 | 116 937 | 17.1 | 8.3 | 8.8 | 2.36 | 12.1 | 71.0 | 76.8 |
| 1972 | 13 330 | 214 133 | 113 576 | 100 557 | 16.1 | 8.5 | 7.5 | 2.15 | 11.7 | 70.8 | 76.5 |
| 1973 | 13 438 | 194 993 | 110 682 | 84 311 | 14.5 | 8.2 | 6.3 | 1.90 | 11.5 | 71.3 | 77.1 |
| 1974 | 13 541 | 185 982 | 109 250 | 76 732 | 13.7 | 8.1 | 5.7 | 1.77 | 11.3 | 71.6 | 77.6 |
| 1975 | 13 653 | 177 876 | 113 737 | 64 139 | 13.0 | 8.3 | 4.7 | 1.66 | 10.6 | 71.5 | 77.7 |
| 1976 | 13 770 | 177 090 | 114 454 | 62 636 | 12.9 | 8.3 | 4.5 | 1.63 | 10.7 | 71.5 | 77.9 |
| 1977 | 13 853 | 173 296 | 110 093 | 63 203 | 12.5 | 7.9 | 4.6 | 1.58 | 9.5 | 72.1 | 78.5 |
| 1978 | 13 937 | 175 550 | 114 415 | 61 135 | 12.6 | 8.2 | 4.4 | 1.58 | 9.6 | 72.0 | 78.5 |
| 1979 | 14 030 | 174 979 | 112 565 | 62 414 | 12.5 | 8.0 | 4.4 | 1.56 | 8.7 | 72.5 | 78.9 |
| 1980 | 14 144 | 181 294 | 114 279 | 67 015 | 12.8 | 8.1 | 4.7 | 1.60 | 8.6 | 72.5 | 79.2 |
| 1981 | 14 246 | 178 569 | 115 515 | 63 054 | 12.5 | 8.1 | 4.4 | 1.56 | 8.3 | 72.7 | 79.3 |
| 1982 | 14 310 | 172 071 | 117 264 | 54 807 | 12.0 | 8.2 | 3.8 | 1.50 | 8.3 | 72.8 | 79.4 |
| 1983 | 14 362 | 170 246 | 117 761 | 52 485 | 11.9 | 8.2 | 3.7 | 1.47 | 8.4 | 72.9 | 79.6 |
| 1984 | 14 420 | 174 436 | 119 812 | 54 624 | 12.1 | 8.3 | 3.8 | 1.49 | 8.3 | 73.0 | 79.7 |
| 1985 | 14 484 | 178 136 | 122 704 | 55 432 | 12.3 | 8.5 | 3.8 | 1.51 | 8.0 | 73.1 | 79.7 |
| 1986 | 14 564 | 184 513 | 125 307 | 59 206 | 12.7 | 8.6 | 4.1 | 1.55 | 7.7 | 73.1 | 79.6 |
| 1987 | 14 665 | 186 667 | 122 199 | 64 468 | 12.7 | 8.3 | 4.4 | 1.56 | 7.6 | 73.5 | 80.1 |
| 1988 | 14 758 | 186 647 | 124 163 | 62 484 | 12.6 | 8.4 | 4.2 | 1.55 | 6.8 | 73.7 | 80.2 |
| 1989 | 14 849 | 188 979 | 128 905 | 60 086 | 12.7 | 8.7 | 4.0 | 1.55 | 6.8 | 73.7 | 79.9 |
| 1990 | 14 951 | 197 965 | 128 824 | 69 115 | 13.2 | 8.6 | 4.6 | 1.62 | 7.1 | 73.8 | 80.1 |
| 1991 | 15 070 | 198 665 | 129 958 | 68 707 | 13.2 | 8.6 | 4.6 | 1.61 | 6.5 | 74.1 | 80.2 |
| 1992 | 15 184 | 196 734 | 129 887 | 66 847 | 13.0 | 8.6 | 4.4 | 1.59 | 6.3 | 74.3 | 80.3 |
| 1993 | 15 290 | 195 748 | 137 795 | 57 953 | 12.8 | 9.0 | 3.8 | 1.57 | 6.3 | 74.0 | 80.0 |
| 1994 | 15 383 | 195 611 | 133 471 | 62 140 | 12.7 | 8.7 | 4.0 | 1.57 | 5.6 | 74.6 | 80.3 |
| 1995 | 15 459 | 190 513 | 135 675 | 54 838 | 12.3 | 8.8 | 3.5 | 1.531 | 5.5 | 74.6 | 80.4 |
| 1996 | 15 528 | 189 521 | 137 561 | 51 960 | 12.2 | 8.9 | 3.3 | 1.529 | 5.7 | 74.7 | 80.4 |
| 1997 | 15 611 | 192 443 | 135 783 | 56 660 | 12.3 | 8.7 | 3.6 | 1.562 | 5.0 | 75.2 | 80.6 |
| 1998 | 15 706 | 199 412 | 137 968 | 61 444 | 12.7 | 8.8 | 3.9 | 1.628 | 5.2 | 75.2 | 80.7 |
| 1999 | 15 812 | 200 445 | 140 487 | 59 958 | 12.7 | 8.9 | 3.8 | 1.652 | 5.2 | 75.3 | 80.5 |
| 2000 | 15 924 | 206 619 | 140 527 | 66 092 | 13.0 | 8.8 | 4.2 | 1.723 | 5.1 | 75.5 | 80.6 |
| 2001 | 16 044 | 202 603 | 140 377 | 62 226 | 12.6 | 8.7 | 3.9 | 1.710 | 5.4 | 75.8 | 80.7 |
| 2002 | 16 149 | 202 083 | 142 355 | 59 728 | 12.5 | 8.8 | 3.7 | 1.731 | 5.0 | 76.0 | 80.7 |
| 2003 | 16 225 | 200 297 | 141 936 | 58 361 | 12.3 | 8.7 | 3.6 | 1.747 | 4.8 | 76.2 | 80.9 |
| 2004 | 16 282 | 194 007 | 136 553 | 57 454 | 11.9 | 8.4 | 3.5 | 1.726 | 4.4 | 76.9 | 81.4 |
| 2005 | 16 320 | 187 910 | 136 402 | 51 508 | 11.5 | 8.4 | 3.2 | 1.708 | 4.9 | 77.2 | 81.6 |
| 2006 | 16 346 | 185 057 | 135 372 | 49 685 | 11.3 | 8.3 | 3.0 | 1.720 | 4.4 | 77.6 | 81.9 |
| 2007 | 16 382 | 181 336 | 133 022 | 48 314 | 11.1 | 8.1 | 2.9 | 1.718 | 4.1 | 78.0 | 82.3 |
| 2008 | 16 446 | 184 634 | 135 136 | 49 498 | 11.2 | 8.2 | 3.0 | 1.773 | 3.8 | 78.3 | 82.3 |
| 2009 | 16 530 | 184 915 | 134 235 | 50 680 | 11.2 | 8.1 | 3.1 | 1.790 | 3.8 | 78.5 | 82.7 |
| 2010 | 16 615 | 184 397 | 136 058 | 48 339 | 11.1 | 8.2 | 2.9 | 1.796 | 3.8 | 78.8 | 82.7 |
| 2011 | 16 693 | 180 060 | 135 741 | 44 319 | 10.8 | 8.1 | 2.7 | 1.759 | 3.6 | 79.2 | 82.8 |
| 2012 | 16 754 | 175 959 | 140 813 | 35 146 | 10.5 | 8.4 | 2.1 | 1.723 | 3.7 | 79.1 | 82.8 |
| 2013 | 16 803 | 171 341 | 141 245 | 30 096 | 10.2 | 8.4 | 1.8 | 1.679 | 3.8 | 79.4 | 83.0 |
| 2014 | 16 865 | 175 181 | 139 073 | 35 434 | 10.3 | 8.2 | 2.1 | 1.713 | 79.9 | 83.3 | |
| 2015 | 16 900 | 170 510 | 147 134 | 23 376 | 10.0 | 8.7 | 1.3 | 1.658 | 79.7 | 83.1 | |
| 2016 | 16 979 | 172 520 | 148 997 | 23 523 | 10.2 | 8.8 | 1.3 | 1.654 | 79.9 | 83.2 | |
| 2017 | 17 082 | 169 200 | 150 027 | 19 173 | 9.9 | 8.8 | 1.1 | 1.607 | 80.1 | 83.4 |
Current natural increase
- Number of births for January–August 2017 =

- Number of births for January–August 2018 =
- Number of deaths for January–August 2017 =

- Number of deaths for January–August 2018 =
- Natural growth for January–August 2017 =
- Natural growth for January–August 2018 =
Migration and ethnicity
According to Eurostat, in 2010 there were 1,800,000 foreign-born residents in the Netherlands, corresponding to 11.1% of the total population. Of these, 1,400,000 (8.5%) were born outside the EU and 428,000 (2.6%) were born in another EU member state. The most common countries of birth being: Belgium, Germany, Poland and the United Kingdom.[14]
As the result of immigration from overseas, the Netherlands has a sizeable minority of non-indigenous peoples. There is also considerable levels of emigration. In 2005, some 121,000 people left the country, while 94,000 entered it. Out of a total of 101,150 people emigrating to the Netherlands in 2006, 66,658 were from Europe, Oceania, the Americas or Japan, and 34,492 were from other (mostly developing) countries. Out of a total of 132,470 emigrants, 94,834 were going to Europe, Oceania, the Americas or Japan and 37,636 to other countries.[15]
A large number[16] of immigrants come from countries in Western Europe, mostly from the neighbouring countries of Germany and Belgium. There were five subsequent waves of immigration to the Netherlands in recent history.
- In the late-1940s and into the 1950s, following the end of the Second World War, people from the newly independent Republic of Indonesia repatriated or emigrated to the Netherlands - mainly Indo-European (people of mixed European and Indonesian ancestry with Dutch passports) and supporters of the Republic of South Maluku.
- In the 1960s and 1970s, migrants from Southern Europe (i.e. Italy, Portugal, Spain), Turkey and Morocco came to work in the Netherlands as guest workers. They were expected to return to their own country and many did, but others remained and in the 1980s and 1990s; were joined by their families. Until 2004, when marriage immigration was restricted, their children usually married others from their home country.
- In the 1970s and 1980s, people emigrated from the newly independent Suriname and from the Netherlands Antilles, which remained part of the Kingdom of the Netherlands. These people emigrated to the "mother country", because these people still retained Dutch citizenship and saw a better future in the Netherlands than in their birth countries.
- In the 1990s, the Netherlands saw increasing migration of asylum seekers,[17] most notably Iraqis, Iranians, Thais, Burmese and Chileans fleeing from political oppression and/or persecution.
- And in the 2000s, migrant workers from the newly-joined EU member states in Central and Eastern Europe, including: Poland, Romania and Bulgaria, and non-EU states Moldova, Ukraine and the former Yugoslavia. In 2005, non-Western ethnic population comprised 1.7 million individuals, about 10% of the population in the country.[18]
- The Syrian Civil War which started in 2011 resulted in a large influx of Syrian asylum seekers and close to a 100.000 Syrians where granted asylum in the Netherlands.
Illegal immigration to the Netherlands results in automatic deportation[19] but this is often not enforced for various reasons such as unknown country of origin, etc. Many Dutch provinces in 2012 had quotas for deporting illegal immigrants.[20][21][22][23]
During 2017 persons with an immigration background became a majority in, Amsterdam, Rotterdam and The Hague, the three largest cities of the Netherlands.[24]
In 2005 according to the Sociaal en Cultureel Planbureau annual report, ethnic minorities were poorly integrated into Dutch society and increasing unemployment and rising dependence on welfare were noted. As many immigrants had low education and poor skills in the Dutch language, they were more strongly affected by the economic downturn. The report also noted that Dutch and immigrant populations tended to avoid contact with each other on the personal level and that this phenomenon was in both directions. Turks, Moroccans, Somalis and some of the Antilleans were the least integrated into Dutch society, while Iranians were the best integrated with the highest education levels and modern lifestyles. While half of all Dutch pupils proceed to secondary education, for Turks and Somalis the share was a fifth and for Somali pupils even lower.[18]
In 2012, at 12% non-Western migrants were six times more likely than native Dutch to receive sofial welfare benefits, with 2% for the Dutch.[25]
It should be noted that immigrants from foreign countries are divided into several ethnic groups. For example, there are both Russians and Chechenians from Russia, Turks and Kurds from Turkey, Serbs and Albanians from Serbia and immigrants from Iran are divided into Persians, Azeris and Kurds.[26]
Ethnic groups
With the huge expansion of the European Union during the 2000s, the Netherlands has seen a rise in the number of immigrants coming from new member states. Migrant workers from these countries are estimated to be about 100,000 as of 2007.[27] Legal migrants from new EU-member states doubled between 2007-11 to 200,000,[28] with estimates totaling up to 300,000. Of the Poles who initially moved to the Netherlands in 2004, about a quarter had returned to Poland by 2006.[29]
As of 1 January 2018:[30]
| National origins or ethnic group | 2018 | 2017 | 2016 | 2015 | 2014 | 2013 | 2012 | 2010 | 2009 |
|---|---|---|---|---|---|---|---|---|---|
| Dutch (& Frisians) | 13 209 225 (76.88%) | 13 218 754 (77.39%) | 13 226 829 (77.90%) | 13 235 405 (78.31%) | 13 234 545 (78.64%) | 13 236 494 (78.89%) | 13 236 618 (79.12%) | 13 215 458 (79.72%) | 13 196 916 (80.05%) |
| Turkish (& Kurdish) | 404 459 (2.35%) | 400 367 (2.34%) | 397 471 (2.34%) | 396 555 (2.35%) | 396 414 (2.36%) | 392 923 (2.34%) | 392 923 (2.35%) | 384 164 (2.32%) | 378 400 (2.30%) |
| Moroccan (& Berber) | 396 539 (2.31%) | 391 088 (2.29%) | 385 761 (2.27%) | 380 755 (2.25%) | 374 996 (2.23%) | 368 838 (2.20%) | 362 954 (2.17%) | 349 270 (2.11%) | 341 640 (2.07%) |
| Indo (& Moluccans) | 361 594 (2.10%) | 364 328 (2.13%) | 366 849 (2.16%) | 369 661 (2.19%) | 372 233 (2.21%) | 374 847 (2.23%) | 377 618 (2.26%) | 382 319 (2.31%) | 384 553 (2.33%) |
| Germans | 354 136 (2.06%) | 356 875 (2.09%) | 360 116 (2.12%) | 364 125 (2.15%) | 368 512 (2.19%) | ? | ? | 379 017 (2.29%) | 379 518 (2.30%) |
| Surinamese | 351 681 (2.05%) | 349 978 (2.05%) | 349 022 (2.06%) | 348 662 (2.06%) | 348 291 (2.07%) | 344 734 (2.05%) | 344 734 (2.06%) | 342 016 (2.06%) | 338 519 (2.05%) |
| Poles | 173 050 (1.01%) | 161 158 (0.94%) | 149 831 (0.88%) | 137 794 (0.82%) | 123 003 (0.73%) | 111 121 (0.66%) | 100 775 (0.60%) | 77 178 (0.47%) | 68 844 (0.42%) |
| Dutch Caribbean people | 153 469 (0.90%) | 150 981 (0.89%) | 148 926 (0.88%) | 146 855 (0.87%) | 145 499 (0.87%) | 143 992 (0.86%) | 138 113 (0.83%) | 134 486 (0.82%) | |
| Belgians | 118 725 (0.69%) | 117 495 (0.69%) | 116 389 (0.69%) | 115 687 (0.68%) | ? | ? | ? | ? | 112 529 (0.68%) |
| British | 88 390 (0.51%) | 86 293 (0.51%) | 84 466 (0.50%) | 82 879 (0.49%) | ? | ? | ? | ? | 77 733 (0.47%) |
| Former Yugoslavs | 85 504 (0.50%) | 84 243 (0.50%) | 83 261 (0.49%) | ? | ? | ? | ? | 77 995 (0.47%) | |
| Former Soviet Union | 84 498 (0.49%) | 80 013 (0.47%) | 76 102 (0.45%) | ? | ? | ? | ? | 52 563 (0.32%) | |
| Syrians | 90 771 (0.53%) | 72 903 (0.43%) | 43 838 (0.26%) | 22 568 (0.13%) | 13 744 (0.08%) | 11 665 (0.07%) | 11 025 (0.07%) | 10 263 (0.06%) | 9 976 (0.06%) |
| Chinese | 74 234 (0.43%) | 71 229 (0.42%) | 68 697 (0.40%) | 66 088 (0.39%) | ? | ? | ? | ? | 50 681 (0.31%) |
| Iraqis | 61 255 (0.36%) | 59 497 (0.35%) | 56 269 (0.33%) | ? | ? | ? | ? | ? | 49 234 (0.30%) |
| Italians | 53 703 (0.31%) | 50 925 (0.30%) | 48 366 (0.28%) | ? | ? | ? | ? | ? | ? |
| Afghans | 47 776 (0.28%) | 46 701 (0.27%) | 44 339 (0.26%) | ? | ? | ? | ? | ? | 37 739 (0.23%) |
| French | 45 558 (0.27%) | 43 836 (0.26%) | 42 070 (0.25%) | ? | ? | ? | ? | ? | ? |
| Spaniards | 42 926 (0.25%) | 41 572 (0.24%) | ? | ? | ? | ? | ? | ? | |
| Somalis | 39 737 (0.23%) | 39 457 (0.23%) | 39 465 (0.23%) | ? | ? | ? | ? | ? | 21 753 (0.13%) |
| Americans | 40 022 (0.23%) | 38 494 (0.23%) | ? | ? | ? | ? | ? | ? | |
| Iranians (Persians, Azeris and Kurds) | 42 464 (0.25%) | 40 893 (0.24%) | 38 458 (0.23%) | ? | ? | ? | ? | ? | 30 617 (0.19%) |
| Indians | 36 818 (0.22%) | 32 682 (0.19%) | ? | ? | ? | ? | ? | ? | |
| Bulgarians | 27 729 (0.16%) | 25 520 (0.15%) | ? | ? | ? | ? | ? | ? | |
| Portuguese | 25 637 (0.15%) | 24 930 (0.15%) | ? | ? | ? | ? | ? | ? | |
| Romanians | 25 551 (0.15%) | 23 020 (0.14%) | ? | ? | ? | ? | ? | ? | |
| Brazilians | 24 725 (0.14%) | 23 675 (0.14%) | ? | ? | ? | ? | ? | ? | |
| Egyptians | 23 956 (0.14%) | 23 198 (0.14%) | ? | ? | ? | ? | ? | ? | |
| Ghanaians | 23 430 (0.14%) | 23 168 (0.14%) | ? | ? | ? | ? | ? | ? | |
| Hungarians | 22 870 (0.13%) | 22 080 (0.13%) | ? | ? | ? | ? | ? | ? | |
| Cape Verdeans | 22 285 (0.13%) | 22 157 (0.13%) | ? | ? | ? | ? | ? | ? | |
| Greeks | 22 141 (0.13%) | 20 769 (0.12%) | ? | ? | ? | ? | ? | ? | |
| Pakistanis | 22 897 (0.13%) | 22 137 (0.13%) | 21 447 (0.13%) | ? | ? | ? | ? | ? | 18 636 (0.11%) |
| Vietnamese (Kinh) | 22 023 (0.13%) | 21 435 (0.13%) | ? | ? | ? | ? | ? | 18 913 (0.11%) | |
| Filipinos | 22 000 (0.13%) | 20 937 (0.12%) | 20 073 (0.12%) | ? | ? | ? | ? | ? | ? |
| South Africans (Afrikaners) | 20 859 (0.12%) | 19 877 (0.12%) | ? | ? | ? | ? | ? | ? | |
| Thai | 20 106 (0.12%) | 19 513 (0.11%) | ? | ? | ? | ? | ? | ? | |
| Ethiopians | 19 528 (0.11%) | 16 347 (0.10%) | ? | ? | ? | ? | ? | ? | |
| Hong Kongers | 18 357 (0.11%) | 18 300 (0.11%) | ? | ? | ? | ? | ? | ? | |
| Colombians | 16 607 (0.10%) | 15 892 (0.09%) | ? | ? | ? | ? | ? | ? | |
| Australians | 16 597 (0.10%) | 16 127 (0.09%) | ? | ? | ? | ? | ? | ? | |
| Canadians | 16 240 (0.09%) | 15 944 (0.09%) | 15 625 (0.09%) | ? | ? | ? | ? | ? | ? |
| Austrians | 15 777 (0.09%) | 15 674 (0.09%) | ? | ? | ? | ? | ? | ? | |
| Rest of Sub-Saharan Africa | 97 026 (0.57%) | 91 797 (0.54%) | ? | ? | ? | ? | ? | ? | |
| Rest of Europe | 68 592 (0.40%) | 65 849 (0.39%) | ? | ? | ? | ? | ? | ? | |
| Rest of Americas (except Caribbean) | 47 048 (0.28%) | 45 256 (0.27%) | ? | ? | ? | ? | ? | ? | |
| Rest of North Africa and Middle East | 46 231 (0.27%) | 44 059 (0.26%) | ? | ? | ? | ? | ? | ? | |
| Rest of East and Southeast Asia | 34 562 (0.20%) | 33 473 (0.20%) | ? | ? | ? | ? | ? | ? | |
| Rest of Caribbean | 21 514 (0.13%) | 20 956 (0.12%) | ? | ? | ? | ? | ? | ? | |
| Rest of South Asia | 17 448 (0.10%) | 16 762 (0.10%) | ? | ? | ? | ? | ? | ? | |
| Rest of Oceania | 6 062 (0.04%) | 5 916 (0.03%) | ? | ? | ? | ? | ? | ? | |
| Others | 1 094 826 (6,48%) | 1 587 433 (9,43%) | 1 437 462 (8,57%) | 1 437 462 (8,59%) | 1 387 255 (8,37%) | 715 055 (4,34%) | |||
| Total | 17 181 084 | 17 081 507 | 16 979 120 | 16 900 726 | 16 829 289 | 16 779 575 | 16 730 348 | 16 577 612 | 16 486 587 |
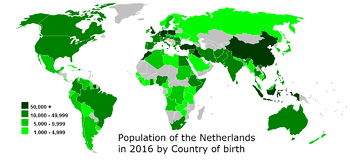
| Region of the World | 2018 | 2017 | 2016 |
|---|---|---|---|
| Netherlands | 13 209 225 (76.88%) | 13 218 754 (77.39%) | 13 226 829 (77.90%) |
| Europe (Except Netherlands) | 1 237 807 (7.25%) | 1 204 908 (7.10%) | |
| North Africa and Middle East | 1 081 636 (6.33%) | 1 033 393 (6.09%) | |
| East and South East Asia | 551 542 (3.23%) | 548 340 (3.23%) | |
| Caribbean and Suriname | 524 961 (3.07%) | 520 959 (3.07%) | |
| Sub-Saharan Africa | 222 585 (1.30%) | 212 811 (1.25%) | |
| Americas (Except Caribbean and Suriname) | 144 346 (0.85%) | 138 942 (0.82%) | |
| South Asia | 76 403 (0.45%) | 70 891 (0.42%) | |
| Oceania | 22 659 (0.13%) | 22 043 (0.13%) | |
Emigration
The Netherlands has seen considerable emigration. In the 1950s 560,000 people migrated to the United States, South Africa, Australia, Canada and New Zealand, leaving their war-torn and overpopulated home country behind. At least 60,000 of these migrants were Indo-European (mixed Dutch-Indonesian) repatriants that moved on, mostly to the United States, after being repatriated to the Netherlands from the former Dutch East Indies during and after the Indonesian revolution.
In 2005 some 121,000 people migrated from the Netherlands. There is considerable migration towards neighbouring states, Belgium, Germany and the United Kingdom and to the Netherlands Antilles. Furthermore, almost half of the current emigration consists of people returning to their country of birth, including rejected asylum seekers, after the more stringent migration laws were implemented.
Religion
In 2013, Statistics Netherlands found that 26% of the population identified as Roman Catholic, 16% as Protestant, 5% as Muslim, and 6% as "other" (the last includes other Christian denominations, Hindus 0.6%, Jews 0.1%, and Buddhists 0.4%). The agency interviewed 355,237 people in the period 2010-2013. [31]
Religious identification of the adult population in the Netherlands (2015)[32]
Language
The main language is Dutch, while Frisian (known as Frisian outside of the Netherlands) is also a recognized language in the province of Fryslân and is used by the government and schools there. Several dialects of Low Saxon (Nedersaksisch in Dutch) are spoken in much of the north and east and are recognized by the Netherlands as regional languages according to the European Charter for Regional or Minority Languages. This includes the Tweants dialect. Another Dutch dialect granted the status of regional language is Limburgish, which is spoken in the south-eastern province of Limburg. Major immigrant languages are Indonesian, Turkish, Arabic, Berber, Papiamento, German and Polish.
See also
Notes
- 1 2 3 In 2004, the Dutch Reformed Church (NHK) and the Reformed Churches in the Netherlands (GKN) merged to form the Protestant Church in the Netherlands (PKN) and officially no longer exist. However, many people still tend to give their older affiliation even after the merger. People who declared themselves simply as belonging to the Protestant Church in the Netherlands did not give an information about belonging to an older affiliation.[33]
References
- ↑ CBS Statline - Population; history. Statistics Netherlands. Retrieved on 2009-03-08.
- ↑ Netherlands, Statistics. "Population counter". Cbs.nl. Retrieved 5 October 2017.
- 1 2 "The World Factbook". cia.gov.
- ↑ Statistics Netherlands.
- ↑ Netherlands, Statistics. "Largest families in Urk". Cbs.nl. Retrieved 5 October 2017.
- ↑ Netherlands, Statistics. "Population growth 46 thousand in 2007". Cbs.nl. Retrieved 5 October 2017.
- ↑
- ↑
- ↑ "Bevolkingsprognose 2007–2014: tijdelijk hogere groei" (PDF). Cbs.nl. Retrieved 5 October 2017.
- ↑ Charles F. Westoff; Tomas Frejka. "Fertility and Religiousness Among European Muslims". Paa2007.princeton.edu. Retrieved 5 October 2017.
- 1 2 3 4 5 6 7 8 9 10 "Life expectancy". Our World in Data. Retrieved 2018-08-28.
- ↑ CBS Statistics Netherlands Archived November 14, 2010, at the Wayback Machine.
- ↑ "Population". Centraal Bureau voor de Statistiek. Retrieved 28 September 2018.
- ↑ VASILEVA, Katya. "6.5% of the EU population are foreigners and 9.4% are born abroad (34/2011)" (PDF). Eurostat. Archived from the original (PDF) on 2012-01-28.
- ↑ "CBS StatLine - External migration; sex, age (31 dec), marital status and country of birth". cbs.nl.
- ↑ "Netherlands". focus-migration.hwwi.de. Retrieved 6 April 2017.
- ↑ "Substantial increase asylum seekers". cbs.nl. 29 January 2015. Retrieved 6 April 2017.
- 1 2 "Jaarrapport Integratie 2005 - SCP Summary". www.scp.nl (in Dutch). pp. 1–3. Retrieved 2018-09-15.
- ↑ "Dutch float 'migrant prison' scheme". BBC. Retrieved 2012-05-05.
- ↑ "Anti-immigrant website fans flames in the Netherlands". Vancouver Sun. Archived from the original on 2012-04-29. Retrieved 2012-05-05.
- ↑ "Dutch Police to Scan Fingerprints in Checks for Illegal Immigrants". Voice of America. Retrieved 2012-05-05.
- ↑ "Government gets tougher with illegal immigrants". Radio Netherlands. Archived from the original on 2012-04-28. Retrieved 2012-05-05.
- ↑ "Clash over illegal alien arrest quota". Radio Netherlands. Archived from the original on 2012-04-01. Retrieved 2012-05-05.
- ↑ Statistiek, Centraal Bureau voor de. "CBS". Centraal Bureau voor de Statistiek (in Dutch). Retrieved 2018-09-17.
- ↑ "Annual Integration Report 2013 Summary". www.scp.nl. SCP. p. 191. Retrieved 2018-09-16.
- ↑ https://www.cbs.nl/en-gb
- ↑ "Donner: 100.000 Oost-Europeanen werken in Nederland". Volkskrant.nl. 2007-11-25. Retrieved 2007-11-25.
- ↑ "Aantal Midden- en Oost-Europeanen in vijf jaar tijd verdubbeld". CBS. 2011-07-25. Retrieved 2011-11-29.
- ↑ "Immigratie Oost-Europeanen blijft hoog". CBS. 2007-11-28. Retrieved 2007-11-28.
- ↑ "CBS StatLine - Bevolking; generatie, geslacht, leeftijd en herkomstgroepering, 1 januari". Statline.cbs.nl. Retrieved 5 October 2017.
- ↑ Schmeets, Hans (2014). De religieuze kaart van Nederland, 2010-2013 (PDF). Centraal Bureau voor de Statistiek. p. 4. Retrieved 23 April 2015.
- ↑ CBS religion Table 3.1.1
- ↑ Schmeets, Hans; Mensvoort, Carly van (2011). Religieuze betrokkenheid van bevolkingsgroepen, 2010–2014 (PDF). Centraal Bureau voor der Statistiek. Retrieved 21 February 2018.
External links
| Wikimedia Commons has media related to Demographics of the Netherlands. |
- CIA World Factbook data
- CBS Dutch Bureau of Statistics
| Africa | |||||||||
|---|---|---|---|---|---|---|---|---|---|
| Asia |
| ||||||||
| Europe | |||||||||
| North America | |||||||||
| South America | |||||||||