Demographics of Poland

Alternative map
The demographics of Poland constitute all demographic features of the population of Poland, including population density, ethnicity, education level, health of the populace, economic status, religious affiliations and other aspects of the population.
According to the 2011 census by the Polish Central Statistical Office (GUS), at the end of 2011 Poland had a population of 38,538,447[1], which translates into an average population density of 123 people/km2 (urban 1105 per 1 km², rural 50 per 1 km²). 61.5% of the Polish population lives in urban areas, a number which is slowly diminishing. Poland is the 33rd most populous country in the world (9th in Europe, with 5.4% of the European population). Total population of Poland is almost stagnant (population growth was 0.08%). Average life expectancy was 70.5 for men and 78.9 for women. In 2009, it was expected to be 73.1 for men and 79.5 for women. Population distribution is uneven. Ethnically, Poland is a very homogeneous country, with 96.7% of population being Polish.
A number of censuses have assessed this data, including a national census in 2002, and a survey by the Helsinki Foundation for Human Rights (HFHR), which confirmed there are numerous autochthonous ethnic groups in Poland. Estimates by INTEREG and Eurominority present a similar demographic picture of Poland but they provide estimates only for the most numerous of these ethnic groups.
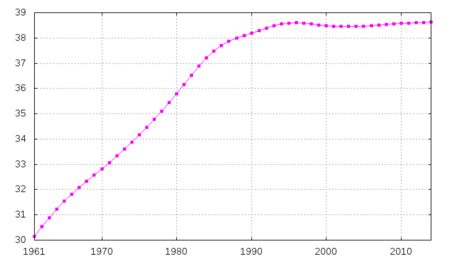
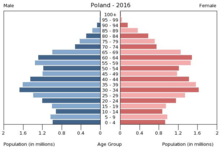
Like many developed nations, Poland is ageing. In 1950, the median age was 25.8: half of the Polish population was younger, half older. Today it is 38.2. If current trends continue, it may be 51 by 2050.[2] As the population is ageing, it also started to decline in the 1990s mainly due to low birth rates and continued emigration which impacted the economy, however this has started to change. The number of children born in Polish families (TFR of 1.31, down from 2 in 1990) is one of the lowest in Central Europe, but has started to improve in recent years.[3][4]
Historical population
For many centuries, until the end of World War II in 1945, the population of Poland included many significant ethnic minorities.
Twentieth century
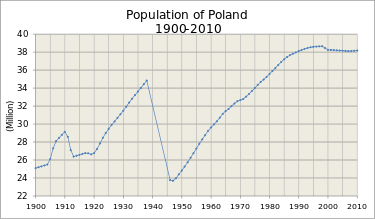
The population of Poland decreased by about six million due to the losses sustained during the Holocaust and German occupation during World War II (1939-1945), and Poland became one of the most ethnically homogeneous areas in Europe (next to the populations of Slovakia and the Czech Republic) as a result of radically altered borders and population expulsions at the end of and after the war. The post-war population movements were accompanied by two waves of forced migrations ordered by the Soviet and Polish communist authorities, including the transfers of sizable Polish populations (1944-1946) from the pre-war territories of Eastern Poland, which today form parts of Lithuania, of Belarus and of Ukraine, the transfer of ethnic Ukrainians back to the USSR (1944-1946), and the expulsion of Germans (1945-1950) to Germany from German provinces which fell into the Soviet Zone of Occupation and which the Soviets then awarded to the communist government in Poland.
Recent trends
According to GUS, about 38,325,000 people live in Poland, however, the same report states that the number of residents living in the country all the time is approximately 37,200,000; with 1,125,000 people living abroad for 6 to 7 months or more. It means that the permanent population may be correspondingly smaller.[5]
In the 21st century many Poles migrated following Poland's accession to the European Union in 2004 and the opening of the EU's labor market; with approximately 2 million (primarily young) Poles taking up jobs abroad.[6]
Vital statistics
Total Fertility Rate from 1800 to 1920
The total fertility rate is the number of children born per woman. It is based on fairly good data for the entire period. Sources: Our World In Data and Gapminder Foundation.[7]
| Years | 1800 | 1801 | 1802 | 1803 | 1804 | 1805 | 1806 | 1807 | 1808 | 1809 | 1810[7] |
|---|---|---|---|---|---|---|---|---|---|---|---|
| Total Fertility Rate in Poland | 6.28 | 6.26 | 6.25 | 6.23 | 6.22 | 6.2 | 6.19 | 6.17 | 6.16 | 6.14 | 6.12 |
| Years | 1811 | 1812 | 1813 | 1814 | 1815 | 1816 | 1817 | 1818 | 1819 | 1820[7] |
|---|---|---|---|---|---|---|---|---|---|---|
| Total Fertility Rate in Poland | 6.11 | 6.09 | 6.08 | 6.06 | 6.05 | 6.03 | 6.03 | 6.16 | 6.3 | 6.03 |
| Years | 1821 | 1822 | 1823 | 1824 | 1825 | 1826 | 1827 | 1828 | 1829 | 1830[7] |
|---|---|---|---|---|---|---|---|---|---|---|
| Total Fertility Rate in Poland | 6.3 | 6.03 | 5.76 | 5.49 | 6.83 | 6.16 | 6.3 | 6.22 | 6.14 | 6.06 |
| Years | 1831 | 1832 | 1833 | 1834 | 1835 | 1836 | 1837 | 1838 | 1839 | 1840[7] |
|---|---|---|---|---|---|---|---|---|---|---|
| Total Fertility Rate in Poland | 5.98 | 5.9 | 6.43 | 6.83 | 5.9 | 6.3 | 6.57 | 6.03 | 6.43 | 6.57 |
| Years | 1841 | 1842 | 1843 | 1844 | 1845 | 1846 | 1847 | 1848 | 1849 | 1850[7] |
|---|---|---|---|---|---|---|---|---|---|---|
| Total Fertility Rate in Poland | 6.16 | 6.43 | 6.3 | 6.03 | 5.36 | 5.49 | 5.09 | 4.82 | 5.49 | 5.63 |
| Years | 1851 | 1852 | 1853 | 1854 | 1855 | 1856 | 1857 | 1858 | 1859 | 1860[7] |
|---|---|---|---|---|---|---|---|---|---|---|
| Total Fertility Rate in Poland | 5.63 | 5.49 | 5.63 | 5.36 | 4.82 | 5.36 | 5.76 | 6.3 | 6.57 | 6.57 |
| Years | 1861 | 1862 | 1863 | 1864 | 1865 | 1866 | 1867 | 1868 | 1869 | 1870[7] |
|---|---|---|---|---|---|---|---|---|---|---|
| Total Fertility Rate in Poland | 6.43 | 6.97 | 6.57 | 6.2 | 5.83 | 5.46 | 5.09 | 5.63 | 5.63 | 6.16 |
| Years | 1871 | 1872 | 1873 | 1874 | 1875 | 1876 | 1877 | 1878 | 1879 | 1880[7] |
|---|---|---|---|---|---|---|---|---|---|---|
| Total Fertility Rate in Poland | 5.76 | 5.49 | 5.76 | 5.76 | 5.49 | 5.49 | 5.23 | 5.23 | 5.36 | 5.23 |
| Years | 1881 | 1882 | 1883 | 1884 | 1885 | 1886 | 1887 | 1888 | 1889 | 1890[7] |
|---|---|---|---|---|---|---|---|---|---|---|
| Total Fertility Rate in Poland | 5.09 | 5.23 | 5.23 | 5.09 | 5.36 | 5.36 | 5.36 | 5.49 | 5.76 | 5.63 |
| Years | 1891 | 1892 | 1893 | 1894 | 1895 | 1896 | 1897 | 1898 | 1899 | 1900[7] |
|---|---|---|---|---|---|---|---|---|---|---|
| Total Fertility Rate in Poland | 5.63 | 5.36 | 5.63 | 5.9 | 5.9 | 5.76 | 5.63 | 5.49 | 5.49 | 5.49 |
| Years | 1901 | 1902 | 1903 | 1904 | 1905 | 1906 | 1907 | 1908 | 1909 | 1910[7] |
|---|---|---|---|---|---|---|---|---|---|---|
| Total Fertility Rate in Poland | 5.36 | 5.36 | 5.09 | 5.09 | 4.96 | 5.09 | 5.09 | 4.96 | 4.96 | 4.82 |
| Years | 1911 | 1912 | 1913 | 1914 | 1915 | 1916 | 1917 | 1918 | 1919 | 1920[7] |
|---|---|---|---|---|---|---|---|---|---|---|
| Total Fertility Rate in Poland | 4.69 | 4.56 | 4.69 | 4.82 | 3.89 | 3.62 | 3.22 | 3.22 | 4.42 | 4.69 |
Vital statistics from 1921 to 1945
| Year [11] | Average population | Live births | Deaths | Natural change | Crude birth rate (per 1000) | Crude death rate (per 1000) | Natural change (per 1000) | Total fertility rates[fn 1][7] |
|---|---|---|---|---|---|---|---|---|
| 1921 | 27 224 000 | 890 400 | 568 300 | 322 100 | 32.7 | 20.9 | 11.8 | 4.4 |
| 1922 | 27 846 000 | 983 100 | 554 600 | 482 500 | 35.3 | 19.9 | 15.4 | 4.73 |
| 1923 | 28 480 000 | 1 014 700 | 493 800 | 520 900 | 35.6 | 17.3 | 18.3 | 4.82 |
| 1924 | 29 007 000 | 1 000 100 | 519 200 | 480 900 | 34.5 | 17.9 | 16.6 | 4.69 |
| 1925 | 29 475 000 | 1 036 600 | 492 200 | 544 400 | 35.2 | 16.7 | 18.5 | 4.74 |
| 1926 | 29 906 000 | 989 100 | 532 700 | 456 400 | 33.1 | 17.8 | 15.3 | 4.44 |
| 1927 | 30 302 000 | 958 733 | 525 633 | 433 100 | 31.6 | 17.3 | 14.3 | 4.23 |
| 1928 | 30 693 000 | 990 993 | 504 207 | 486 786 | 32.3 | 16.4 | 15.9 | 4.29 |
| 1929 | 31 084 000 | 994 101 | 518 929 | 475 172 | 32.0 | 16.7 | 15.3 | 4.26 |
| 1930 | 31 490 000 | 1 022 811 | 488 417 | 534 394 | 32.5 | 15.5 | 17.0 | 4.33 |
| 1931 | 31 935 000 | 964 573 | 493 703 | 470 870 | 30.2 | 15.5 | 14.7 | 4.05 |
| 1932 | 32 394 000 | 934 663 | 486 548 | 448 115 | 28.9 | 15.0 | 13.8 | 3.87 |
| 1933 | 32 823 000 | 868 675 | 466 210 | 402 465 | 26.5 | 14.2 | 12.3 | 3.55 |
| 1934 | 33 223 000 | 881 615 | 479 684 | 401 931 | 26.5 | 14.4 | 12.1 | 3.56 |
| 1935 | 33 616 000 | 876 667 | 470 998 | 405 669 | 26.1 | 14.0 | 12.1 | 3.5 |
| 1936 | 34 020 000 | 892 320 | 482 633 | 409 687 | 26.2 | 14.2 | 12.0 | 3.51 |
| 1937 | 34 441 000 | 856 064 | 481 594 | 374 470 | 24.9 | 14.0 | 10.9 | 3.34 |
| 1938 | 34 849 000 | 849 873 | 479 602 | 370 271 | 24.4 | 13.8 | 10.6 | 3.26 |
| Years | 1939 | 1940 | 1941 | 1942 | 1943 | 1944 | 1945[7] |
|---|---|---|---|---|---|---|---|
| Total Fertility Rate in Poland | 3.23 | 3.21 | 3.18 | 3.16 | 3.13 | 3.11 | 3.08 |
After World War II
[12] [13] [14] [15] [16] [17][7][18]
| Average population | Live births | Deaths | Natural change | Crude birth rate (per 1000) | Crude death rate (per 1000) | Natural change (per 1000) | Total fertility rates | Life expectancy (males) | Life expectancy (females) | Share of births outside marriage | Immigration | Emigration | Net external migration | |
|---|---|---|---|---|---|---|---|---|---|---|---|---|---|---|
| 1946 | 23 777 000 | 570 000 | 335 000 | 235 000 | 24.0 | 14.1 | 9.9 | 3.06 | ||||||
| 1947 | 23 970 000 | 630 000 | 271 000 | 359 000 | 26.3 | 11.3 | 15.0 | 3.51 | ||||||
| 1948 | 23 980 000 | 704 772 | 268 000 | 436 772 | 29.4 | 11.2 | 18.2 | 3.93 | ||||||
| 1949 | 24 410 000 | 725 061 | 284 000 | 441 061 | 29.7 | 11.6 | 18.1 | 3.94 | ||||||
| 1950 | 24 824 000 | 763 108 | 288 685 | 474 423 | 30.7 | 11.6 | 19.1 | 3,705 | 56,07 | 61,68 | ||||
| 1951 | 25 271 000 | 783 597 | 312 314 | 471 283 | 31.0 | 12.4 | 18.6 | 3,745 | 55,11 | 60,67 | ||||
| 1952 | 25 753 000 | 778 962 | 286 730 | 492 232 | 30.2 | 11.1 | 19.1 | 3,670 | 57,59 | 63,07 | ||||
| 1953 | 26 255 000 | 779 000 | 266 527 | 512 473 | 29.7 | 10.2 | 19.5 | 3,605 | 59,58 | 65,05 | ||||
| 1954 | 26 761 000 | 778 054 | 276 406 | 501 648 | 29.1 | 10.3 | 18.7 | 3,580 | 59,8 | 65,06 | ||||
| 1955 | 27 281 000 | 793 847 | 261 576 | 532 271 | 29.1 | 9.6 | 19.5 | 3,605 | 60,82 | 66,19 | ||||
| 1956 | 27 815 000 | 779 835 | 249 606 | 530 229 | 28.0 | 9.0 | 19.1 | 3,605 | 62,29 | 67,52 | ||||
| 1957 | 28 310 000 | 782 319 | 269 137 | 513 182 | 27.6 | 9.5 | 18.1 | 3,485 | 61,2 | 66,7 | ||||
| 1958 | 28 770 000 | 752 600 | 241 435 | 511 165 | 26.2 | 8.4 | 17.8 | 3,355 | 63,08 | 68,57 | ||||
| 1959 | 29 240 000 | 722 928 | 252 430 | 470 498 | 24.7 | 8.6 | 16.1 | 3,215 | 62,71 | 68,3 | ||||
| 1960 | 29 561 000 | 669 485 | 224 167 | 445 318 | 22.6 | 7.6 | 15.1 | 2,98 | 64,94 | 70,6 | ||||
| 1961 | 29 965 000 | 627 624 | 227 759 | 399 865 | 20.9 | 7.6 | 13.3 | 2,83 | 64,91 | 70,78 | ||||
| 1962 | 30 324 000 | 599 505 | 239 199 | 360 306 | 19.8 | 7.9 | 11.9 | 2,72 | 64,53 | 70,49 | ||||
| 1963 | 30 691 000 | 588 235 | 230 072 | 358 163 | 19.2 | 7.5 | 11.7 | 2,70 | 65,41 | 71,52 | ||||
| 1964 | 31 161 000 | 562 855 | 235 919 | 326 936 | 18.1 | 7.6 | 10.5 | 2,57 | 65,78 | 71,6 | ||||
| 1965 | 31 496 000 | 546 362 | 232 421 | 313 941 | 17.3 | 7.4 | 10.0 | 2,52 | 66,58 | 72,4 | ||||
| 1966 | 31 698 000 | 530 307 | 232 945 | 297 362 | 16.7 | 7.3 | 9.4 | 2,33 | 66,87 | 72,85 | ||||
| 1967 | 31 944 000 | 520 383 | 247 705 | 272 678 | 16.3 | 7.8 | 8.5 | 2,30 | 66,44 | 72,61 | ||||
| 1968 | 32 426 000 | 524 174 | 244 115 | 280 059 | 16.2 | 7.5 | 8.6 | 2,24 | 67,04 | 73,55 | ||||
| 1969 | 32 555 000 | 531 135 | 262 823 | 268 312 | 16.3 | 8.1 | 8.2 | 2,20 | 66,5 | 73,09 | ||||
| 1970 | 32 526 000 | 545 973 | 266 799 | 279 174 | 16.8 | 8.2 | 8.6 | 2,22 | 66,62 | 73,33 | 5,0 | |||
| 1971 | 32 805 000 | 562 341 | 283 702 | 278 639 | 17.1 | 8.6 | 8.5 | 2,25 | 66,13 | 73,25 | ||||
| 1972 | 33 068 000 | 575 725 | 265 250 | 310 475 | 17.4 | 8.0 | 9.4 | 2,24 | 67,32 | 74,17 | ||||
| 1973 | 33 363 000 | 598 559 | 277 188 | 321 371 | 17.9 | 8.3 | 9.6 | 2,24 | 67,15 | 74,3 | ||||
| 1974 | 33 691 000 | 621 080 | 277 085 | 343 995 | 18.4 | 8.2 | 10.2 | 2,26 | 67,8 | 74,64 | ||||
| 1975 | 34 022 000 | 643 772 | 296 896 | 346 876 | 18.9 | 8.7 | 10.2 | 2,27 | 67,02 | 74,26 | 4,7 | |||
| 1976 | 34 362 000 | 670 140 | 304 057 | 366 083 | 19.5 | 8.8 | 10.7 | 2,31 | 66,92 | 74,55 | ||||
| 1977 | 34 698 000 | 662 582 | 312 956 | 349 626 | 19.1 | 9.0 | 10.1 | 2,33 | 66,49 | 74,5 | ||||
| 1978 | 35 010 000 | 666 336 | 325 104 | 341 232 | 19.0 | 9.3 | 9.7 | 2,30 | 66,36 | 74,53 | ||||
| 1979 | 35 257 000 | 688 293 | 323 048 | 365 245 | 19.5 | 9.2 | 10.4 | 2,39 | 66,79 | 74,91 | 4,8 | |||
| 1980 | 35 578 000 | 692 798 | 350 203 | 342 595 | 19.5 | 9.8 | 9.6 | 2,42 | 66,01 | 74,44 | ||||
| 1981 | 35 902 000 | 678 696 | 328 923 | 349 773 | 18.9 | 9.2 | 9.7 | 2,34 | 67,1 | 75,24 | ||||
| 1982 | 36 227 000 | 702 351 | 334 869 | 367 482 | 19.4 | 9.2 | 10.1 | 2,38 | 67,24 | 75,2 | ||||
| 1983 | 36 571 000 | 720 756 | 349 388 | 371 368 | 19.7 | 9.6 | 10.2 | 2,41 | 67,04 | 75,16 | ||||
| 1984 | 36 914 000 | 699 041 | 364 883 | 334 158 | 18.9 | 9.9 | 9.1 | 2,36 | 66,84 | 74,97 | ||||
| 1985 | 37 203 000 | 677 576 | 381 458 | 296 118 | 18.2 | 10.3 | 8.0 | 2,33 | 66,5 | 74,81 | 5,0 | |||
| 1986 | 37 456 000 | 634 748 | 376 316 | 258 432 | 16.9 | 10.0 | 6.9 | 2,21 | 66,76 | 75,13 | ||||
| 1987 | 37 664 000 | 605 492 | 378 365 | 227 127 | 16.1 | 10.0 | 6.0 | 2,15 | 66,81 | 75,2 | ||||
| 1988 | 37 862 000 | 587 741 | 370 821 | 216 920 | 15.5 | 9.8 | 5.7 | 2,12 | 67,15 | 75,67 | ||||
| 1989 | 37 963 000 | 562 530 | 381 173 | 181 357 | 14.8 | 10.0 | 4.8 | 2,08 | 66,76 | 75,45 | ||||
| 1990 | 38 119 000 | 545 817 | 390 343 | 155 474 | 14.3 | 10.2 | 4.1 | 2,04 | 66,23 | 75,24 | 6,2 | |||
| 1991 | 38 245 000 | 547 719 | 405 716 | 142 003 | 14.3 | 10.6 | 3.7 | 2,05 | 65,88 | 75,06 | 6,6 | |||
| 1992 | 38 365 000 | 515 214 | 394 729 | 120 485 | 13.4 | 10.3 | 3.1 | 1,91 | 66,47 | 75,48 | 7,2 | |||
| 1993 | 38 459 000 | 494 310 | 392 259 | 102 051 | 12.9 | 10.2 | 2.7 | 1,86 | 67,17 | 75,81 | 8,2 | |||
| 1994 | 38 544 000 | 481 285 | 386 398 | 94 887 | 12.5 | 10.0 | 2.5 | 1,78 | 67,5 | 76,08 | 9,0 | |||
| 1995 | 38 588 000 | 443 109 | 386 084 | 57 025 | 11.5 | 10.0 | 1.5 | 1,65 | 67,62 | 76,39 | 9,5 | |||
| 1996 | 38 618 000 | 428 203 | 385 496 | 42 707 | 11.1 | 10.0 | 1.1 | 1,58 | 68,12 | 76,57 | 10,2 | |||
| 1997 | 38 650 000 | 412 635 | 380 201 | 32 434 | 10.7 | 9.8 | 0.8 | 1,52 | 68,45 | 76,99 | 11,0 | |||
| 1998 | 38 666 000 | 395 619 | 375 354 | 20 265 | 10.2 | 9.7 | 0.5 | 1,44 | 68,87 | 77,34 | 11,6 | |||
| 1999 | 38 654 000 | 382 002 | 381 415 | 587 | 9.9 | 9.9 | 0.0 | 1,37 | 68,83 | 77,49 | 11,7 | |||
| 2000 | 38 649 000 | 378 348 | 368 028 | 10 320 | 9.8 | 9.5 | 0.3 | 1,35 | 69,74 | 78 | 12,1 | |||
| 2001 | 38 248 000 | 368 205 | 363 220 | 4 985 | 9.6 | 9.5 | 0.1 | 1,32 | 70,21 | 78,38 | 13,1 | |||
| 2002 | 38 231 000 | 353 765 | 359 486 | -5 721 | 9.3 | 9.4 | -0.1 | 1,25 | 70,42 | 78,78 | 14,4 | |||
| 2003 | 38 205 000 | 351 072 | 365 230 | -14 158 | 9.2 | 9.6 | -0.4 | 1,22 | 70,52 | 78,9 | 15,8 | |||
| 2004 | 38 183 000 | 356 131 | 363 522 | -7 391 | 9.3 | 9.5 | -0.2 | 1,23 | 70,67 | 79,23 | 17,1 | |||
| 2005 | 38 166 000 | 364 383 | 368 285 | -3 902 | 9.5 | 9.6 | -0.1 | 1,24 | 70,81 | 79,4 | 18,5 | |||
| 2006 | 38 141 000 | 374 244 | 369 686 | 4 558 | 9.8 | 9.7 | 0.1 | 1,27 | 70,93 | 79,62 | 18,9 | |||
| 2007 | 38 121 000 | 387 873 | 377 226 | 10 647 | 10.2 | 9.9 | 0.3 | 1,31 | 70,96 | 79,74 | 19,5 | |||
| 2008 | 38 126 000 | 414 499 | 379 399 | 35 100 | 10.9 | 10.0 | 0.9 | 1,39 | 71,26 | 79,96 | 19,9 | |||
| 2009 | 38 152 000 | 417 589 | 384 940 | 32 649 | 10.9 | 10.1 | 0.9 | 1,40 | 71,53 | 80,05 | 20,2 | |||
| 2010 | 38 530 000 | 413 300 | 378 500 | 34 800 | 10,7 | 9,8 | 0,9 | 1,41 | 72,1 | 80,59 | 20,6 | |||
| 2011 | 38 538 000 | 388 400 | 375 500 | 12 900 | 10,1 | 9,7 | 0,3 | 1,33 | 72,44 | 80,9 | 21,2 | |||
| 2012 | 38 533 000 | 387 858 | 384 788 | 3 070 | 10,1 | 10,0 | 0,1 | 1,33 | 72,71 | 80,98 | 22,3 | |||
| 2013 | 38 496 000 | 369 600 | 387 300 | -17 700 | 9,6 | 10,1 | -0,5 | 1,29 | 73,1 | 81,1 | 23,4 | |||
| 2014 | 38 479 000 | 375 160 | 376 467 | -1 307 | 9,7 | 9,8 | -0,1 | 1,32 | 73,75 | 81,61 | 24,2 | |||
| 2015 | 38 437 000 | 369 308 | 394 921 | -25 613 | 9,6 | 10,3 | -0,7 | 1,32 | 73,58 | 81,57 | 24,6 | 12 330 | 28 080 | -15 750 |
| 2016 | 38 433 000 | 382 257 | 388 009 | -5 752 | 9,9 | 10,1 | -0,2 | 1,39 | 73,94 | 81,94 | 25,0 | 13 500 | 12 000 | 1 500 |
| 2017 | 38 434 000 | 401 982 | 402 852 | -870 | 10,5 | 10,5 | -0,0 | 1,46 | 13 324 | 11 888 | 1 436 |
Current vital statistics
Number of births from January-July 2017 =![]()
Number of births from January-July 2018 =![]()
Number of deaths from January-July 2017 =![]()
Number of deaths from January-July 2018 =![]()
Natural increase from January-July 2017 =![]()
Natural increase from January-July 2018 =![]()
Life expectancy
| Period | Life expectancy in Years |
Period | Life expectancy in Years |
|---|---|---|---|
| 1950–1955 | 61.4 | 1985–1990 | 70.7 |
| 1955–1960 | 65.9 | 1990–1995 | 71.2 |
| 1960–1965 | 68.3 | 1995–2000 | 72.7 |
| 1965–1970 | 69.8 | 2000–2005 | 74.6 |
| 1970–1975 | 70.3 | 2005–2010 | 75.6 |
| 1975–1980 | 70.4 | 2010–2015 | 77.0 |
| 1980–1985 | 70.7 |
Source: UN World Population Prospects[21]
Structure of the population
| Age group | Male | Female | Total | % |
|---|---|---|---|---|
| Total | 18 651 441 | 19 882 348 | 38 533 789 | 100 |
| 0-4 | 1 058 874 | 1 005 069 | 2 063 943 | 5,36 |
| 5-9 | 945 643 | 897 723 | 1 843 366 | 4,78 |
| 10-14 | 974 509 | 925 506 | 1 900 015 | 4,93 |
| 15-19 | 1 158 367 | 1 108 267 | 2 266 634 | 5,88 |
| 20-24 | 1 394 761 | 1 341 393 | 2 736 154 | 7,10 |
| 25-29 | 1 623 072 | 1 575 546 | 3 198 618 | 8,30 |
| 30-34 | 1 602 736 | 1 558 622 | 3 161 358 | 8,20 |
| 35-39 | 1 470 751 | 1 432 822 | 2 903 573 | 7,54 |
| 40-44 | 1 231 083 | 1 209 751 | 2 440 834 | 6,33 |
| 45-49 | 1 196 548 | 1 192 952 | 2 389 500 | 6,20 |
| 50-54 | 1 369 258 | 1 414 996 | 2 784 254 | 7,23 |
| 55-59 | 1 404 141 | 1 522 140 | 2 926 281 | 7,59 |
| 60-64 | 1 163 935 | 1 350 684 | 2 514 619 | 6,53 |
| 65-69 | 675 573 | 861 584 | 1 537 157 | 3,99 |
| 70-74 | 529 739 | 776 722 | 1 306 461 | 3,39 |
| 75-79 | 424 407 | 720 249 | 1 144 656 | 2,97 |
| 80-84 | 278 428 | 566 126 | 844 554 | 2,19 |
| 85-89 | 115 213 | 311 388 | 426 601 | 1,11 |
| 90-94 | 28 565 | 91 223 | 119 788 | 0,31 |
| 95-99 | 4 614 | 18 265 | 22 879 | 0,06 |
| 100+ | 224 | 1 320 | 1 544 | <0,01 |
| Age group | Male | Female | Total | Percent |
|---|---|---|---|---|
| 0-14 | 2 979 026 | 2 828 298 | 5 807 324 | 15,07 |
| 15-64 | 13 615 652 | 13 707 173 | 27 322 825 | 70,91 |
| 65+ | 2 056 763 | 3 346 877 | 5 403 640 | 14,02 |
| Age Group | Male | Female | Total | % |
|---|---|---|---|---|
| Total | 18 607 417 | 19 847 159 | 38 454 576 | 100 |
| 0-4 | 982 639 | 928 662 | 1 911 301 | 4.97 |
| 5-9 | 1 047 830 | 996 205 | 2 044 035 | 5.32 |
| 10-14 | 924 671 | 877 780 | 1 802 451 | 4.69 |
| 15-19 | 1 028 884 | 979 585 | 2 008 469 | 5.22 |
| 20-24 | 1 257 703 | 1 209 498 | 2 467 201 | 6.42 |
| 25-29 | 1 464 438 | 1 417 040 | 2 881 478 | 7.49 |
| 30-34 | 1 647 147 | 1 602 930 | 3 250 077 | 8.45 |
| 35-39 | 1 561 396 | 1 522 202 | 3 083 598 | 8.02 |
| 40-44 | 1 354 899 | 1 329 476 | 2 684 375 | 6.98 |
| 45-49 | 1 166 358 | 1 160 878 | 2 327 236 | 6.05 |
| 50-54 | 1 211 294 | 1 238 398 | 2 449 692 | 6.37 |
| 55-59 | 1 386 303 | 1 489 816 | 2 876 119 | 7.48 |
| 60-64 | 1 256 035 | 1 443 985 | 2 700 020 | 7.0 |
| 65-69 | 917 893 | 1 147 725 | 2 065 618 | 5.37 |
| 70-74 | 501 311 | 716 224 | 1 217 535 | 3.17 |
| 75-79 | 426 059 | 715 629 | 1 141 688 | 2.97 |
| 80-84 | 287 908 | 573 415 | 861 323 | 2.24 |
| 85+ | 184 649 | 497 711 | 682 360 | 1.77 |
| Age group | Male | Female | Total | Percent |
|---|---|---|---|---|
| 0-14 | 2 955 140 | 2 802 647 | 5 757 787 | 14.97 |
| 15-64 | 13 334 457 | 13 393 808 | 26 728 265 | 69.51 |
| 65+ | 2 317 820 | 3 650 704 | 5 968 524 | 15.52 |
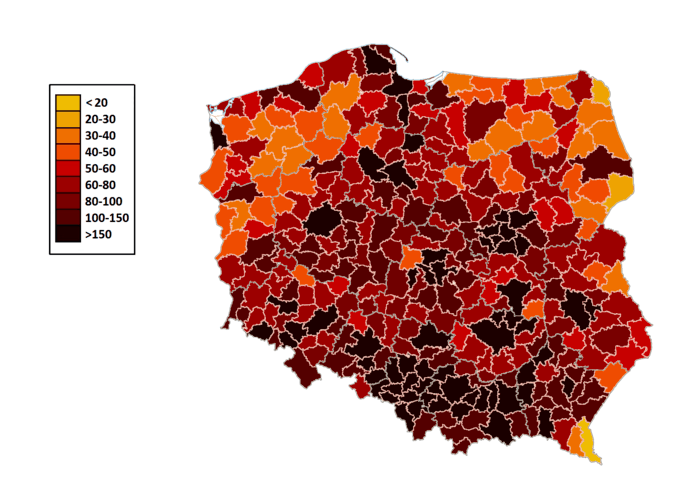
Density
Demographic statistics
Demographic statistics according to the World Population Review.[24]
- One birth every 2 minutes
- One death every 1 minutes
- Net loss of one person every 8 minutes
- One net migrant every 53 minutes
Demographic statistics according to the CIA World Factbook, unless otherwise indicated.[25]
- Population
- 38,476,269 (July 2017 est.)
- Age structure
- 0-14 years: 14.76% (male 2,919,353/female 2,757,923)
- 15-24 years: 10.7% (male 2,113,358/female 2,003,033)
- 25-54 years: 43.48% (male 8,447,418/female 8,283,757)
- 55-64 years: 14.21% (male 2,586,097/female 2,880,031)
- 65 years and over: 16.86% (male 2,560,847/female 3,924,452) (2017 est.)
- 0-14 years: 14.7% (male 2,910,324/female 2,748,546)
- 15-64 years: 71.6% (male 13,698,363/female 13,834,779)
- 65 years and over: 13.7% (male 2,004,550/female 3,245,026) (2011 est.)
- 0–14 years: 14.8% (male 2,931,732/female 2,769,021)
- 15–64 years: 71.7% (male 13,725,939/female 13,863,103)
- 65 years and over: 13.5% (male 1,971,763/female 3,202,131) (2010 est.)
- Total fertility rate
- 1.35 children born/woman (2017 est.) Country comparison to the world: 215th
- Median age
- total: 40.7 years. Country comparison to the world: 47th
- male: 39 years
- female: 42.4 years (2017 est.)
- total: 38.5 years
- male: 36.8 years
- female: 40.3 years (2011 est.)
- Population growth rate
- -0.13% (2017 est.) Country comparison to the world: 206th
- Birth rate
- 9.5 births/1,000 population (2017 est.) Country comparison to the world: 202th
- Death rate
- 10.4 deaths/1,000 population (2017 est.)
- Net migration rate
- -0.4 migrant(s)/1,000 population (2017 est.) Country comparison to the world: 118th
- Mother's mean age at first birth
- 27.4 years (2014 est.)
- Infant mortality rate
- total: 4.4 deaths/1,000 live births. Country comparison to the world: 182th
- male: 4.8 deaths/1,000 live births
- female: 4 deaths/1,000 live births (2017 est.)
- total: 6.42 deaths/1,000 live births
- male: 7.12 deaths/1,000 live births
- female: 5.67 deaths/1,000 live births (2012 est.)
- Life expectancy at birth
- total population: 77.8 years. Country comparison to the world: 67th
- male: 73.9 years
- female: 81.8 years (2017 est.)
- total population: 75.85 years
- male: 71.88 years
- female: 80.06 years (2010 est.)
- total population: 76.25 years
- male: 72.31 years
- female: 80.43 years (2012 est.)
- School life expectancy (primary to tertiary education)
- total: 16 years
- male: 16 years
- female: 17 years (2013)
- Unemployment, youth ages 15-24
- total: 20.8%. Country comparison to the world: 62th
- male: 20.7%
- female: 20.9% (2015 est.)
- Sex ratio
- at birth: 1.06 male(s)/female
- under 15 years: 1.06 male(s)/female
- 15-64 years: 0.99 male(s)/female
- 65 years and over: 0.62 male(s)/female
- total population: 0.94 male(s)/female (2012 est.)
- Population distribution
Population concentrated in the southern area around Krakow and the central area around Warsaw and Lodz, with an extension to the northern coastal city of Gdansk
- Ethnic groups
Polish 96.9%, Silesian 1.1%, German 0.2%, Ukrainian 0.1%, other and unspecified 1.7% note: represents ethnicity declared first (2011 est.)
- Languages
Polish (official) 98.2%, Silesian 1.4%, other 1.1%, unspecified 1.3% note: data represents the language spoken at home; shares sum to more than 100% because some respondents gave more than one answer on the census; Poland ratified the European Charter for Regional or Minority Languages in 2009 recognizing Kashub as a regional language, Czech, Hebrew, Yiddish, Belarusian, Lithuanian, German, Armenian, Russian, Slovak, and Ukrainian as national minority languages, and Karaim, Lemko, Romani (Polska Roma and Bergitka Roma), and Tatar as ethnic minority languages (2011 est.)
- Religions
Catholic 87.2% (includes Roman Catholic 86.9% and Greek Catholic, Armenian Catholic, and Byzantine-Slavic Catholic .3%), Orthodox 1.3% (almost all are Polish Autocephalous Orthodox), Protestant 0.4% (mainly Augsburg Evangelical and Pentacostal), other 0.4% (includes Jehovah's Witness, Buddhist, Hare Krishna, Gaudiya Vaishnavism, Muslim, Jewish, Mormon), unspecified 10.8% (2012 est.)
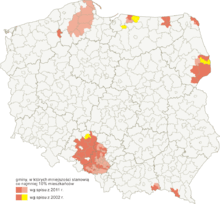
Nationalities
97.10% of the people of Poland claim sole or partial Polish nationality, and 98.19% declare that they speak Polish at home (2011). Among minority groups, the largest numbers of respondents claimed Silesian nationality , followed by Kashubian , German , Ukrainian , Vietnamese , Belarusian and Russians [26] The statistics on Ukrainians do not include recently arrived migrant workers, which a report by the National Bank of Poland estimated at around 1 million in 2015.[27]
Largest metropolitan and urban areas
- Population numbers by database
| Area | ESPON [28] | Eurostat LUZ [29] | Ministry of Regional Development[30] | United Nations [31] | Demographia.com[32] | Citypopulation.de[33] | Scientific study by T. Markowski[34] | Scientific study by Swianiewicz, Klimska [35] |
|---|---|---|---|---|---|---|---|---|
| Katowice (Katowice urban area) | 3,029,000[36](5,294,000) | 2,710,397 | 3,239,200 | 3,069,000 | 2,500,000 | 2,775,000 | 2,746,000 | 2,733,000 |
| Warsaw | 2,785,000 | 2,660,406 | 2,680,600 | 2,194,000 | 2,030,000 | 2,375,000 | 2,631,900 | 2,504,000 |
| Kraków | 1,236,000 | 1,264,322 | 1,227,200 | 818,000 | 750,000 | Not listed | 1,257,500 | 1,367,000 |
| Łódź | 1,165,000 | 1,163,516 | 1,061,600 | 974,000 | 950,000 | 1,060,000 | 1,178,000 | 1,129,000 |
| Gdańsk | 993,000 | 1,105,203 | 1,220,800 | 854,000 | 775,000 | No data | 1,098,400 | 1,210,000 |
| Poznań | 919,000 | 1,018,511 | 1,227,200 | No data | 600,000 | No data | 1,011,200 | 846,000 |
| Wrocław | 861,000 | 1,031,439 | 1,136,900 | No data | 700,000 | No data | 1,029,800 | 956,000 |
| Szczecin | 721,000 | 878,314 | 724,700 | No data | 500,000 | No data | No data | 755,806 |
Demographics by town
| City | Voivodeship | Inhabitants May 20, 2002 |
Inhabitants December 31, 2006 |
Inhabitants December 31, 2010 | |
|---|---|---|---|---|---|
| 1 | Warsaw | Masovian | 1,671,670 | 1,702,139 | 1,720,398 |
| 2 | Kraków | Lesser Poland | 758,544 | 756,267 | 756,183 |
| 3 | Łódź | Łódź | 789,318 | 760,251 | 737,098 |
| 4 | Wrocław | Lower Silesia | 640,367 | 634,630 | 632,996 |
| 5 | Poznań | Greater Poland | 578,886 | 564,951 | 551,627 |
| 6 | Gdańsk | Pomeranian | 461,334 | 456,658 | 456,967 |
| 7 | Szczecin | Western Pomeranian | 415,399 | 409,068 | 405,606 |
| 8 | Bydgoszcz | Kuyavia-Pomeranian | 373,804 | 363,468 | 356,177 |
| 9 | Lublin | Lublin | 357,110 | 353,483 | 348,450 |
| 10 | Katowice | Silesia | 327,222 | 314,500 | 306,826 |
| 11 | Białystok (Demographics) | Podlaskie | 291,383 | 294,830 | 295,198 |
| 12 | Gdynia | Pomerania | 253,458 | 251,844 | 247,324 |
| 13 | Częstochowa | Silesian | 251,436 | 245,030 | 238,042 |
| 14 | Radom | Masovian | 229,699 | 225,810 | 222,496 |
| 15 | Sosnowiec | Silesia | 232,622 | 225,030 | 217,638 |
| 16 | Toruń | Kuyavia-Pomerania | 211,243 | 207,190 | 205,312 |
| 17 | Kielce | Świętokrzyskie | 212,429 | 207,188 | 203,804 |
| 18 | Gliwice | Silesia | 203,814 | 198,499 | 195,472 |
| 19 | Zabrze | Silesia | 195,293 | 190,110 | 186,913 |
| 20 | Bytom | Silesia | 193,546 | 186,540 | 181,617 |
| 21 | Rzeszów | Subcarpathia | 160,376 | 165,578 | 178,227 |
| 22 | Olsztyn | Warmia-Masuria | 173,102 | 174,941 | 176,463 |
| 23 | Bielsko-Biała | Silesia | 178,028 | 176,453 | 175,008 |
| 24 | Ruda Śląska | Silesia | 150,595 | 145,471 | 142,950 |
| 25 | Rybnik | Silesia | 142,731 | 141,388 | 141,410 |
| 26 | Tychy | Silesia | 132,816 | 130,492 | 129,386 |
| 27 | Dąbrowa Górnicza | Silesia | 132,236 | 129,559 | 127,431 |
| 28 | Płock | Masovia | 128,361 | 127,224 | 126,061 |
| 29 | Elbląg | Warmia-Masuria | 128,134 | 126,985 | 126,049 |
| 30 | Opole | Opole | 129,946 | 127,602 | 125,710 |
| 31 | Gorzów Wielkopolski | Lubusz | 125,914 | 125,504 | 125,394 |
| 32 | Wałbrzych | Lower Silesia | 130,268 | 124,988 | 120,197 |
| 33 | Zielona Góra | Lubusz | 118,293 | 138,512 | 117,699 |
| 34 | Włocławek | Kuyavia-Pomerania | 121,229 | 119,256 | 116,914 |
| 35 | Tarnów | Lesser Poland | 119,913 | 116,967 | 114,635 |
| 36 | Chorzów | Silesia | 117,430 | 113,978 | 112,697 |
| 37 | Koszalin | Western Pomerania | 108,709 | 107,693 | 107,948 |
| 38 | Kalisz | Greater Poland | 109,498 | 108,477 | 106,664 |
| 39 | Legnica | Lower Silesia | 107,100 | 105,186 | 103,892 |
| 40 | Grudziądz | Kuyavia-Pomerania | 99,943 | 99,244 | 98,757 |
| 41 | Słupsk | Pomerania | 100,376 | 98,092 | 96,665 |
Demographics by voivodeship
| Inhabitants of voivodeships (2008, according to GUS) | |||
|---|---|---|---|
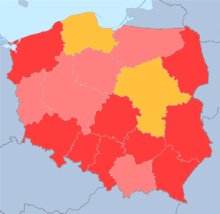
| Lower Silesian | 19 947 | 2 887 059 | -0,04 |
| Kuyavian-Pomeranian | 17 972 | 2 067 918 | +0,07 |
| Lublin | 25 122 | 2 161 832 | -0,15 |
| Lubusz | 13 998 | 1 008 926 | 0,00 |
| Łódź | 18 219 | 2 548 861 | -0,20 |
| Lesser Poland | 15 183 | 3 287 136 | +0.22 |
| Masovian | 35 558 | 5 204 495 | +0,26 |
| Opole | 9412 | 1 033 040 | -0,31 |
| Subcarpathian | 17 846 | 2 099 495 | +0,03 |
| Podlaskie (Demographics) | 20 187 | 1 191 470 | -0,07 |
| Pomeranian | 18 310 | 2 219 512 | +0,32 |
| Silesian | 12 334 | 4 645 665 | -0.12 |
| Świętokrzyskie | 11 710 | 1 272 784 | -0,20 |
| Warmian-Masurian | 24 173 | 1 427 073 | +0,03 |
| Greater Poland | 29 827 | 3 397 617 | +0.26 |
| West Pomeranian | 22 892 | 1 692 957 | +0,04 |
| Poland | 312 679 | 38 135 876 | +0,05 |
Ethnic groups
| Population background | % | Population[37] |
|---|---|---|
| European | 98.6 | 37,962,000 |
| European Union | 98.2 | 37,813,000 |
| Ethnic Polish (including Silesians and Kashubians) | 97.7 | 37,602,000 |
| Other EU member states (primarily German) | 0.5 | 211,000 |
| European Other (primarily Ukrainian and Belarusian) | 0.4 | 149,000 |
| Other background (primarily Vietnamese and Chechen) | <0.1 | 29,000 |
| Mixed or unspecified background | 1.4 | 521,000 |
| Total population | 100 | 38,512,000 |
Religions
- Roman Catholic 91%, Orthodox 1%, Other 2%, atheist/non-believer/agnostic 5%, not stated 1% (Eurobarometer 2012)[38]
Languages
- Polish 97.8%, other and unspecified 2.2% (2002 census)
See also
Notes
- ↑ In fertility rates, 2.1 and above is a stable population and have been marked blue, 2 and below leads an aging population and the result is that the population reduces.
References
- ↑ "Ludność w gminach według stanu w dniu 31.12.2011 r. - bilans opracowany w oparciu o wyniki NSP 2011". Stat.gov.pl. Retrieved 31 August 2017.
- ↑ "Poland: Aging and the Economy". Worldbank.org. Retrieved 31 August 2017.
- ↑ "Poland Total fertility rate". Indexmundi.com. Retrieved 20 June 2015.
- ↑ "Russia experiences baby boom". Euromonitor.typepad.com. Retrieved 31 August 2017.
- ↑ Archived 2016-02-03 at the Wayback Machine.
- ↑ ""Sueddeutsche Zeitung": Polska przeżywa największą falę emigracji od 100 lat". Wiadomosci.onet.pl. 26 September 2014. Retrieved 31 August 2017.
- 1 2 3 4 5 6 7 8 9 10 11 12 13 14 15 16 Max Roser (2014), "Total Fertility Rate around the world over the last centuries", Our World In Data, Gapminder Foundation
- ↑ B.R. Mitchell. European historical statistics, 1750-1975.
- ↑ "United Nations : Demographic Yearbook 1948" (PDF). Unstats.un.org. Retrieved 30 August 2017.
- ↑ "Archived copy". Archived from the original on 2008-09-17. Retrieved 2008-08-29.
- ↑ "Démographie des pays développés". Ined.fr. Retrieved 20 June 2015.
- ↑ "Archived copy". Archived from the original on 2014-06-16. Retrieved 2014-06-09.
- ↑ "Archived copy". Archived from the original on 2011-12-27. Retrieved 2012-01-03.
- ↑ "Archived copy". Archived from the original on 2014-05-25. Retrieved 2014-05-24.
- ↑ "Informacja o sytuacji społeczno-gospodarczej kraju w 2016 r." Stat.gov.pl. Retrieved 31 August 2017.
- ↑ http://stat.gov.pl/obszary-tematyczne/inne-opracowania/informacje-o-sytuacji-spoleczno-gospodarczej/informacja-o-sytuacji-spoleczno-gospodarczej-kraju-w-2017-r-,1,68.html
- ↑ http://stat.gov.pl/en/topics/other-studies/informations-on-socio-economic-situation/statistical-bulletin-no-22018,4,85.html
- ↑ http://ec.europa.eu/eurostat/tgm/table.do?tab=table&init=1&language=en&pcode=tps00199&plugin=1
- ↑ "Statistical Bulletin No. 3/20187 - Population". Central Statistical Office of Poland. Retrieved 24 July 2018.
- ↑ http://stat.gov.pl/en/topics/other-studies/informations-on-socio-economic-situation/statistical-bulletin-no-22018,4,85.html
- ↑ "World Population Prospects – Population Division – United Nations". Retrieved 2017-07-15.
- ↑ "United Nations Statistics Division - Demographic and Social Statistics". Unstats.un.org. Retrieved 31 August 2017.
- ↑ "Ludność. Stan i struktura ludności oraz ruch naturalny w przekroju terytorialnym. Stan w dniu 30 VI 2015 r." Stat.gov.pl. Retrieved 31 August 2017.
- ↑ "Poland Population 2018", World Population Review
- ↑ "World Factbook EUROPE : GERMANY", The World Factbook, July 12, 2018
- ↑ "Struktura narodowo-etniczna, językowa i wyznaniowa ludności Polski - NSP 2011". Stat.gov.pl (in Polish). Retrieved 2017-01-31.
- ↑ "Obywatele Ukrainy pracujący w Polsce – raport z badania" (PDF). Nbp.pl. Retrieved 31 August 2017.
- ↑ "Project 1.4.3". Web.archive.org. 28 July 2009. Archived from the original on 28 July 2009. Retrieved 31 August 2017.
- ↑ "Archived copy". Archived from the original on 2011-04-06. Retrieved 2010-09-05.
- ↑ ["Archived copy" (PDF). Archived from the original (PDF) on 2010-03-31. Retrieved 2016-01-19.
- ↑ "World Urbanization Prospects" (PDF). United Nations - Department of Economic and Social Affairs / Population Division, The 2003 Revision (data of 2000). Retrieved 31 August 2017.
- ↑ "World Urban Areas" (PDF). Demographia.com. Retrieved 31 August 2017.
- ↑ "Major Agglomerations of the World - Population Statistics and Maps". Citypopulation.de. Retrieved 31 August 2017.
- ↑ "Archived copy" (PDF). Archived from the original (PDF) on 2009-03-27. Retrieved 2009-03-28.
- ↑ "Archived copy" (PDF). Archived from the original (PDF) on 2009-01-24. Retrieved 2009-04-04.
- ↑ Data of polycentric Silesian metropolitan area
- ↑ Główny Urząd Statystyczny (January 2013). Ludność. Stan i struktura demograficzno-społeczna [Narodowy Spis Powszechny Ludności i Mieszkań 2011] (pdf) (in Polish). Główny Urząd Statystyczny. Retrieved 12 December 2014.
- ↑ "Wayback Machine" (PDF). Web.archive.org. 2 December 2012. Archived from the original on 2 December 2012. Retrieved 31 August 2017.
External links
- Central Statistical Office for the Republic of Poland
- Commonwealth of Diverse Cultures: Poland's Heritage
- CIA World Factbook 2004
- Helsinki Foundation for Human Rights
- Poland - Population and ethnic composition
- Armenians in Poland
- Poland's president expresses regret over 1947 Akcja Wisla
- INTEREG
Poland articles | |||||||||
|---|---|---|---|---|---|---|---|---|---|
| History |
|  | |||||||
| Geography | |||||||||
| Politics | |||||||||
| Economy | |||||||||
| Culture |
| ||||||||
| |||||||||
| Traditional | |
|---|---|
| Immigrant | |