Brie, Ariège
| Brie | |
|---|---|
| Commune | |
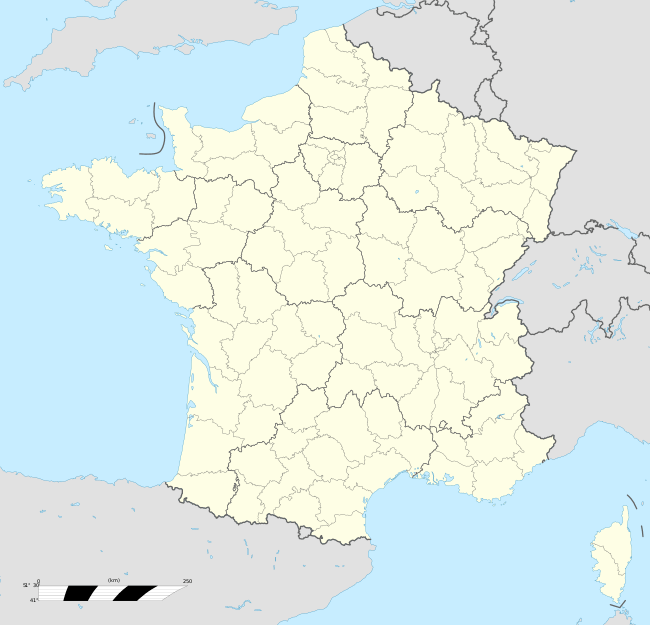 Brie Location within Occitanie region 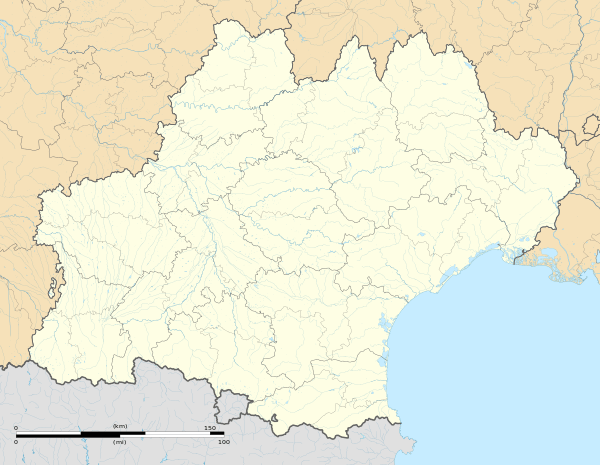 Brie | |
| Coordinates: 43°12′23″N 1°31′09″E / 43.2064°N 1.5192°ECoordinates: 43°12′23″N 1°31′09″E / 43.2064°N 1.5192°E | |
| Country | France |
| Region | Occitanie |
| Department | Ariège |
| Arrondissement | Pamiers |
| Canton | Portes d'Ariège |
| Intercommunality | Saverdun |
| Government | |
| • Mayor (2008–2014) | Isabelle Peyrefitte |
| Area1 | 7.06 km2 (2.73 sq mi) |
| Population (2008)2 | 175 |
| • Density | 25/km2 (64/sq mi) |
| Time zone | UTC+1 (CET) |
| • Summer (DST) | UTC+2 (CEST) |
| INSEE/Postal code | 09067 /09700 |
| Elevation |
255–363 m (837–1,191 ft) (avg. 247 m or 810 ft) |
|
1 French Land Register data, which excludes lakes, ponds, glaciers > 1 km2 (0.386 sq mi or 247 acres) and river estuaries. 2 Population without double counting: residents of multiple communes (e.g., students and military personnel) only counted once. | |
Brie is a commune in the Ariège department of southwestern France.
Commune located on the slopes between the Ariège and the Lèze. It is a commune bordering the department of Haute-Garonne. The mayor is Isabelle Peyrefitte.
Population

The evolution of the number of inhabitants is known through the population censuses carried out in the commune since 1793. From 1 January 2009, the legal populations of the communes are published annually in the framework of a census which is now based on An annual information gathering, covering successively all the communal territories during a period of five years.
For communes with less than 10 000 inhabitants, a census survey covering the whole population is carried out every five years, with the legal populations of the intermediate years being estimated by interpolation or extrapolation1. For the commune, the first comprehensive census under the new system was carried out in 2005,[1][2][3]
In 2014, the commune had 208 inhabitants, an increase of 13.66% compared to 2009 (Ariège: 0.95%, France excluding Mayotte: 2.49%). Inhabitants of Brie are called Briençais.
| Historical population | ||
|---|---|---|
| Year | Pop. | ±% |
| 1962 | 127 | — |
| 1968 | 133 | +4.7% |
| 1975 | 92 | −30.8% |
| 1982 | 80 | −13.0% |
| 1990 | 92 | +15.0% |
| 1999 | 150 | +63.0% |
| 2008 | 175 | +16.7% |
See also
References
- ↑ https://www.insee.fr/fr/information/2383265
- ↑ https://www.insee.fr/fr/statistiques/fichier/2383265/annee-collecte-2016-commune.xls%5Bpermanent+dead+link%5D
- ↑ By convention in Wikipedia, the principle was retained of not showing in the census table and the graph, for the legal populations after 1999, that the populations corresponding to an exhaustive survey of census for the communes of less than 10 000 inhabitants , And that the populations of the years 2006, 2011, 2016, etc. For municipalities with more than 10 000 inhabitants, as well as the last legal population published by INSEE for all municipalities.
| Wikimedia Commons has media related to Brie (Ariège). |