Hampton County, South Carolina
Hampton County is a rural county located in the U.S. state of South Carolina. As of the 2010 census, the population was 21,090.[1] Its county seat is Hampton.[2] It was named for Confederate Civil War general Wade Hampton, who in the late 1870s, with the ending of Reconstruction, was elected as governor of South Carolina.[3] The county includes two small urban clusters: Hampton (2000 pop.: 4,011) and Estill (3,637).
Hampton County | |
|---|---|
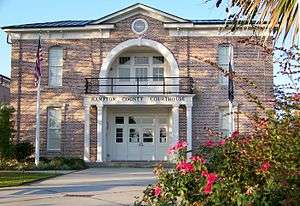 Hampton County Courthouse | |
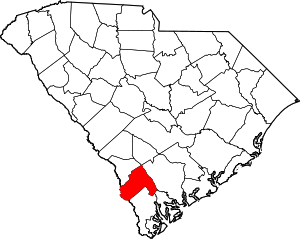 Location within the U.S. state of South Carolina | |
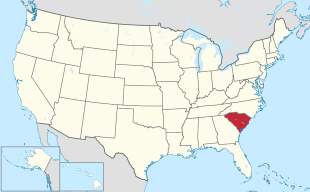 South Carolina's location within the U.S. | |
| Coordinates: 32°47′N 81°08′W | |
| Country | |
| State | |
| Founded | 1878 |
| Seat | Hampton |
| Largest town | Hampton |
| Area | |
| • Total | 563 sq mi (1,460 km2) |
| • Land | 560 sq mi (1,500 km2) |
| • Water | 2.8 sq mi (7 km2) 0.5%% |
| Population (2010) | |
| • Total | 21,090 |
| • Estimate (2018) | 19,351 |
| • Density | 37/sq mi (14/km2) |
| Time zone | UTC−5 (Eastern) |
| • Summer (DST) | UTC−4 (EDT) |
| Congressional district | 6th |
| Website | www |
History
The county is named for Wade Hampton III, one of the country's leading slaveowners and a Lieutenant General for the Confederacy during the American Civil War. After the war, a leading proponent of the rose-tinted Lost Cause of the Confederacy interpretation or the war, he led the Redeemers and Red Shirts on a terrorist campaign to reestablish white apartheid rule in South Carolina. At the end of the Reconstruction era he became Governor and then U.S. Senator from South Carolina.
The county had a peak of population in 1910, when agriculture was still the mainstay of the economy. Thousands of African Americans left after that for urban areas, especially in the North, in the Great Migration. The mechanization of agriculture reduced farm jobs.
Geography
According to the U.S. Census Bureau, the county has a total area of 563 square miles (1,460 km2), of which 560 square miles (1,500 km2) is land and 2.8 square miles (7.3 km2) (0.5%) is water.[4]
Adjacent counties
- Bamberg County - north
- Colleton County - east
- Beaufort County - southeast
- Jasper County - south
- Effingham County, Georgia - southwest
- Screven County, Georgia - west
- Allendale County - northwest
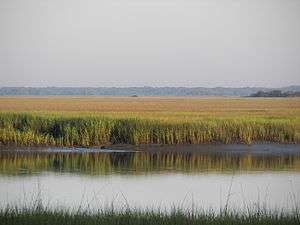
National protected area
State protected area
Demographics
| Historical population | |||
|---|---|---|---|
| Census | Pop. | %± | |
| 1880 | 18,741 | — | |
| 1890 | 20,544 | 9.6% | |
| 1900 | 23,738 | 15.5% | |
| 1910 | 25,126 | 5.8% | |
| 1920 | 19,550 | −22.2% | |
| 1930 | 17,243 | −11.8% | |
| 1940 | 17,465 | 1.3% | |
| 1950 | 18,027 | 3.2% | |
| 1960 | 17,425 | −3.3% | |
| 1970 | 15,878 | −8.9% | |
| 1980 | 18,159 | 14.4% | |
| 1990 | 18,191 | 0.2% | |
| 2000 | 21,386 | 17.6% | |
| 2010 | 21,090 | −1.4% | |
| Est. 2018 | 19,351 | [5] | −8.2% |
| U.S. Decennial Census[6] 1790-1960[7] 1900-1990[8] 1990-2000[9] 2010-2013[1] | |||
2000 census
As of the census[10] of 2000, there were 21,386 people, 7,444 households, and 5,315 families living in the county. The population density was 38 people per square mile (15/km²). There were 8,582 housing units at an average density of 15 per square mile (6/km²). The racial makeup of the county was 55.67% Black or African American, 42.89% White, 0.20% Native American, 0.17% Asian, 0.01% Pacific Islander, 0.62% from other races, and 0.43% from two or more races. 2.56% of the population were Hispanic or Latino of any race.
There were 7,444 households out of which 34.60% had children under the age of 18 living with them, 47.90% were married couples living together, 18.80% had a female householder with no husband present, and 28.60% were non-families. 25.80% of all households were made up of individuals and 11.20% had someone living alone who was 65 years of age or older. The average household size was 2.64 and the average family size was 3.19.
In the county, the population was spread out with 27.60% under the age of 18, 8.50% from 18 to 24, 29.70% from 25 to 44, 22.10% from 45 to 64, and 12.10% who were 65 years of age or older. The median age was 35 years. For every 100 females there were 103.80 males. For every 100 females age 18 and over, there were 103.90 males.
The median income for a household in the county was $28,771, and the median income for a family was $34,559. Males had a median income of $29,440 versus $20,418 for females. The per capita income for the county was $13,129. About 17.80% of families and 21.80% of the population were below the poverty line, including 27.60% of those under age 18 and 21.70% of those age 65 or over.
2010 census
As of the 2010 United States Census, there were 21,090 people, 7,598 households, and 5,211 families living in the county.[11] The population density was 37.7 inhabitants per square mile (14.6/km2). There were 9,140 housing units at an average density of 16.3 per square mile (6.3/km2).[12] The racial makeup of the county was 53.9% black or African American, 42.7% white, 0.5% Asian, 0.3% American Indian, 1.3% from other races, and 1.3% from two or more races. Those of Hispanic or Latino origin made up 3.5% of the population.[11] In terms of ancestry, 6.4% were Irish, 6.3% were American, 5.6% were German, and 5.3% were English.[13]
Of the 7,598 households, 35.8% had children under the age of 18 living with them, 44.0% were married couples living together, 19.1% had a female householder with no husband present, 31.4% were non-families, and 28.1% of all households were made up of individuals. The average household size was 2.57 and the average family size was 3.15. The median age was 38.4 years.[11]
The median income for a household in the county was $34,846 and the median income for a family was $43,234. Males had a median income of $31,935 versus $26,826 for females. The per capita income for the county was $16,262. About 17.2% of families and 20.8% of the population were below the poverty line, including 27.9% of those under age 18 and 19.7% of those age 65 or over.[14]
Communities
Towns
Unincorporated communities
Politics
| Year | Republican | Democratic | Third parties |
|---|---|---|---|
| 2016 | 39.6% 3,488 | 58.7% 5,170 | 1.7% 148 |
| 2012 | 36.0% 3,312 | 63.4% 5,834 | 0.7% 60 |
| 2008 | 36.8% 3,439 | 62.2% 5,816 | 1.0% 95 |
| 2004 | 38.6% 3,097 | 60.3% 4,832 | 1.1% 87 |
| 2000 | 36.1% 2,798 | 63.1% 4,896 | 0.8% 65 |
| 1996 | 28.9% 2,111 | 66.0% 4,828 | 5.2% 378 |
| 1992 | 32.6% 2,402 | 58.9% 4,332 | 8.5% 627 |
| 1988 | 44.8% 2,826 | 54.5% 3,435 | 0.7% 45 |
| 1984 | 47.9% 3,464 | 51.7% 3,736 | 0.4% 28 |
| 1980 | 33.6% 2,217 | 65.6% 4,329 | 0.9% 57 |
| 1976 | 31.0% 1,773 | 68.6% 3,923 | 0.5% 26 |
| 1972 | 57.6% 2,891 | 41.5% 2,086 | 0.9% 46 |
| 1968 | 32.0% 1,671 | 40.3% 2,107 | 27.8% 1,452 |
| 1964 | 61.1% 2,259 | 38.9% 1,439 | |
| 1960 | 62.6% 1,322 | 37.4% 790 | |
| 1956 | 17.5% 359 | 27.4% 564 | 55.1% 1,133 |
| 1952 | 67.5% 1,633 | 32.5% 787 | |
| 1948 | 0.6% 10 | 5.0% 81 | 94.4% 1,531 |
| 1944 | 0.4% 3 | 67.7% 575 | 32.0% 272 |
| 1940 | 2.0% 24 | 98.0% 1,198 | |
| 1936 | 0.6% 8 | 99.4% 1,253 | |
| 1932 | 1.0% 18 | 99.0% 1,782 | |
| 1928 | 1.7% 19 | 98.3% 1,098 | |
| 1924 | 0.4% 3 | 99.1% 730 | 0.5% 4 |
| 1920 | 0.0% 0 | 100.0% 623 | |
| 1916 | 0.0% 0 | 100.0% 852 | |
| 1912 | 0.0% 0 | 100.0% 631 | |
| 1904 | 0.0% 0 | 100.0% 1,079 | |
| 1900 | 0.1% 1 | 99.9% 936 |
References
- "State & County QuickFacts". United States Census Bureau. Archived from the original on June 6, 2011. Retrieved November 22, 2013.
- "Find a County". National Association of Counties. Retrieved 2011-06-07.
- Gannett, Henry (1905). The Origin of Certain Place Names in the United States. Govt. Print. Off. pp. 148.
- "2010 Census Gazetteer Files". United States Census Bureau. August 22, 2012. Retrieved March 17, 2015.
- "Population and Housing Unit Estimates". Retrieved July 30, 2019.
- "U.S. Decennial Census". United States Census Bureau. Retrieved March 17, 2015.
- "Historical Census Browser". University of Virginia Library. Retrieved March 17, 2015.
- Forstall, Richard L., ed. (March 27, 1995). "Population of Counties by Decennial Census: 1900 to 1990". United States Census Bureau. Retrieved March 17, 2015.
- "Census 2000 PHC-T-4. Ranking Tables for Counties: 1990 and 2000" (PDF). United States Census Bureau. April 2, 2001. Retrieved March 17, 2015.
- "U.S. Census website". United States Census Bureau. Retrieved 2011-05-14.
- "DP-1 Profile of General Population and Housing Characteristics: 2010 Demographic Profile Data". United States Census Bureau. Archived from the original on 2020-02-13. Retrieved 2016-03-09.
- "Population, Housing Units, Area, and Density: 2010 - County". United States Census Bureau. Archived from the original on 2020-02-13. Retrieved 2016-03-09.
- "DP02 SELECTED SOCIAL CHARACTERISTICS IN THE UNITED STATES – 2006-2010 American Community Survey 5-Year Estimates". United States Census Bureau. Archived from the original on 2020-02-13. Retrieved 2016-03-09.
- "DP03 SELECTED ECONOMIC CHARACTERISTICS – 2006-2010 American Community Survey 5-Year Estimates". United States Census Bureau. Archived from the original on 2020-02-13. Retrieved 2016-03-09.
- Leip, David. "Dave Leip's Atlas of U.S. Presidential Elections". uselectionatlas.org. Retrieved 2018-03-13.
External links

- Hampton County History and Images
Places adjacent to Hampton County, South Carolina | ||||||||||
|---|---|---|---|---|---|---|---|---|---|---|
| ||||||||||
Municipalities and communities of Hampton County, South Carolina, United States | ||
|---|---|---|
| Towns | Map of South Carolina highlighting Hampton County | |
| Unincorporated communities | ||
| Footnotes | ‡This populated place also has portions in an adjacent county or counties | |
The Lowcountry of South Carolina | ||
|---|---|---|
| Counties |
|  |
| Major communities | ||
| Sea islands | ||
| History & culture | ||
| Military installations |
| |
| Natural areas | ||
| Other articles |
| |
| Authority control |
|
|---|