Jefferson County, Idaho
| Jefferson County, Idaho | ||
|---|---|---|
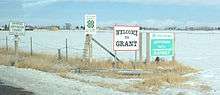 Entering Jefferson County in Grant, Idaho. | ||
| ||
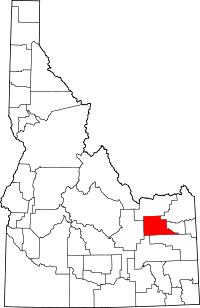 Location in the U.S. state of Idaho | ||
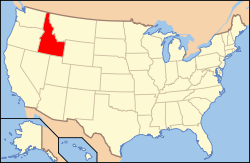 Idaho's location in the U.S. | ||
| Founded | February 18, 1913 | |
| Named for | Thomas Jefferson | |
| Seat | Rigby | |
| Largest city | Rigby | |
| Area | ||
| • Total | 1,106 sq mi (2,865 km2) | |
| • Land | 1,094 sq mi (2,833 km2) | |
| • Water | 12 sq mi (31 km2), 1.1% | |
| Population (est.) | ||
| • (2017) | 28,446 | |
| • Density | 26/sq mi (10/km2) | |
| Congressional district | 2nd | |
| Time zone | Mountain: UTC−7/−6 | |
| Website |
www | |

Jefferson County is a county located in the U.S. state of Idaho. As of the 2010 census, the population was 26,140.[1] The county seat and largest city is Rigby.[2] The county was established in 1913 and named after Thomas Jefferson, the third U.S. President.[3]
Jefferson County is part of the Idaho Falls, ID Metropolitan Statistical Area.
Geography
According to the U.S. Census Bureau, the county has a total area of 1,106 square miles (2,860 km2), of which 1,094 square miles (2,830 km2) is land and 12 square miles (31 km2) (1.1%) is water.[4]
History
The Salt Lake City to Virginia City Stagecoach was established through the area in 1864. Stops were established at Market Lake (Roberts), Sand Hole (Hamer), and Camas. Small settlements grew up around the stagecoach stops with the most significant development occurring at Market Lake. The county's first post office was established at Market Lake on July 29, 1868 when the post office at Eagle Rock was relocated there.[5] Initial settlement at Mud Lake also originated in 1868.[6]
The Utah and Northern Railway reached Camas on July 3, 1879, bringing with it a new wave of settlement, particularly at Camas and Market Lake.[7] Mormon settlement of the county began when John R Poole settled the Menan area in April, 1879 with the settlement initially named Poole's Island. Settlement followed at Lewisville in 1882, Rigby in 1883 and Ririe in 1888. The Camas and Market Lake precincts are the first to emerge in census data under Bingham County in 1890. At that point, 379 residents were enumerated in the Camas precinct and Market Lake counted 218.[8] By the 1900 census, precincts were added for Lewisville, Menan, Rigby, and Rudy (located between Ririe and Rigby). Together with Camas and Market Lake precincts, they contained a population of 3,046.[9] By 1910 there were 10 precincts that would become part of Jefferson County three years later with additional precincts added for Grant, Hamer, Labelle, and Lorenzo. The 1910 census population for those precincts was 5,535.[10]
A common characteristic of Jefferson County's early settlements was their reliance upon a series of canals to deliver water from the Snake River. The first of these systems commenced at Menan in 1880 with construction of the Long Island Canal. The Butte-Market Lake Canal originated in 1884 with construction starting on the big Feeder Canal in 1895. The Owlsey Canal in western Jefferson County had its origins April 13, 1909.[11]
At the time of the first settlement in 1864, the territory east of the Snake River was part of Oneida County with the remainder being part of Alturas County. Mud Lake became the defining point for Oneida County's boundary with Alturas County in 1877 with a portion of the western boundary changed to a line drawn north from a point on the Snake River due south of the "sink of Camas Creek".[12] The change transferred settlements at Camas and Market Lake to Oneida County. Bingham County was created in 1885 from Oneida County with no change in the boundary of Alturas until 1889 when the rest of the Mud Lake area was transferred to Bingham County. All of present Jefferson County became part of Fremont at its creation in 1893. After its creation in 1913, Jefferson County quickly took its present shape in 1917 at the formation of Butte County.[13]
Census data indicates Lewisville became the county's first incorporated village in 1904. It was followed by Rigby in 1906, Menan in 1907 and Roberts in 1910. Ririe was incorporated by 1920 with Hamer and Mud Lake incorporated after 1950.
Adjacent counties
- Clark County - north
- Fremont County - northeast
- Madison County - east
- Bonneville County - south
- Bingham County - southwest
- Butte County - west
Major highways
National protected area
Demographics
| Historical population | |||
|---|---|---|---|
| Census | Pop. | %± | |
| 1920 | 9,441 | — | |
| 1930 | 9,171 | −2.9% | |
| 1940 | 10,762 | 17.3% | |
| 1950 | 10,495 | −2.5% | |
| 1960 | 11,672 | 11.2% | |
| 1970 | 11,619 | −0.5% | |
| 1980 | 15,304 | 31.7% | |
| 1990 | 16,543 | 8.1% | |
| 2000 | 19,155 | 15.8% | |
| 2010 | 26,140 | 36.5% | |
| Est. 2017 | 28,446 | [14] | 8.8% |
| U.S. Decennial Census[15] 1790-1960[16] 1900-1990[17] 1990-2000[18] 2010-2013[1] | |||
2000 census
As of the census[19] of 2000, there were 19,155 people, 5,901 households, and 4,880 families residing in the county. The population density was 18 people per square mile (7/km²). There were 6,287 housing units at an average density of 6 per square mile (2/km²). The racial makeup of the county was 90.87% White, 0.28% Black or African American, 0.46% Native American, 0.23% Asian, 0.08% Pacific Islander, 6.76% from other races, and 1.33% from two or more races. 9.96% of the population were Hispanic or Latino of any race. 32.7 were of English, 10.9% German and 9.2% American ancestry according to Census 2000.
There were 5,901 households out of which 47.60% had children under the age of 18 living with them, 72.60% were married couples living together, 6.80% had a female householder with no husband present, and 17.30% were non-families. 15.20% of all households were made up of individuals and 7.40% had someone living alone who was 65 years of age or older. The average household size was 3.23 and the average family size was 3.62.
In the county, the population was spread out with 36.30% under the age of 18, 9.60% from 18 to 24, 25.50% from 25 to 44, 19.30% from 45 to 64, and 9.30% who were 65 years of age or older. The median age was 29 years. For every 100 females there were 102.20 males. For every 100 females age 18 and over, there were 101.00 males.
The median income for a household in the county was $37,737, and the median income for a family was $41,530. Males had a median income of $31,298 versus $19,755 for females. The per capita income for the county was $13,838. About 8.00% of families and 10.40% of the population were below the poverty line, including 13.00% of those under age 18 and 8.70% of those age 65 or over.
2010 census
As of the 2010 United States Census, there were 26,140 people, 8,146 households, and 6,698 families residing in the county.[20] The population density was 23.9 inhabitants per square mile (9.2/km2). There were 8,722 housing units at an average density of 8.0 per square mile (3.1/km2).[21] The racial makeup of the county was 91.2% white, 0.8% American Indian, 0.4% Asian, 0.2% black or African American, 0.1% Pacific islander, 5.8% from other races, and 1.5% from two or more races. Those of Hispanic or Latino origin made up 10.1% of the population.[20] In terms of ancestry, 31.4% were English, 13.9% were German, 8.2% were American, 5.9% were Danish, and 5.3% were Irish.[22]
Of the 8,146 households, 47.7% had children under the age of 18 living with them, 70.6% were married couples living together, 7.4% had a female householder with no husband present, 17.8% were non-families, and 15.0% of all households were made up of individuals. The average household size was 3.20 and the average family size was 3.57. The median age was 30.0 years.[20]
The median income for a household in the county was $51,579 and the median income for a family was $55,705. Males had a median income of $42,177 versus $27,314 for females. The per capita income for the county was $19,019. About 7.7% of families and 10.2% of the population were below the poverty line, including 11.7% of those under age 18 and 9.0% of those age 65 or over.[23]
Politics
Jefferson County is a traditionally Republican and conservative county. The last Democrat who carried the county in a presidential election was Truman in 1948. In 2012 President Obama received just 11.4% of the vote. In the 1972 Presidential election Richard Nixon won the county with then John Birch Society member John G. Schmitz reportedly receiving 27.51% of the county's vote.[24] No Democratic candidate has received more than 20% of the county's vote since, at latest, 1988.[25]
| Year | Republican | Democratic | Third parties |
|---|---|---|---|
| 2016 | 73.5% 8,436 | 8.5% 976 | 18.0% 2,063 |
| 2012 | 86.9% 9,895 | 11.5% 1,303 | 1.6% 183 |
| 2008 | 81.8% 8,540 | 15.7% 1,641 | 2.5% 260 |
| 2004 | 86.5% 7,703 | 12.2% 1,084 | 1.3% 119 |
| 2000 | 82.7% 6,480 | 14.0% 1,100 | 3.3% 256 |
| 1996 | 66.5% 4,925 | 19.3% 1,427 | 14.2% 1,051 |
| 1992 | 48.8% 3,471 | 13.7% 978 | 37.5% 2,667 |
| 1988 | 79.6% 5,295 | 18.0% 1,198 | 2.4% 156 |
| 1984 | 87.9% 5,770 | 11.3% 743 | 0.8% 50 |
| 1980 | 84.5% 5,860 | 12.0% 833 | 3.5% 240 |
| 1976 | 65.1% 3,599 | 31.6% 1,745 | 3.3% 181 |
| 1972 | 58.4% 2,983 | 14.0% 715 | 27.6% 1,412 |
| 1968 | 61.5% 2,927 | 20.1% 955 | 18.5% 879 |
| 1964 | 57.1% 2,740 | 42.9% 2,061 | |
| 1960 | 52.5% 2,625 | 47.5% 2,374 | |
| 1956 | 60.1% 2,748 | 39.9% 1,823 | |
| 1952 | 66.8% 2,970 | 33.2% 1,474 | 0.0% 2 |
| 1948 | 41.8% 1,490 | 56.5% 2,017 | 1.7% 61 |
| 1944 | 39.8% 1,458 | 60.0% 2,198 | 0.3% 9 |
| 1940 | 39.3% 1,717 | 60.3% 2,631 | 0.4% 16 |
| 1936 | 26.8% 1,037 | 71.8% 2,776 | 1.3% 51 |
| 1932 | 31.5% 1,177 | 67.0% 2,501 | 1.5% 54 |
| 1928 | 55.2% 1,671 | 44.6% 1,350 | 0.2% 7 |
| 1924 | 50.1% 1,393 | 39.0% 1,084 | 11.0% 305 |
| 1920 | 70.8% 1,794 | 29.2% 741 | |
| 1916 | 36.4% 993 | 58.9% 1,606 | 4.6% 126 |
Communities
Cities
Unincorporated communities
Notable people
- Philo Farnsworth, American inventor and television pioneer.
- Pat Friday, American singer.
See also
References
- 1 2 "State & County QuickFacts". United States Census Bureau. Archived from the original on July 12, 2011. Retrieved June 30, 2014.
- ↑ "Find a County". National Association of Counties. Archived from the original on 2011-05-31. Retrieved 2011-06-07.
- ↑ "Jefferson County". State of Idaho. Archived from the original on 2009-08-15. Retrieved 2009-05-31.
- ↑ "US Gazetteer files: 2010, 2000, and 1990". United States Census Bureau. 2011-02-12. Retrieved 2011-04-23.
- ↑ "Postmaster Finder". United States Postal Service. Retrieved 21 February 2017.
- ↑ "Check ins for this Travel Point". motoidaho.com. Retrieved 21 February 2017.
- ↑ "Utah Northern". The Commercial and Financial Chronicle. 29 (735): 96. July 26, 1879. Retrieved 21 February 2017.
- ↑ Report on Population of the United States, at the Eleventh Census: 1890 (PDF). Washington: Government Printing Office. 1895. p. 99. Retrieved 21 February 2017.
- ↑ Census Reports Volume I: Twelfth Census of the United States, Taken in the Year 1900 (PDF). Washington: United States Census Office. 1901. p. 112. Retrieved 21 February 2017.
- ↑ Thirteenth Census of the United States Taken in the Year 1910 (PDF). Washington: Government Printing Office. 1913. pp. 415–416. Retrieved 21 February 2017.
- ↑ Scott, Patricia Lyn and Marjory (2009). Images of America: Jefferson County. Charleston: Arcadia Publishing. pp. 12, 15, 17, 21, 25–27, 29.
- ↑ General Laws of the Territory of Idaho, Ninth Session: An Act Defining the Boundary Line Between Alturas and Oneida Counties. Boise City: Milton Kelly, Territorial Printer. 1877. pp. 90–91. Retrieved 21 February 2017.
- ↑ Idaho Atlas of Historical County Boundaries. Chicago: The Newberry Library. 2010. pp. 12, 26–27, 87, 115–116, 162.
- ↑ "Population and Housing Unit Estimates". Retrieved Apr 7, 2018.
- ↑ "U.S. Decennial Census". United States Census Bureau. Archived from the original on May 12, 2015. Retrieved June 30, 2014.
- ↑ "Historical Census Browser". University of Virginia Library. Retrieved June 30, 2014.
- ↑ "Population of Counties by Decennial Census: 1900 to 1990". United States Census Bureau. Retrieved June 30, 2014.
- ↑ "Census 2000 PHC-T-4. Ranking Tables for Counties: 1990 and 2000" (PDF). United States Census Bureau. Retrieved June 30, 2014.
- ↑ "American FactFinder". United States Census Bureau. Retrieved 2008-01-31.
- 1 2 3 "DP-1 Profile of General Population and Housing Characteristics: 2010 Demographic Profile Data". United States Census Bureau. Retrieved 2016-01-09.
- ↑ "Population, Housing Units, Area, and Density: 2010 - County". United States Census Bureau. Retrieved 2016-01-09.
- ↑ "DP02 SELECTED SOCIAL CHARACTERISTICS IN THE UNITED STATES – 2006-2010 American Community Survey 5-Year Estimates". United States Census Bureau. Retrieved 2016-01-09.
- ↑ "DP03 SELECTED ECONOMIC CHARACTERISTICS – 2006-2010 American Community Survey 5-Year Estimates". United States Census Bureau. Retrieved 2016-01-09.
- ↑ David Leip's Presidential Election Atlas - 1972 statistics
- ↑ The New York Times Electoral Map (Zoom in on Idaho)
- ↑ Leip, David. "Dave Leip's Atlas of U.S. Presidential Elections". uselectionatlas.org. Retrieved 2018-04-04.
External links
Places adjacent to Jefferson County, Idaho | ||||||||||
|---|---|---|---|---|---|---|---|---|---|---|
| ||||||||||
Municipalities and communities of Jefferson County, Idaho, United States | ||
|---|---|---|
| Cities | ||
| Unincorporated communities | ||
| Footnotes | ‡This populated place also has portions in an adjacent county or counties | |