Meerut district
| Meerut district मेरठ जनपद | |
|---|---|
| District of Uttar Pradesh | |
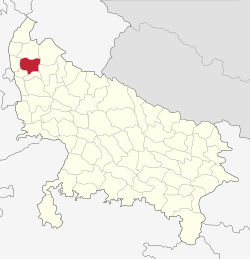 Location of Meerut district in Uttar Pradesh | |
| Country | India |
| State | Uttar Pradesh |
| Administrative division | Meerut division |
| Headquarters | Meerut |
| Tehsils | 3 |
| Government | |
| • Lok Sabha constituencies | Meerut |
| • Assembly seats | 7 |
| Area | |
| • Total | 2,522 km2 (974 sq mi) |
| Population (2011) | |
| • Total | 3,443,689[1] |
| • Urban | 51.07 % |
| Demographics | |
| • Literacy | 74.80 %[2] |
| • Sex ratio | 885[2] |
| Vehicle registration | UP-15 |
| Major highways | NH-58, |
| Coordinates | 28°59′02″N 77°42′14″E / 28.984°N 77.704°E |
| Website | Official website |
Meerut district, is one of the districts of Uttar Pradesh state of India, and Meerut is the district headquarters. Meerut district is also a part of the Meerut division.[3] The administrative head of district of Meerut is a District Magistrate[4] while the administrative head of Meerut Division is Divisional Commissioner, an IAS officer.[5]
History
The district was established under British rule in 1818 and, on establishment, constituted the then tehsils of Meerut, Ghaziabad, Hastinapur, Baghpat, Sardhana and Hapur.[6][7] These now constitute the districts of Meerut, Ghaziabad, Hapur, Bagpat, Muzaffarnagar, Bulandshahr and a part of Gautam Buddh Nagar district.[6]
Geography
Meerut district lies between 28°57’ to 29°02’ North latitude and 77°40’ to 77°45’ East longitude in the Indo-Gangetic plains of India.[8] It is bound on the north by Muzaffarnagar district, in the south by Bulandshahar district while Ghaziabad and Baghpat districts form the southern and western limits.[9] The river Ganges forms the eastern boundary and separates the district from Moradabad district and Bijnor district.[9] The Hindon forms the western boundary and separates the district from Baghpat.[9] The ground is not rocky and there are no mountains. The soil is composed of pleistocene and sub-recent alluvial sediments transported and deposited by river action from the Himalayan region.[8] These alluvial deposits are unconsolidated.[8] Lithologically, sediments consist of clay, silt and fine to coarse sand.[8] Land is very fertile for growing crops, especially wheat, sugarcane and vegetables.[8]
Administration
The administrative head of district of Meerut is a District Magisrtate[4] while the administrative head of Meerut Division is Divisional Commissioner, an IAS officer.[5]
| S No | Name of District Magistrate | Period | |
|---|---|---|---|
| From | To | ||
| 1 | Jai Kirat Singh | 15-08-1947 | 30-08-1949 |
| 2 | V.C.Sharma | 04-07-1949 | 15-07-1951 |
| 3 | V.V.Singh | 16-07-1951 | 01-01-1953 |
| 4 | V.B.L.Dubey | 02-01-1953 | 15-05-1955 |
| 5 | S.R.D.Saxena | 16-05-1955 | 06-07-1956 |
| 6 | Gyan Prakash | 12-07-1956 | 13-01-1959 |
| 7 | P.N.Kapoor | 14-01-1959 | 04-05-1960 |
| 8 | S.K.Sarkar | 05-05-1960 | 09-06-1961 |
| 9 | B.B.Sahi | 20-06-1961 | 16-06-1962 |
| 10 | B.N.Tondon | 11-07-1962 | 07-04-1965 |
| 11 | D.M.Sinha | 11-05-1965 | 26-05-1967 |
| 12 | S. P. Batal | 09-08-1967 | 26-03-1969 |
| 13 | R.K.Kaul | 23-03-1969 | 03-07-1973 |
| 14 | Rajendra Nath | 04-07-1971 | 16-06-1973 |
| 15 | J. C. Pant | 16-07-1973 | 27-12-1973 |
| 16 | T. N. Dhar | 28-12-1973 | 01-06-1974 |
| 17 | B. N. Tiwari | 02-06-1974 | 01-04-1977 |
| 18 | R. S. Mathur | 07-04-1977 | 15-04-1979 |
| 19 | A. P. Singh | 15-04-1979 | 01-04-1980 |
| 20 | V.Anand | 01-04-1980 | 18-04-1981 |
| 21 | Shambhu Nath | 18-04-1981 | 18-12-1982 |
| 22 | T. George Joseph | 18-12-1982 | 09-06-1984 |
| 23 | L.R.Singh | 09-06-1984 | 11-07-1986 |
| 24 | R.S. Kaushik | 11-07-1986 | 04-07-1987 |
| 25 | T.George Joseph | 04-07-1987 | 27-11-1987 |
| 26 | Vijay Sharma | 27-11-1987 | 24-05-1990 |
| 27 | G.C.Chaturvedi | 26-05-1990 | 12-11-1991 |
| 28 | Tulsi Gaur | 12-07-1991 | 02-07-1992 |
| 29 | Jai Shanker Mishra | 02-07-1992 | 07-07-1993 |
| 30 | Mohinder Singh | 07-07-1993 | 09-06-1994 |
| 31 | S.N. Seth | 09-06-1994 | 08-06-1995 |
| 32 | Deepak Singhal | 09-06-1995 | 18-07-1997 |
| 33 | Sanjay Agarwal | 18-07-1997 | 26-10-1999 |
| 34 | Avneesh Kumar Avasthi | 26-10-1999 | 11-05-2002 |
| 35 | P. V. Jagan Mohan | 11-05-2002 | 22-08-2002 |
| 36 | Rama Raman | 22-08-2002 | 03-04-2003 |
| 37 | Amit Mohan Prasad | 03-04-2003 | 19-06-2004 |
| 38 | Rajesh Kumar Singh | 19-06-2004 | 03-10-2004 |
| 39 | Chandra Bhanu | 04-10-2004 | 20-09-2005 |
| 40 | Ram Krishan | 20-09-2005 | 12-04-2006 |
| 41 | Mukesh Kumar Meshram | 13-04-2006 | 16-05-2007 |
| 42 | Niteshwar Kumar | 16-05-2007 | 16-08-2007 |
| 43 | Anil Kumar Sagar | 18-08-2007 | 03-03-2008 |
| 44 | Ms Kamini Chauhan Ratan | 04-03-2008 | 11-07-2009 |
| 45 | Amit Kumar Ghosh | 11-07-2009 | 23-09-2009 |
| 46 | Bhuvnesh Kumar | 26-09-2009 | 05-03-2011 |
| 47 | Subhash Chand Sharma | 07-03-2011 | 27-04-2011 |
| 48 | Anil Garg | 27-04-2011 | 19-09-2011 |
| 49 | Anil Kumar | 19-09-2011 | 23-03-2012 |
| 50 | Vikas Gothalwal | 23-03-2012 | 11-02-2013 |
| 51 | Navdeep Rinwa | 11-02-2013 | 07-02-2014 |
| 52 | Pankaj Yadav | 07-02-2014 | 27-03-2014 |
| 53 | Navdeep Rinwa | 27-03-2014 | 09-06-2014 |
| 54 | Pankaj Yadav | 09-06-2014 | 22-07-2016 |
| 55 | Jagat Raj | 22-07-2016 | 14-09-2016 |
| 56 | Ms. B. Chandrakala | 14-09-2016 | 31-03-2017 |
| 57 | Sameer Verma | 31-03-2017 | Till Date |
Lok Sabha Constituency
The district of Meerut represents one Lok Sabha constituency, which is also known as Meerut-Hapur constituency. Presently, Meerut Lok Sabha constituency comprises 5 Vidhan Sabha (legislative assembly) segments. These are:[11][12]
| Constituency number | Name | Reserved for (SC/ST/None) | District | Number of electorates (2009) |
|---|---|---|---|---|
| 46 | Kithore | None | Meerut | 290,768 |
| 47 | Meerut Cantonment | None | Meerut | 324,906 |
| 48 | Meerut | None | Meerut | 281,518 |
| 49 | Meerut South | None | Meerut | 337,192 |
| 59 | Hapur | SC | Hapur | 258,907 |
| Total: | 1,493,291 | |||
Vidhan Sabha Constituency
As of 25 January 2017, the district contributes seven Vidhan Sabha(Legislative Assembly) constituencies.[13][14][15]
| Constituency number | Name | Reserved for (SC/ST/None) |
|---|---|---|
| 43 | Siwalkhas | None |
| 44 | Sardhana | None |
| 45 | Hastinapur | SC |
| 46 | Kithore | None |
| 47 | Meerut Cantonment | None |
| 48 | Meerut | None |
| 49 | Meerut South | None |
Tehsil
District administration comprises 3 tehsils, namely:[15]
- Meerut
- Mawana
- Sardhana
Block
District is divided into 12 blocks, namely:[15]
- Meerut
- Hastinapur
- Kharkhauda
- Jani
- Rohata
- Mawana
- Parikshitgarh
- Machhara
- Rajpura
- Sardhana
- Daurala
- Saroorpur
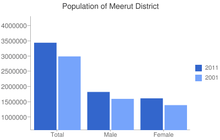
Demographics
According to the 2011 census Meerut district has a population of 3,443,689,[16][17][2] roughly equal to the nation of Panama[18] or the US state of Connecticut.[19] This gives it a ranking of 94th in India (out of a total of 640).[16] The district has a population density of 1,346 inhabitants per square kilometre (3,490/sq mi).[16] Its population growth rate over the decade 2001-2011 was 14.89%.[16] Meerut has a sex ratio of 886 females for every 1000 males, lower than the state average of 908; while the child sex ratio is 852, lower than the state average of 899.[16] The district has a literacy rate of 72.84%, higher than the state average of 69.72%.[20][21]
According to the 2001 census, the district ranked 6th in terms of population density[22] in Uttar Pradesh. The district had an average literacy rate of 65.96%, higher than the national average of 64.8% and the state average of 57.36%.[23][24][25] 16.66% of the population was under 6 years of age.[26] The percentage of Muslim population over 36% (one of the largest among the cities of India).[27]
Area-Based
| Tehsil | Town/Village [lower-roman 1] |
Hindu |
Literacy Rate | |||||
|---|---|---|---|---|---|---|---|---|
| Male | Female | Total | Male | Female | Total | |||
| Meerut | Kharkhoda (NP) | 7584 | 6780 | 14,364 | 894 | 85.68% | 67.51% | 76.99% |
| Sewalkhas (NP) | 13073 | 11809 | 24,882 | 903 | 66.52% | 45.94% | 56.74% | |
| Meerut (CB) | 53024 | 40288 | 93,312 | 760 | 87.99% | 79.48% | 84.33% | |
| Meerut (M Corp.) | 688118 | 617311 | 1,305,429 | 897 | 80.97% | 69.79% | 75.66% | |
| Mohiuddinpur (CT) | 2811 | 2389 | 5,200 | 850 | 89.17% | 69.63% | 80.13% | |
| Aminagar Urf Bhurbaral (CT) | 3314 | 2827 | 6,141 | 853 | 91.01% | 69.68% | 81.02% | |
| Amehra Adipur (CT) | 2844 | 2641 | 5,485 | 929 | 85.68% | 68.05% | 77.14% | |
| Sindhawali (CT) | 2782 | 2553 | 5,335 | 918 | 79.92% | 64.44% | 72.53% | |
| Tehsil Meerut Total | 1114701 | 987456 | 2,102,157 | 886 | 81.54% | 67.26% | 74.81% | |
| Mawana & Hastinapur | Hastinapur (NP) | 26010 | 20442 | 46,452 | 940 | 82.50% | 63.47% | 73.48% |
| Parikshitgarh (NP) | 10385 | 9445 | 19,830 | 909 | 87.83% | 70.92% | 79.73% | |
| Mawana (NPP) | 43029 | 38414 | 81,443 | 893 | 77.81% | 62.49% | 70.55% | |
| Kithaur (NP) | 14488 | 13445 | 27,933 | 928 | 69.85% | 51.71% | 61.11% | |
| Bahsuma (NP) | 6307 | 5446 | 11,753 | 863 | 84.14% | 66.12% | 75.70% | |
| Phalauda (NP) | 10423 | 9485 | 19,908 | 910 | 71.54% | 51.01% | 61.79% | |
| Tehsil Mawana Total | 421829 | 370612 | 792,441 | 885 | 80.30% | 59.27% | 70.40% | |
| Sardhana | Lawar (NP) | 11599 | 10425 | 22,024 | 899 | 69.82% | 47.92% | 59.37% |
| Daurala (NP) | 10565 | 9211 | 19,776 | 872 | 87.64% | 69.71% | 79.23% | |
| Sardhana (NPP) | 30171 | 28081 | 58,252 | 931 | 70.96% | 54.88% | 63.18% | |
| Karnawal (NP) | 6296 | 5367 | 11,663 | 852 | 86.81% | 66.50% | 77.36% | |
| Tehsil Sardhana Total | 301213 | 267878 | 569,091 | 889 | 78.34% | 58.05% | 68.74% | |
| District - Meerut Total | 1,837,743 | 1,625,946 | 3,463,689 | 886 | 80.74% | 63.98% | 72.84% | |
| ||||||||
| Year | Urban | Rural | Total | Growth rate | Sex ratio[lower-alpha 1] | Density[lower-alpha 2] | ||||||
|---|---|---|---|---|---|---|---|---|---|---|---|---|
| Male | Female | Total | Male | Female | Total | Male | Female | Total | ||||
| 1971[28][29][lower-alpha 3][lower-alpha 4] | NA | NA | 817,445 | NA | NA | 2,546,204 | NA | NA | 3,363,649 | 24.04% | 830 | 563 |
| 1981[29][30][31][lower-alpha 4] | NA | NA | 863,280 | NA | NA | 1,903,280 | NA | NA | 2,767,246 | 28.43%[lower-alpha 5] | 841 (+11) | 708 (+145) |
| 1991[lower-alpha 6][23][32][33] | NA | NA | 849,799 | NA | NA | 1,567,714 | 1,301,137 (53.82%) | 1,116,376 (46.18%) | 2,417,513 | 24.91% | 858 (+17) | 959 (+251) |
| 2001[23][26][27][34] | 774,670 | 677,313 | 1,451,983 | 826,908 | 718,470 | 1,545,378 | 1,601,578 (53.43%) | 1,395,783 (46.56%) | 2,997,361 | 24.16%[lower-alpha 5] | 871 (+13) | 1190 (+231) |
| 2011[2][20][21][35] | 932,736 | 829,837 | 1,762,573 | 896,456 | 788,376 | 1,684,832 | 1,829,192 (53.06%) | 1,618,213 (46.94%) | 3,443,689 | 15.92% | 885 (+14) | 1347 (+157) |
| ||||||||||||
| Year | Male | Female | Total | |
|---|---|---|---|---|
| 1991[lower-alpha 1][23] | 64.88 | 37.67 | 52.41 | |
| 2001[23][26] | 76.31 (+11.43) | 54.12 (+16.45) | 65.96 (+13.55) | |
| 2011[21][35] | 82.91 (+6.6) | 65.69 (+11.57) | 74.80 (+8.84) | |
| ||||
| Year | Population |
|---|---|
| 1872 | 1,267,167 |
| 1881 | 1,313,137 |
| 1891 | 1,391,458 |
| 1901 | 1,540,175 |
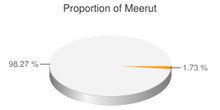
Religion
| Religion | |||||||
|---|---|---|---|---|---|---|---|
| Male | Female | Total | Male | Female | Total | ||
| Hindu | 1,169,512 | 1,013,743 | 2,183,255 | 867 | 88.02% | 71.28% | 80.20% |
| Muslim | 617,178 | 568,465 | 1,185,643 | 921 | 65.58% | 49.07% | 57.66% |
| Christian | 5,500 | 5,082 | 10,582 | 924 | 85.12% | 75.65% | 80.57% |
| Sikh | 13,694 | 11,218 | 24,912 | 819 | 85.47% | 73.11% | 79.90% |
| Buddhist | 999 | 856 | 1,855 | 857 | 88.39% | 73.73% | 81.63% |
| Jain | 9,554 | 8,990 | 18,544 | 941 | 97.51% | 95.02% | 96.31% |
| Others | 118 | 118 | 236 | 1,000 | 94.50% | 86.00% | 90.43% |
| Not stated | 9,188 | 9,474 | 18,662 | 1,031 | 82.02% | 68.16% | 74.81% |
| Meerut District | 1,825,743 | 1,617,946 | 3,443,689 | 886 | 80.74% | 63.98% | 72.84% |
There were 1987 Meerut communal riots and 2014 Meerut riots. A Roman Catholic Diocese of Meerut is active in the district.
Communities
- Brahmins
- Gurjars
- Jaat
- Rajput
- Tyagi
- Vaish
- jatav
others
Areas
Cities
Towns
Villages
- Agherra
- Ajrara
- Alamgirpur
- Amhera Adipur
- Bajout
- Batavali
- Bhandora
- Bhoopgarhi
- Bhopgarh
- Chhur
- Fatehapur Narayan
- Hajipur
- Harra
- Incholi
- Jai
- Jani Khurd
- Jani Kala
- Kaland
- Kaseru Baksar
- Khalidpur
- Kheri Tappa
- Khiwai
- Machhra
- Mod Kala
- Mod Khurd
- Mohmandpur
- Niloha
- Pabarsa
- Palra
- Rampur Pawti
- Samaypur, Garh road
- Shahjahanpur
- Sadarpur
- Gejh
- Raghunathpura
- Palhera
References
- ↑ http://www.census2011.co.in/district.php
- 1 2 3 4 "Census of India 2011 - Provisional Population Totals - Uttar Pradesh - Data Sheet" (PDF). Directorate of Census Operations, Uttar Pradesh. Retrieved 26 May 2011.
- ↑ For Literacy rate, population aged 7 and above only is considered in India.
- 1 2 "District Magistrates of Meerut". meerut.nic.in. Retrieved 2017-06-15.
- 1 2 "Commissioners of Meerut Division". meerut.nic.in. Retrieved 2017-06-15.
- 1 2 3 Meerut District – History The Imperial Gazetteer of India, 1909, v. 17, p. 256-257, 261.
- ↑ Sylvia Vatuk (1972). Kinship and Urbanization: White Collar Migrants in North India. University of California Press. p. 2. ISBN 9780520020641.
- 1 2 3 4 5 "Chapter 3 – Findings: Metro Cities of India" (pdf). Central Pollution Control Board. p. 63. Retrieved 1 April 2011.
- 1 2 3 "Consultancy Services for preparation of the City Development Plan(CDP) for Meerut in the state of Uttar Pradesh under JNNURM" (PDF). Jawaharlal Nehru National Urban Renewal Mission, Ministry of Urban Development, Government of India. August 2006. p. 209. Archived from the original (pdf) on 30 September 2012. Retrieved 30 September 2012.
- ↑ "District Magistrates". meerut.nic.in. Retrieved 2017-06-15.
- ↑
- ↑ "Information and Statistics-Parliamentary Constituencies-10-Meerut". Chief Electoral Officer, Uttar Pradesh website.
- ↑ "VOTER LIST 2017 ELECTION". meerut.nic.in. Retrieved 2017-06-13.
- ↑ "DELIMITATION OF PARLIAMENTARY AND ASSEMBLY CONSTITUENCIES ORDER, 2008" (PDF). Election Commission of India: 463, 464. 2008.
- 1 2 3 4 "DISTRICT MEERUT DETAILS". meerut.nic.in. Retrieved 2017-06-13.
- 1 2 3 4 5 6 "Meerut District Population Census 2011, Uttar Pradesh literacy sex ratio and density". www.census2011.co.in. Retrieved 2017-06-15.
- 1 2 3 "Census of India Website : Office of the Registrar General & Census Commissioner, India". www.censusindia.gov.in. Retrieved 2017-06-15.
- ↑ US Directorate of Intelligence. "Country Comparison:Population". Retrieved 2011-10-01.
Panama 3,460,462 July 2011 est.
- ↑ "2010 Resident Population Data". U. S. Census Bureau. Archived from the original on October 19, 2013. Retrieved 2011-09-30.
Connecticut 3,574,097
- 1 2 "Census of India 2011 – Provisional Population Totals – Uttar Pradesh – Data Sheet" (pdf). Retrieved 15 March 2012.
- 1 2 3 "Provisional Population Totals, Census of India 2011; Urban Agglomerations/Cities having population 1 lakh and above" (pdf). Directorate of Census Operations, Uttar Pradesh, India.
- ↑ "Ranking of districts by population density". Government of Uttar Pradesh. Archived from the original on 22 November 2011.
- 1 2 3 4 5 "Census-2001: Literacy Rates by sex for State and Districts". Government of Uttar Pradesh. Archived from the original on 22 December 2011. Retrieved 8 April 2011.
- ↑ "CENSUS-2001". Government of Uttar Pradesh. Archived from the original on 22 November 2011. Retrieved 6 April 2011.
- ↑ Census of India 2001
- 1 2 3 "Population in the age group 0-6, number of literates and literacy rate for state and districts". Government of Uttar Pradesh. Archived from the original on 22 November 2011.
- 1 2 "Basic data sheet, District Meerut, Uttar Pradesh. Census of India 2001" (pdf).
- ↑ Basant Lal Bhatia (1992). Existence of Cooperation & Consumers-cooperatives. Sarup & Sons. pp. 21–22. ISBN 9788185431178. Retrieved 20 August 2013.
- 1 2 "Sex Ratio since 1901 for state and districts". Government of Uttar Pradesh. Archived from the original on 24 December 2001. Retrieved 17 October 2013.
- ↑ Jagdish Kumar Pundir (1998). Banking, Bureaucracy, and Social Networks: Scheduled Castes in the Process of Development. Sarup & Sons. p. 50. ISBN 9788176250245.
- ↑ "Percentage decadal variation in population since 1901 for state and districts". Government of Uttar Pradesh. Archived from the original on 22 November 2011. Retrieved 19 July 2013.
- ↑ "Census-2001: Ranking of Districts by population size in 1991 and 2001". Government of Uttar Pradesh. Archived from the original on 22 December 2011. Retrieved 8 April 2011.
- ↑ "Population distribution, percentage decadal growth, sex ratio and Population Density". Government of Uttar Pradesh. Archived from the original on 22 December 2011. Retrieved 8 April 2011.
- ↑ . Census of India.
- 1 2 "Meerut District Population Census 2011, Uttar Pradesh literacy sex ratio and density". www.census2011.co.in. Retrieved 2017-06-15.
- ↑ "Meerut Religion Census 2011". Office of the Registrar General and Census Commissioner, India. Retrieved 2015-11-16.
Places adjacent to Meerut district | |
|---|---|