2016 United States presidential election in Utah
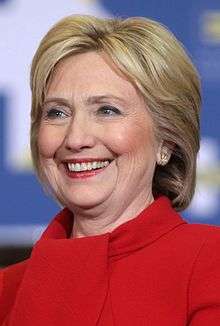
The 2016 United States presidential election in Utah was held on November 8, 2016, as part of the 2016 United States presidential election which was also held in the other 49 states and in the District of Columbia. Voters were asked to pick 6 electors to be pledged for a candidate in the Electoral College. The two main tickets of the election were the Republican one, consisting of businessman Donald Trump and Indiana Governor Mike Pence, and the Democratic one, consisting of former Secretary of State Hillary Clinton and Virginia Senator Tim Kaine.
| |||||||||||||||||||||||||||||||||
| Turnout | 82.00%[1] | ||||||||||||||||||||||||||||||||
|---|---|---|---|---|---|---|---|---|---|---|---|---|---|---|---|---|---|---|---|---|---|---|---|---|---|---|---|---|---|---|---|---|---|
| |||||||||||||||||||||||||||||||||
 County results Trump: 40–50% 50–60% 60–70% 70–80% 80–90% Clinton: 40–50% 50–60% | |||||||||||||||||||||||||||||||||
| |||||||||||||||||||||||||||||||||
.jpg)
| Elections in Utah | ||||||||||
|---|---|---|---|---|---|---|---|---|---|---|
 | ||||||||||
|
||||||||||
|
Ballot measures
|
||||||||||
|
|
||||||||||
On March 22, 2016,[2] in the presidential primaries, Utah voters expressed their preferences for the Democratic and Republican parties' respective nominees for president. The state uses a system of semi-closed primaries, meaning that voters registered with a specific party can vote in that party's primary, while voters who are unaffiliated can vote in the primary of one party of their choosing.
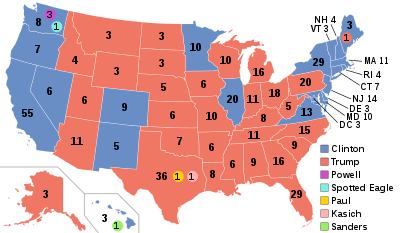
Utah was won by Donald Trump, who won the state with 45.5 percent of the vote, the lowest percentage for any Republican since George H. W. Bush in 1992. Hillary Clinton received 27.5 percent of the vote, and Independent candidate Evan McMullin received 21.5 percent.[1] The 18.08 point margin was the closest a Democrat has come to winning Utah since 1964, when Lyndon Johnson won by 9.73%. However, this was due to Evan McMullin's strong third party showing limited Donald Trump to under 50% of the vote; Clinton received a smaller percentage of the popular vote than five other Democrats in this same time period (Barack Obama in 2008, Bill Clinton in 1996, Michael Dukakis in 1988, Jimmy Carter in 1976, and Hubert Humphrey in 1968) This is one of only three states, the others being Idaho and Vermont, where Gary Johnson did not obtain third place, as McMullin beat him in Idaho and Utah, and write-in votes for Senator Bernie Sanders (who was not openly campaigning) beat him in Vermont.
Background
The incumbent President of the United States, Barack Obama, a Democrat, was first elected president in the 2008 election, running with Joe Biden of Delaware. Defeating the Republican nominee, Senator John McCain of Arizona, with 52.9 percent of the popular vote and 68 percent of the electoral vote,[3][4] Obama succeeded two-term Republican President George W. Bush, the former Governor of Texas. Obama and Biden were reelected in the 2012 presidential election, defeating former Massachusetts Governor Mitt Romney with 51.1 percent of the popular vote and 61.7 percent of electoral votes.[5] Although Barack Obama's approval rating in the RealClearPolitics poll tracking average remained between 40 and 50 percent for most of his second term, it experienced a surge in early 2016 and reached its highest point since 2012 during June of that year.[6][7] Analyst Nate Cohn noted that a strong approval rating for President Obama would equate to a strong performance for the Democratic candidate, and vice versa.[8]
Following his second term, President Obama was not eligible for another reelection. In October 2015, Obama's running-mate and two-term Vice President Biden decided not to enter the race for the Democratic presidential nomination either.[9] With their term expiring on January 20, 2017, the electorate was asked to elect a new president, the 45th president and 48th vice president of the United States, respectively.
Caucus elections
Democratic caucus
Four candidates appeared on the Democratic presidential caucus ballot:
- Hillary Clinton
- Bernie Sanders
- Martin O'Malley (withdrawn)
| Utah Democratic caucuses, March 22, 2016 | |||||
|---|---|---|---|---|---|
| Candidate | Popular vote | Estimated delegates | |||
| Count | Percentage | Pledged | Unpledged | Total | |
| Bernie Sanders | 62,992 | 79.21% | 27 | 2 | 29 |
| Hillary Clinton | 16,166 | 20.33% | 6 | 2 | 8 |
| Others | 34 | 0.04% | |||
| Uncommitted | 334 | 0.42% | 0 | 0 | 0 |
| Total | 79,526 | 100% | 33 | 4 | 37 |
| Source: Utah Democratic Party | |||||
Republican caucus
Three candidates appeared on the Republican presidential caucus ballot:
| Utah Republican caucus, March 22, 2016 | |||||
|---|---|---|---|---|---|
| Candidate | Votes | Percentage | Actual delegate count | ||
| Bound | Unbound | Total | |||
| Ted Cruz | 132,904 | 69.46% | 40 | 0 | 40 |
| John Kasich | 31,992 | 16.72% | 0 | 0 | 0 |
| Donald Trump | 26,434 | 13.82% | 0 | 0 | 0 |
| Unprojected delegates: | 0 | 0 | 0 | ||
| Total: | 191,330 | 100.00% | 40 | 0 | 40 |
| Source: The Green Papers | |||||
General election
Political landscape in Utah
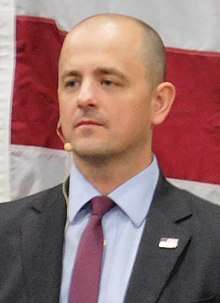
The state of Utah has given its electoral votes to the Republican ticket in every election year since 1968 and only once voted for a Democratic candidate in elections since 1952 (in 1964). The state has a majority of members of The Church of Jesus Christ of Latter-day Saints (LDS Church) population, which on the national level voted 78 percent to 21 percent for Mitt Romney in 2012.[10] This very heavily contributed to Mitt Romney winning the state by a margin of 73 percent to 25 percent in the 2012 election. However, Donald Trump's criticism of Romney's faith on the campaign trail in 2016 angered many Republican voters.[11] Polls suggested that Utah might be a strong state for Libertarian candidate Gary Johnson as a protest vote against Trump.[12] As a result, Larry Sabato's online election forecaster, Sabato's Crystal Ball, downgraded their rating of the Utah contest from "Safe Republican" to "Likely Republican" on June 23.[13]
Evan McMullin, a conservative independent candidate, had also been viewed by voters in Utah as another alternative, given that it is also his home state. According to one poll released on October 12, Trump and Clinton were seen as virtually tied in Utah at 26%, with McMullin polling at 22%.[14] McMullin's rise was the result of further Republican backlash against Trump following the release of a controversial video from 2005 showing Trump bragging about obscene sexual conduct with women.[15] In a HeatStreet poll conducted from October 15–16, McMullin was polled in second place with 29% of likely voters, coming behind Trump who polled at 30%, and ahead of Clinton who polled at 28 percent.[16] In a poll conducted by Emerson College from October 17–19 with a sample size of 700 people, McMullin placed first with 31 percent ahead of Trump by a 4 percent margin, who had 27 percent of support, while Clinton polled in third at 24 percent.[17] This was the first conducted statewide opinion poll of the 2016 election where a third-party candidate has placed first.
Had McMullin won Utah, he would have become the first nationally nonpartisan candidate since George Washington to win a state in 224 years since Washington's reelection in 1792,[lower-alpha 1] and ultimately the first nonpartisan candidate to win a state west of the Mississippi River.
Polling
Candidates on the ballot
The following candidates were listed on the ballot:
- Donald Trump & Mike Pence (Republican Party)
- Evan McMullin & Nathan Johnson (Not affiliated with any Party)
- Hillary Clinton & Tim Kaine (Democratic Party)
- Gary Johnson & William Weld (Libertarian Party)
- Darrell Castle & Scott N. Bradley (Constitution Party)
- Jill Stein & Ajamu Baraka (Green Party)
- Rocky De La Fuente & Michael Steinberg (Reform Party)
- Rocky Giordani & Farley Anderson (Independent American Party)
- Alyson Kennedy & Osborne Hart (Socialist Workers Party)
- Monica Moorehead & Lamont Lilly (Workers World Party)
Candidates not on the ballot
The following were certified by the state as "write-in candidates", which means that votes given to these persons would be counted:
- Stephen Paul Parks
- Mike Smith & Daniel White
- Laurence Kotlikoff & Edward Leamer
- Tom Hoefling & Steve Schulin
- David Limbaugh & Bo Gingrich
- Dustin Baird & Brandon Russell
- Andrew D. Basiago & Karen D. Kinnison
- Emidio Soltysik & Angela Nicole Walker
- Tony Valdivia & Aaron Roy Barriere
- Cherunda Fox & Roger Kushner
- Sheila "Samm" Tittle & R. Charles Casper-Kacprowicz
- Robert L. Buchanan & Jason A. Washington
- Marshall Schoenke & James Creighton Mitchell Jr.
- Janet Reid & John E. Reid
- Jamin Burton & Victor Neves
Results
| Party | Candidate | Votes | % | |
|---|---|---|---|---|
| Republican | Donald Trump | 515,231 | 45.54% | |
| Democratic | Hillary Clinton | 310,676 | 27.46% | |
| Unaffiliated | Evan McMullin | 243,690 | 21.54% | |
| Libertarian | Gary Johnson | 39,608 | 3.50% | |
| Unaffiliated | Jill Stein | 9,438 | 0.83% | |
| Constitution | Darrell Castle | 8,032 | 0.71% | |
| Others | 4,755 | 0.42% | ||
| Total votes | 1,131,430 | 100.00% | ||
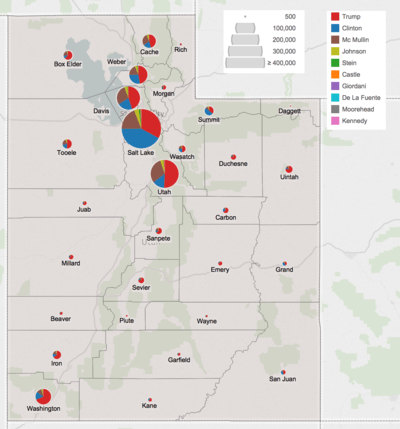
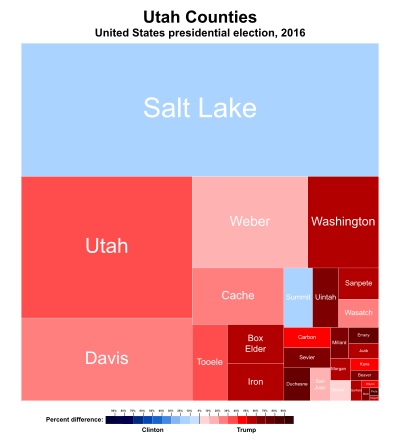
Results by county
| County[20] | Donald John Trump Republican |
Hillary Rodham Clinton Democratic |
David Evan McMullin[21] Unaffiliated |
Gary Earl Johnson[21] Libertarian |
Jill Ellen Stein[21] Unaffiliated |
Darrell Lane Castle[21] Constitution |
Various candidates[21] Other parties |
Margin | Total votes cast | ||||||||
|---|---|---|---|---|---|---|---|---|---|---|---|---|---|---|---|---|---|
| # | % | # | % | # | % | # | % | # | % | # | % | # | % | # | % | ||
| Beaver | 1,838 | 73.79% | 264 | 10.60% | 323 | 12.97% | 36 | 1.45% | 10 | 0.40% | 12 | 0.48% | 8 | 0.32% | 1,515[lower-alpha 2] | 60.82% | 2,491 |
| Box Elder | 12,230 | 61.97% | 2,282 | 11.56% | 4,257 | 21.57% | 591 | 2.99% | 76 | 0.39% | 210 | 1.06% | 89 | 0.45% | 7,973[lower-alpha 2] | 40.40% | 19,735 |
| Cache | 21,139 | 45.80% | 8,563 | 18.55% | 13,695 | 29.67% | 1,630 | 3.53% | 330 | 0.71% | 669 | 1.45% | 131 | 0.28% | 7,444[lower-alpha 2] | 16.13% | 46,157 |
| Carbon | 5,275 | 66.34% | 1,717 | 21.59% | 615 | 7.73% | 191 | 2.40% | 41 | 0.52% | 47 | 0.59% | 66 | 0.83% | 3,558 | 44.74% | 7,952 |
| Daggett | 331 | 69.83% | 77 | 16.24% | 44 | 9.28% | 17 | 3.59% | 4 | 0.84% | 1 | 0.21% | 0 | 0.00% | 254 | 53.59% | 474 |
| Davis | 62,219 | 44.95% | 28,776 | 20.79% | 39,735 | 28.71% | 5,390 | 3.89% | 864 | 0.62% | 883 | 0.64% | 544 | 0.39% | 22,484[lower-alpha 2] | 16.24% | 138,411 |
| Duchesne | 5,508 | 79.34% | 500 | 7.20% | 730 | 10.52% | 107 | 1.54% | 18 | 0.26% | 68 | 0.98% | 11 | 0.16% | 4,778[lower-alpha 2] | 68.83% | 6,942 |
| Emery | 3,425 | 79.86% | 380 | 8.86% | 362 | 8.44% | 71 | 1.66% | 3 | 0.07% | 15 | 0.35% | 33 | 0.77% | 3,045 | 71.00% | 4,289 |
| Garfield | 1,606 | 68.52% | 358 | 15.27% | 286 | 12.20% | 61 | 2.60% | 16 | 0.68% | 3 | 0.13% | 14 | 0.60% | 1,248 | 53.24% | 2,344 |
| Grand | 1,975 | 43.57% | 1,960 | 43.24% | 281 | 6.20% | 180 | 3.97% | 109 | 2.40% | 10 | 0.22% | 18 | 0.40% | 15 | 0.33% | 4,533 |
| Iron | 11,561 | 65.49% | 2,450 | 13.88% | 2,752 | 15.59% | 540 | 3.06% | 102 | 0.58% | 173 | 0.98% | 76 | 0.43% | 8,809[lower-alpha 2] | 49.90% | 17,654 |
| Juab | 2,827 | 67.68% | 442 | 10.58% | 762 | 18.24% | 72 | 1.72% | 14 | 0.34% | 44 | 1.05% | 16 | 0.38% | 2,065[lower-alpha 2] | 49.44% | 4,177 |
| Kane | 2,265 | 64.62% | 741 | 21.14% | 352 | 10.04% | 86 | 2.45% | 31 | 0.88% | 15 | 0.43% | 15 | 0.43% | 1,524 | 43.48% | 3,505 |
| Millard | 3,860 | 73.64% | 431 | 8.22% | 719 | 13.72% | 108 | 2.06% | 6 | 0.11% | 99 | 1.89% | 19 | 0.36% | 3,141[lower-alpha 2] | 59.92% | 5,242 |
| Morgan | 3,188 | 61.40% | 577 | 11.11% | 1,198 | 23.07% | 142 | 2.73% | 11 | 0.21% | 68 | 1.31% | 8 | 0.15% | 1,990[lower-alpha 2] | 38.33% | 5,192 |
| Piute | 626 | 85.87% | 47 | 6.45% | 36 | 4.94% | 11 | 1.51% | 1 | 0.14% | 5 | 0.69% | 3 | 0.41% | 579 | 79.42% | 729 |
| Rich | 797 | 71.87% | 104 | 9.38% | 174 | 15.69% | 21 | 1.89% | 1 | 0.09% | 10 | 0.90% | 2 | 0.18% | 623[lower-alpha 2] | 56.18% | 1,109 |
| Salt Lake | 138,043 | 32.96% | 175,863 | 41.99% | 79,880 | 19.07% | 16,306 | 3.89% | 4,965 | 1.19% | 2,047 | 0.49% | 1,764 | 0.42% | −37,820 | −9.03% | 418,868 |
| San Juan | 2,645 | 48.56% | 2,042 | 37.49% | 486 | 8.92% | 165 | 3.03% | 47 | 0.86% | 45 | 0.83% | 17 | 0.31% | 603 | 11.07% | 5,447 |
| Sanpete | 6,673 | 65.65% | 1,061 | 10.44% | 2,038 | 20.05% | 186 | 1.83% | 30 | 0.30% | 139 | 1.37% | 37 | 0.36% | 4,635[lower-alpha 2] | 45.60% | 10,164 |
| Sevier | 6,740 | 77.88% | 695 | 8.03% | 916 | 10.58% | 175 | 2.02% | 29 | 0.34% | 67 | 0.77% | 32 | 0.37% | 5,824[lower-alpha 2] | 67.30% | 8,654 |
| Summit | 7,333 | 35.53% | 10,503 | 50.88% | 1,786 | 8.65% | 756 | 3.66% | 170 | 0.82% | 44 | 0.21% | 49 | 0.24% | −3,170 | −15.36% | 20,641 |
| Tooele | 11,169 | 51.17% | 4,573 | 20.95% | 4,769 | 21.85% | 783 | 3.59% | 182 | 0.83% | 191 | 0.87% | 162 | 0.74% | 6,400[lower-alpha 2] | 29.32% | 21,829 |
| Uintah | 9,810 | 76.66% | 995 | 7.78% | 1,496 | 11.69% | 275 | 2.15% | 43 | 0.34% | 129 | 1.01% | 49 | 0.38% | 8,314[lower-alpha 2] | 64.97% | 12,797 |
| Utah | 102,182 | 50.70% | 28,522 | 14.15% | 60,532 | 30.03% | 6,437 | 3.19% | 1,030 | 0.51% | 1,994 | 0.99% | 854 | 0.42% | 41,650[lower-alpha 2] | 20.66% | 201,551 |
| Wasatch | 6,115 | 50.45% | 3,063 | 25.27% | 2,315 | 19.10% | 409 | 3.37% | 70 | 0.58% | 103 | 0.85% | 45 | 0.37% | 3,052 | 25.18% | 12,120 |
| Washington | 42,650 | 68.83% | 10,288 | 16.60% | 6,565 | 10.60% | 1,473 | 2.38% | 290 | 0.47% | 459 | 0.74% | 238 | 0.38% | 32,362 | 52.23% | 61,963 |
| Wayne | 966 | 67.98% | 271 | 19.07% | 135 | 9.50% | 18 | 1.27% | 12 | 0.84% | 14 | 0.99% | 5 | 0.35% | 695 | 48.91% | 1,421 |
| Weber | 40,235 | 47.31% | 23,131 | 27.20% | 16,451 | 19.35% | 3,371 | 3.96% | 937 | 1.10% | 465 | 0.55% | 449 | 0.53% | 17,104 | 20.11% | 85,039 |
| Totals | 515,231 | 45.54% | 310,676 | 27.46% | 243,690 | 21.54% | 39,608 | 3.50% | 9,438 | 0.83% | 8,032 | 0.71% | 4,755 | 0.42% | 204,555 | 18.08% | 1,131,430 |
By congressional district
Trump won all four congressional districts.[22]
| District | Trump | Clinton | McMullin | Representative |
|---|---|---|---|---|
| 1st | 50% | 22% | 22% | Rob Bishop |
| 2nd | 46% | 32% | 17% | Chris Stewart |
| 3rd | 47% | 23% | 25% | Jason Chaffetz |
| 4th | 39% | 32% | 23% | Mia Love |
Analysis
Utah gave the Republican nominee a 45 percent plurality and thus awarded him six electoral votes. This was the lowest percent of the vote Trump received in a state he won in 2016.[23][24] Trump received a much lower percentage of the vote in Utah than did Mitt Romney in 2012.[25] In particular, Trump underperformed Romney by over 30 percentage points in the Provo-Orem, Logan, and Ogden metropolitan areas. Meanwhile, Clinton improved on Obama's performance in all of these areas.[26] Trump received only 45 percent of the vote among Utah members of the LDS Church, barely half the proportion that Romney won in 2012. This was also much lower than the 61 percent of the LDS Church's vote Trump received nationally.[27]
Evan McMullin's 21.3 percent of the vote is the strongest third-party performance in any state since Ross Perot during the 1992 presidential election.[lower-alpha 3][28][29] He finished second ahead of Clinton in fifteen of Utah's twenty-nine counties, becoming the first third-party candidate since Perot to outpoll a major party candidate in any county nationwide, and only the fifth since 1928 to do so in any non-Southern county.[lower-alpha 4] In Utah County, he received almost thirty percent of the vote, about twice as much as Clinton and more than any non-Republican presidential candidate since 1968.[30]
See also
Notes
- Robert Marion La Follette senior in 1924 did win his home state of Wisconsin under an “Independent” banner,[18] and exceeded McMullin performance under a similar “Independent” banner in Minnesota, South Dakota, Nevada and Oregon. In 1912, Theodore Roosevelt also exceeded McMullin’s vote share under the “Independent” banner in Kansas, as did James B. Weaver in South Dakota in 1892.
- In this county where McMullin ran second ahead of Clinton, margin given is Trump vote minum McMullin vote and percentage margin Trump percentage minus McMullin percentage.
- Perot exceeded McMullin’s Utah performance in twenty-six of the fifty states in 1992, with his best performance being 30.44 percent in Maine.
- The other four were William Lemke in the North Dakota counties of Burke, Divide, Williams, Mountrail and Towner in 1936, George Wallace in Utah’s own Kane County in 1968, John G. Schmitz in the four Idaho counties of Fremont, Jefferson, Lemhi and Madison in 1972, and Perot in numerous counties in 1992 and a few in 1996.
References
- "2016 General Election Results" (PDF). 2016-11-28. Retrieved 2017-04-23.
- "2016 Primary Schedule – 2016 Election Central". Uspresidentialelectionnews.com. Retrieved 2016-11-13.
- "United States House of Representatives floor summary for Jan 8, 2009". Clerk.house.gov. Archived from the original on April 2, 2012. Retrieved January 30, 2009.
- "Federal elections 2008" (PDF). Federal Election Commission. Retrieved May 11, 2015.
- "President Map". The New York Times. November 29, 2012. Retrieved May 11, 2015.
- "Election Other – President Obama Job Approval". RealClearPolitics. Retrieved December 24, 2015.
- Byrnes, Jesse (2016-06-15). "Poll: Obama approval rating highest since 2012". TheHill. Retrieved 2016-06-19.
- Cohn, Nate (2015-01-19). "What a Rise in Obama's Approval Rating Means for 2016". The New York Times. ISSN 0362-4331. Retrieved 2016-06-19.
- "Joe Biden Decides Not to Enter Presidential Race". The Wall Street Journal. Retrieved October 21, 2015.
- Bickel, Joshua. "How the Faithful Voted: 2012 Preliminary Analysis". Pew Research Center. Pew Research Center. Retrieved 15 July 2016.
- Schleifer, Theodore (19 March 2016). "Trump on Romney: 'Are you sure he's a Mormon?'". CNN. Turner Broadcasting System, Inc. Retrieved 15 July 2016.
- Azari, Julia. "The States That Love (And Hate) Third-Party Candidates". FiveThirtyEight. FiveThirtyEight. Retrieved 15 July 2016.
- Kondik, Kyle; Sabato, Larry; Skelley, Geoffrey. "The Electoral College: Map No. 2". Sabato's Crystal Ball. University of Virginia Center for Politics. Retrieved 15 July 2016.
- "UT Statewide Presidential Polling October 2016 Memo - Y2.pdf" (PDF). Dropbox. Retrieved 2016-11-13.
- Dennis Romboy. "Poll: Trump falls into tie with Clinton among Utah voters". Deseret News. Retrieved 2016-11-13.
- Mensch, Louise (2016-10-17). "EXCLUSIVE: Evan McMullin Utah Poll: Independent Conservative Ties Trump". Heatst.com. Retrieved 2016-11-13.
- "Emerson College Polls: Utah breaking for third-party candidate McMullin. Trump loses ground in New Hampshire, Pennsylvania and Missouri. Ayotte (R-NH) and Blunt (R-MO) are tied in Senate bids, while Toomey (R-PA) is holding on" (PDF). Media.wix.com. Emerson College Polling Society. Retrieved 2016-11-13.
- Dave Leip. "1924 Presidential General Election Results – Wisconsin". Dave Leip’s U.S. Election Atlas.
- "2016 Utah Election Preliminary Results". Utah Lieutenant Governor's Office. Retrieved November 26, 2016.
- "Statewide Federal Election Results". Utah Election Results. Retrieved December 17, 2016.
- Our Campaigns; UT US Presidential Election November 04 2016
- "Introducing the 2017 Cook Political Report Partisan Voter Index". The Cook Political Report.
- "2016 election results: Utah". edition.cnn.com.
- Roche, Lisa Riley (2018-09-26). "Poll: Majority of Utahns don't want second term for Trump". KSL. Retrieved 2019-05-05.
- "See a Map That Shows Exactly Why Trump Won". Time. 2016-12-01. Retrieved 2019-05-05.
- Florida, Richard (2016-12-07). "The Metro Areas That Swung for Trump and Clinton". Citylab. Retrieved 2019-05-05.
- Gehrke, Robert (2016-11-18). "While Mormons nationally stuck with Trump, in Utah he lagged". Salt Lake Tribune. Retrieved 2019-05-05.
- "2016 Presidential Election Statistics". Dave Leip’s Atlas of U.S. Presidential Elections. Retrieved 2018-03-05.
- McCombs, Brady (2016-11-09). "Trump wins Utah to extend GOP's 5-decade winning streak". Associated Press. Retrieved 2019-05-05.
- England, Katie (2016-11-28). "Utah County gave Evan McMullin highest percentage of votes of any non-Republican since 1968". Daily Herald. Retrieved 2019-05-05.
External links
- RNC 2016 Republican Nominating Process
- Green papers for 2016 primaries, caucuses, and conventions
- Official final canvass