2016 United States presidential election in Tennessee
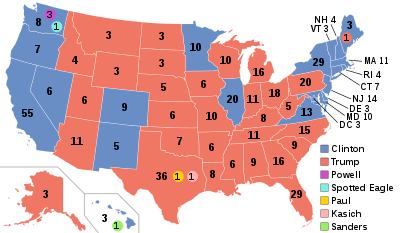
The 2016 United States presidential election in Tennessee was held on November 8, 2016, as part of the 2016 General Election in which all 50 states plus the District of Columbia participated. Tennessee voters chose electors to represent them in the Electoral College via a popular vote pitting the Republican Party's nominee, businessman Donald Trump, and running mate Indiana Governor Mike Pence against Democratic Party nominee, former Secretary of State Hillary Clinton and her running mate, Virginia Senator Tim Kaine.
| ||||||||||||||||||||||||||
| Turnout | 61.92% | |||||||||||||||||||||||||
|---|---|---|---|---|---|---|---|---|---|---|---|---|---|---|---|---|---|---|---|---|---|---|---|---|---|---|
| ||||||||||||||||||||||||||
 County results Trump: 50–60% 60–70% 70–80% 80–90% Clinton: 50–60% 60–70% | ||||||||||||||||||||||||||
| ||||||||||||||||||||||||||
.jpg)

On March 1, 2016, in the presidential primaries, Tennessee voters expressed their preferences for the Democratic and Republican parties' respective nominees for president. Registered members of each party only voted in their party's primary, while voters who were unaffiliated chose any one primary in which to vote.
Donald Trump won the election in the Volunteer State with 60.7% of the vote. Hillary Clinton received 34.7% of the vote.[1] This is the largest margin of victory for a presidential candidate for either party since 1972 with Richard Nixon, and also the first time since that either party has earned over 60% of the vote in Tennessee.
Tennessee was one of eleven states Bill Clinton won in 1992 and 1996 which Hillary Clinton lost.
Background
Tennessee has not voted for a Democratic presidential nominee since 1996. In 2012, Republican nominee Mitt Romney won the state by a margin of more than twenty points, due to the unpopularity of the Obama administration in the conservative state. Typically Democrats do very well in the urban regions of Memphis and Nashville, while Republicans dominate the rural and suburban areas. Tennessee is considered a safe Republican state. In 2016, it stayed that way with Trump winning the state with 60.7% of the vote.
Primary elections
Democratic primary
- Results
| Tennessee Democratic primary, March 1, 2016 | |||||
|---|---|---|---|---|---|
| Candidate | Popular vote | Estimated delegates | |||
| Count | Percentage | Pledged | Unpledged | Total | |
| Hillary Clinton | 245,930 | 66.07% | 44 | 7 | 51 |
| Bernie Sanders | 120,800 | 32.45% | 23 | 0 | 23 |
| Martin O'Malley (withdrawn) | 2,025 | 0.54% | |||
| Uncommitted | 3,467 | 0.93% | 0 | 1 | 1 |
| Total | 372,222 | 100% | 67 | 8 | 75 |
| Source: The Green Papers | |||||
Republican primary
| |||||||||||||||||||||||||||||||||||||||||||||||
| |||||||||||||||||||||||||||||||||||||||||||||||
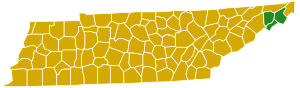
 Tennessee results by county
Donald Trump
Marco Rubio | |||||||||||||||||||||||||||||||||||||||||||||||
.jpg)
| Tennessee Republican primary, March 1, 2016 | |||||
|---|---|---|---|---|---|
| Candidate | Votes | Percentage | Actual delegate count | ||
| Bound | Unbound | Total | |||
| Donald Trump | 333,180 | 38.94% | 33 | 0 | 33 |
| Ted Cruz | 211,471 | 24.71% | 16 | 0 | 16 |
| Marco Rubio | 181,274 | 21.18% | 9 | 0 | 9 |
| Ben Carson | 64,951 | 7.59% | 0 | 0 | 0 |
| John Kasich | 45,301 | 5.29% | 0 | 0 | 0 |
| Jeb Bush (withdrawn) | 9,551 | 1.12% | 0 | 0 | 0 |
| Mike Huckabee (withdrawn) | 2,415 | 0.28% | 0 | 0 | 0 |
| Rand Paul (withdrawn) | 2,350 | 0.27% | 0 | 0 | 0 |
| Uncommitted | 1,849 | 0.22% | 0 | 0 | 0 |
| Chris Christie (withdrawn) | 1,256 | 0.15% | 0 | 0 | 0 |
| Carly Fiorina (withdrawn) | 715 | 0.08% | 0 | 0 | 0 |
| Rick Santorum (withdrawn) | 710 | 0.08% | 0 | 0 | 0 |
| Jim Gilmore (withdrawn) | 267 | 0.03% | 0 | 0 | 0 |
| Lindsey Graham (withdrawn) | 253 | 0.03% | 0 | 0 | 0 |
| George Pataki (withdrawn) | 186 | 0.02% | 0 | 0 | 0 |
| Unprojected delegates: | 0 | 0 | 0 | ||
| Total: | 855,729 | 100.00% | 58 | 0 | 58 |
| Source: The Green Papers | |||||
Polling
General election
Predictions
- CNN: Solid Trump[2]
- Cook Political Report: Solid Trump[3]
- Electoral-vote.com: Likely Trump[4]
- Los Angeles Times: Solid Trump[5]
- NBC: Likely Trump^[6]
- RealClearPolitics: Likely Trump[7]
- Sabato's Crystal Ball: Safe Trump[8]
^Highest rating given
Results
| Party | Candidate | Votes | % | |
|---|---|---|---|---|
| Republican | Donald Trump | 1,522,925 | 60.72% | |
| Democratic | Hillary Clinton | 870,695 | 34.72% | |
| Libertarian | Gary Johnson | 70,397 | 2.81% | |
| Green | Jill Stein | 15,993 | 0.64% | |
| Independent | Evan McMullin (write-in) | 11,991 | 0.48% | |
| Independent | Mike Smith | 7,276 | 0.29% | |
| Reform | Rocky De La Fuente | 4,075 | 0.16% | |
| Socialist Workers | Alyson Kennedy | 2,877 | 0.12% | |
| Independent | Write-in | 1,798 | 0.07% | |
| Total votes | 2,508,027 | 100.00% | ||
By congressional district
Trump won 7 of 9 congressional districts.[10]
| District | Trump | Clinton | Representative |
|---|---|---|---|
| 1st | 76% | 20% | Phil Roe |
| 2nd | 65% | 30% | Jimmy Duncan |
| 3rd | 61% | 38% | Chuck Fleischmann |
| 4th | 68% | 27% | Scott DesJarlais |
| 5th | 38% | 56% | Jim Cooper |
| 6th | 72% | 24% | Diane Black |
| 7th | 67% | 28% | Marsha Blackburn |
| 8th | 66% | 31% | Stephen Fincher |
| David Kustoff | |||
| 9th | 20% | 77% | Steve Cohen |
By county
| County | Clinton% | Clinton# | Trump% | Trump# | Others% | Others# | Total |
|---|---|---|---|---|---|---|---|
| Anderson | 30.16% | 9,013 | 64.30% | 19,212 | 5.54% | 1,656 | 29,881 |
| Bedford | 22.11% | 3,395 | 74.80% | 11,486 | 3.09% | 474 | 15,355 |
| Benton | 23.29% | 1,474 | 74.53% | 4,716 | 2.18% | 138 | 6,328 |
| Bledsoe | 19.23% | 897 | 77.66% | 3,622 | 3.11% | 145 | 4,664 |
| Blount | 23.18% | 12,100 | 71.72% | 37,443 | 5.10% | 2,665 | 52,208 |
| Bradley | 18.28% | 7,070 | 76.99% | 29,768 | 4.73% | 1,828 | 38,666 |
| Campbell | 17.94% | 2,248 | 78.76% | 9,870 | 3.30% | 414 | 12,532 |
| Cannon | 21.21% | 1,127 | 75.40% | 4,007 | 3.39% | 180 | 5,314 |
| Carroll | 22.41% | 2,327 | 74.69% | 7,756 | 2.90% | 301 | 10,384 |
| Carter | 16.38% | 3,453 | 80.15% | 16,898 | 3.48% | 733 | 21,084 |
| Cheatham | 24.35% | 3,878 | 70.94% | 11,297 | 4.70% | 749 | 15,924 |
| Chester | 19.10% | 1,243 | 78.09% | 5,081 | 2.81% | 183 | 6,507 |
| Claiborne | 17.06% | 1,832 | 80.09% | 8,602 | 2.85% | 306 | 10,740 |
| Clay | 24.21% | 707 | 73.32% | 2,141 | 2.47% | 72 | 2,920 |
| Cocke | 16.34% | 1,981 | 80.74% | 9,791 | 2.92% | 354 | 12,126 |
| Coffee | 23.75% | 4,743 | 72.19% | 14,417 | 4.06% | 811 | 19,971 |
| Crockett | 24.14% | 1,303 | 73.78% | 3,982 | 2.08% | 112 | 5,397 |
| Cumberland | 19.73% | 5,202 | 77.44% | 20,413 | 2.83% | 745 | 26,360 |
| Davidson | 59.77% | 148,864 | 33.95% | 84,550 | 6.29% | 15,654 | 249,068 |
| Decatur | 19.47% | 894 | 78.14% | 3,588 | 2.40% | 110 | 4,592 |
| DeKalb | 22.56% | 1,569 | 74.35% | 5,171 | 3.09% | 215 | 6,955 |
| Dickson | 25.25% | 4,722 | 70.77% | 13,233 | 3.98% | 744 | 18,699 |
| Dyer | 21.12% | 2,816 | 76.33% | 10,180 | 2.55% | 340 | 13,336 |
| Fayette | 30.29% | 5,874 | 67.31% | 13,055 | 2.40% | 465 | 19,394 |
| Fentress | 15.00% | 1,100 | 82.34% | 6,038 | 2.66% | 195 | 7,333 |
| Franklin | 26.66% | 4,374 | 70.30% | 11,532 | 3.04% | 498 | 16,404 |
| Gibson | 26.90% | 5,258 | 70.53% | 13,786 | 2.57% | 503 | 19,547 |
| Giles | 26.19% | 2,917 | 71.56% | 7,970 | 2.24% | 250 | 11,137 |
| Grainger | 14.41% | 1,154 | 82.74% | 6,626 | 2.85% | 228 | 8,008 |
| Greene | 17.88% | 4,216 | 78.71% | 18,562 | 3.41% | 805 | 23,583 |
| Grundy | 20.97% | 999 | 76.34% | 3,636 | 2.69% | 128 | 4,763 |
| Hamblen | 19.69% | 4,075 | 76.63% | 15,857 | 3.67% | 760 | 20,692 |
| Hamilton | 38.84% | 55,316 | 55.29% | 78,733 | 5.87% | 8,359 | 142,408 |
| Hancock | 14.43% | 322 | 82.61% | 1,843 | 2.96% | 66 | 2,231 |
| Hardeman | 45.13% | 4,185 | 53.05% | 4,919 | 1.82% | 169 | 9,273 |
| Hardin | 16.30% | 1,622 | 80.53% | 8,012 | 3.17% | 315 | 9,949 |
| Hawkins | 16.88% | 3,507 | 80.14% | 16,648 | 2.98% | 619 | 20,774 |
| Haywood | 54.30% | 3,711 | 44.09% | 3,013 | 1.61% | 110 | 6,834 |
| Henderson | 17.62% | 1,800 | 79.65% | 8,138 | 2.73% | 279 | 10,217 |
| Henry | 23.66% | 3,063 | 73.45% | 9,508 | 2.89% | 374 | 12,945 |
| Hickman | 23.35% | 1,824 | 72.89% | 5,695 | 3.76% | 294 | 7,813 |
| Houston | 27.34% | 866 | 68.88% | 2,182 | 3.79% | 120 | 3,168 |
| Humphreys | 27.50% | 1,967 | 68.92% | 4,930 | 3.58% | 256 | 7,153 |
| Jackson | 25.28% | 1,129 | 72.46% | 3,236 | 2.26% | 101 | 4,466 |
| Jefferson | 18.32% | 3,494 | 77.47% | 14,776 | 4.21% | 802 | 19,072 |
| Johnson | 15.02% | 988 | 82.23% | 5,410 | 2.75% | 181 | 6,579 |
| Knox | 34.80% | 62,878 | 58.53% | 105,767 | 6.67% | 12,052 | 180,697 |
| Lake | 29.29% | 577 | 68.88% | 1,357 | 1.83% | 36 | 1,970 |
| Lauderdale | 37.79% | 3,056 | 60.39% | 4,884 | 1.82% | 147 | 8,087 |
| Lawrence | 18.01% | 2,821 | 79.28% | 12,420 | 2.71% | 425 | 15,666 |
| Lewis | 19.26% | 890 | 77.56% | 3,585 | 3.18% | 147 | 4,622 |
| Lincoln | 19.13% | 2,554 | 77.90% | 10,398 | 2.97% | 396 | 13,348 |
| Loudon | 21.03% | 4,919 | 75.29% | 17,610 | 3.69% | 862 | 23,391 |
| Macon | 14.29% | 1,072 | 83.46% | 6,263 | 2.25% | 169 | 7,504 |
| Madison | 40.52% | 15,448 | 55.97% | 21,335 | 3.51% | 1,337 | 38,120 |
| Marion | 26.07% | 2,832 | 70.85% | 7,696 | 3.07% | 334 | 10,862 |
| Marshall | 24.90% | 2,852 | 71.44% | 8,184 | 3.66% | 419 | 11,455 |
| Maury | 28.38% | 10,038 | 67.29% | 23,799 | 4.33% | 1,532 | 35,369 |
| McMinn | 18.72% | 3,510 | 78.33% | 14,691 | 2.95% | 554 | 18,755 |
| McNairy | 18.41% | 1,848 | 78.11% | 7,841 | 3.48% | 349 | 10,038 |
| Meigs | 19.81% | 856 | 77.36% | 3,342 | 2.82% | 122 | 4,320 |
| Monroe | 18.64% | 3,186 | 78.24% | 13,374 | 3.12% | 533 | 17,093 |
| Montgomery | 37.66% | 21,699 | 56.13% | 32,341 | 6.21% | 3,580 | 57,620 |
| Moore | 16.95% | 496 | 79.46% | 2,325 | 3.59% | 105 | 2,926 |
| Morgan | 15.72% | 1,054 | 81.15% | 5,441 | 3.13% | 210 | 6,705 |
| Obion | 19.81% | 2,426 | 77.77% | 9,526 | 2.42% | 297 | 12,249 |
| Overton | 23.64% | 1,945 | 73.63% | 6,059 | 2.73% | 225 | 8,229 |
| Perry | 20.91% | 597 | 75.90% | 2,167 | 3.19% | 91 | 2,855 |
| Pickett | 20.50% | 536 | 77.28% | 2,021 | 2.22% | 58 | 2,615 |
| Polk | 19.20% | 1,252 | 78.17% | 5,097 | 2.62% | 171 | 6,520 |
| Putnam | 25.18% | 6,851 | 69.83% | 19,002 | 4.99% | 1,359 | 27,212 |
| Rhea | 17.56% | 1,942 | 78.29% | 8,660 | 4.16% | 460 | 11,062 |
| Roane | 22.32% | 4,837 | 73.28% | 15,880 | 4.39% | 952 | 21,669 |
| Robertson | 24.48% | 6,637 | 71.59% | 19,410 | 3.93% | 1,066 | 27,113 |
| Rutherford | 34.17% | 36,706 | 60.05% | 64,515 | 5.78% | 6,215 | 107,436 |
| Scott | 13.11% | 934 | 84.85% | 6,044 | 2.04% | 145 | 7,123 |
| Sequatchie | 18.49% | 1,053 | 77.99% | 4,441 | 3.51% | 200 | 5,694 |
| Sevier | 17.34% | 6,297 | 78.84% | 28,629 | 3.82% | 1,386 | 36,312 |
| Shelby | 61.95% | 208,992 | 34.48% | 116,344 | 3.57% | 12,047 | 337,383 |
| Smith | 22.71% | 1,689 | 73.88% | 5,494 | 3.40% | 253 | 7,436 |
| Stewart | 23.06% | 1,222 | 72.92% | 3,864 | 4.02% | 213 | 5,299 |
| Sullivan | 20.20% | 12,578 | 75.43% | 46,979 | 4.37% | 2,721 | 62,278 |
| Sumner | 25.40% | 18,161 | 70.11% | 50,129 | 4.50% | 3,215 | 71,505 |
| Tipton | 24.64% | 5,785 | 72.02% | 16,910 | 3.35% | 786 | 23,481 |
| Trousdale | 29.94% | 946 | 66.55% | 2,103 | 3.51% | 111 | 3,160 |
| Unicoi | 17.54% | 1,262 | 78.82% | 5,671 | 3.64% | 262 | 7,195 |
| Union | 16.20% | 1,012 | 80.89% | 5,053 | 2.91% | 182 | 6,247 |
| Van Buren | 22.28% | 539 | 75.24% | 1,820 | 2.48% | 60 | 2,419 |
| Warren | 25.97% | 3,535 | 70.09% | 9,540 | 3.95% | 537 | 13,612 |
| Washington | 26.18% | 13,024 | 68.85% | 34,252 | 4.97% | 2,474 | 49,750 |
| Wayne | 12.24% | 717 | 85.98% | 5,036 | 1.78% | 104 | 5,857 |
| Weakley | 22.75% | 2,772 | 73.93% | 9,008 | 3.32% | 404 | 12,184 |
| White | 18.78% | 1,845 | 78.08% | 7,671 | 3.15% | 309 | 9,825 |
| Williamson | 29.18% | 31,013 | 64.19% | 68,212 | 6.63% | 7,046 | 106,271 |
| Wilson | 25.36% | 14,385 | 69.46% | 39,406 | 5.19% | 2,943 | 56,734 |
See also
| Elections in Tennessee | ||||||||
|---|---|---|---|---|---|---|---|---|
 | ||||||||
|
||||||||
|
| ||||||||
References
- "Archived copy". Archived from the original on 2017-07-17. Retrieved 2017-07-26.CS1 maint: archived copy as title (link)
- Chalian, David (4 November 2016). "Road to 270: CNN's new election map". CNN. Retrieved 10 February 2019.
- "2016 Electoral Scorecard". The Cook Political Report. 7 November 2016. Retrieved 10 February 2019.
- "2016 Predicted Electoral Map". Electoral-vote.com. Retrieved 10 February 2019.
- "Our final map has Clinton winning with 352 electoral votes. Compare your picks with ours". Los Angeles Times. 6 November 2016. Retrieved 10 February 2019.
- Todd, Chuck (7 November 2016). "NBC's final battleground map shows a lead for Clinton". NBC News. Retrieved 10 February 2019.
- "2016 Election Maps - Battle for White House". RealClearPolitics. Retrieved 10 February 2019.
- Sabato, Larry (7 November 2016). "The Crystal Ball's 2016 Electoral College ratings". University of Virginia Center for Politics. Retrieved 10 February 2019.
- "Archived copy" (PDF). Archived (PDF) from the original on 2016-12-15. Retrieved 2016-12-15.CS1 maint: archived copy as title (link)
- "Archived copy". Archived from the original on 2015-10-16. Retrieved 2015-10-16.CS1 maint: archived copy as title (link)
External links
- RNC 2016 Republican Nominating Process
- Green papers for 2016 primaries, caucuses, and conventions
- Decision Desk Headquarter Results for Tennessee