2016 United States presidential election in Washington (state)
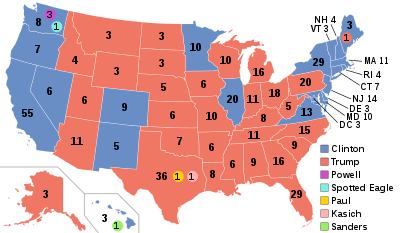
The 2016 United States presidential election in Washington was won by Hillary Rodham Clinton on November 8, 2016, with 54.3% of the vote over Donald Trump's 38.07%. All of Washington's 12 electoral votes were assigned to Clinton, though four defected. Trump prevailed in the presidential election nationally.
| |||||||||||||||||||||||||||||||||
| Turnout | 78.76% | ||||||||||||||||||||||||||||||||
|---|---|---|---|---|---|---|---|---|---|---|---|---|---|---|---|---|---|---|---|---|---|---|---|---|---|---|---|---|---|---|---|---|---|
| |||||||||||||||||||||||||||||||||
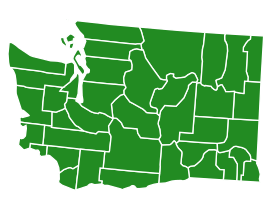
 County results Clinton: 40–50% 50–60% 60–70% 70–80% Trump: 40–50% 50–60% 60–70% 70–80% | |||||||||||||||||||||||||||||||||
| |||||||||||||||||||||||||||||||||
.jpg)


| Elections in Washington |
|---|
 |
|
General elections
Gubernatorial elections
Lieutenant Governor elections Attorney General elections Secretary of State elections State Senate elections State House elections State Supreme Court elections Other judicial elections |
|
|
In the presidential primaries, Washington voters chose Republican Party's nominee; the Democratic Party used the caucus system, and Green Party nominee was chosen in a convention.
Background
Washington has voted for the Democratic candidate in every presidential election since 1988. While the state's Senate was majority Republican in 2016, both of Washington's United States Senators are Democrats, as well as a majority of the state's U.S. House delegation. Barack Obama defeated John McCain by 17.08% in 2008 and Mitt Romney by 14.93% in 2012.
Primary elections
Democratic caucus
Bernie Sanders bested Hillary Clinton in the Democratic presidential caucus on March 26, 2016:
The state also held a non-binding presidential primary on May 24, the same date as the state's Republican primary. Hillary Clinton won the preference vote.
| Washington Democratic caucuses, March 26, 2016 | |||||
|---|---|---|---|---|---|
| Candidate | District delegates | Estimated delegates | |||
| Count | Percentage | Pledged | Unpledged | Total | |
| Bernie Sanders | 19,159 | 72.72% | 74 | 0 | 74 |
| Hillary Clinton | 7,140 | 27.10% | 27 | 10 | 37 |
| Others | |||||
| Uncommitted | 46 | 0.18% | 0 | 7 | 7 |
| Total | 26,345 | 100% | 101 | 17 | 118 |
| Source: The Green Papers | |||||
| Washington Democratic primary, May 24, 2016 | |||||
|---|---|---|---|---|---|
| Candidate | Popular vote | Estimated delegates | |||
| Count | Percentage | Pledged | Unpledged | Total | |
| Hillary Clinton | 420,461 | 52.38% | 0 | 0 | 0 |
| Bernie Sanders | 382,293 | 47.62% | 0 | 0 | 0 |
| Others | |||||
| Uncommitted | |||||
| Total | 802,754 | 100% | 0 | 0 | 0 |
| Source: Washington Secretary of State - Official Results | |||||
Republican primary
Four candidates appeared on the Republican presidential primary ballot on May 24, 2016:
- Ben Carson (withdrawn)
- Ted Cruz (withdrawn)
- John Kasich (withdrawn)
- Donald Trump
| Washington Republican primary, May 24, 2016 | |||||
|---|---|---|---|---|---|
| Candidate | Votes | Percentage | Actual delegate count | ||
| Bound | Unbound | Total | |||
| Donald Trump | 455,023 | 75.46% | 41 | 0 | 41 |
| Ted Cruz (withdrawn) | 65,172 | 10.81% | 0 | 0 | 0 |
| John Kasich (withdrawn) | 58,954 | 9.78% | 0 | 0 | 0 |
| Ben Carson (withdrawn) | 23,849 | 3.96% | 0 | 0 | 0 |
| Uncommitted | 3 | 0 | 3 | ||
| Unprojected delegates: | 0 | 0 | 0 | ||
| Total: | 602,998 | 100.00% | 44 | 0 | 44 |
| Source: The Green Papers | |||||
Green convention
This state's Green Party state convention was on May 15. Ballots were emailed to members within a week after the convention.[2]
| Washing Green Party Convention, May 15, 2016. | |||
|---|---|---|---|
| Candidate | Votes | Percentage | National delegates |
| Jill Stein | - | 91.7 | 5 |
| William Kreml | - | - | - |
| Sedinam Kinamo Christin Moyowasifza Curry | - | - | - |
| Kent Mesplay | - | - | - |
| Darryl Cherney | - | - | - |
| Total | - | - | 5 |
General election
Polling
State voting history
Washington joined the Union in November 1889 and has participated in all elections from 1892 onwards.
Since 1900, Washington voted Democratic 51.72 percent of the time and Republican 44.83 percent of the time. Since 1988, Washington had voted for the Democratic Party in each presidential election, and the same was expected to happen in 2016.[3]
Results
| United States presidential election in Washington, 2016[4] | ||||||
|---|---|---|---|---|---|---|
| Party | Candidate | Running mate | Votes | Percentage | Electoral votes | |
| Democratic | Hillary Clinton | Tim Kaine | 1,742,718 | 54.30% | 8 | |
| Republican | Donald Trump | Mike Pence | 1,221,747 | 38.07% | 0 | |
| Libertarian | Gary Johnson | William Weld | 160,879 | 5.01% | 0 | |
| Write-ins | 102,416 | 3.23% | 0 | |||
| Green | Jill Stein | Ajamu Baraka | 58,417 | 1.82% | 0 | |
| Constitution | Darrell Castle | Scott Bradley | 17,623 | 0.55% | 0 | |
| Socialist Workers | Alyson Kennedy | Osborne Hart | 4,307 | 0.13% | 0 | |
| Socialism and Liberation | Gloria La Riva | Eugene Puryear | 3,523 | 0.11% | 0 | |
| Republican | Colin Powell | 0 | 0.00% | 3 | ||
| Independent | Faith Spotted Eagle | Winona LaDuke | 0 | 0.00% | 1 | |
| Totals (excluding write-ins) | 3,209,214 | 100.00% | 12 | |||
Analysis
Hillary Clinton won the election in Washington with 54.3 percent of the vote, a slightly reduced percentage from President Obama in 2012. However, Washington was among the states in which Hillary Clinton outperformed Barack Obama's winning margin in 2012, despite the Democratic nominee losing the Electoral College this time. [5] Donald Trump received 38.1 percent of the vote. This was the first presidential election in which the Republican Party won Grays Harbor and Pacific Counties since 1928 and 1952 respectively.[6][7] It was also the first time the GOP had won Cowlitz County since Ronald Reagan in 1980, and the first Republican win in Mason County since Reagan in 1984.[8]
Despite Clinton's victory, four Democratic electors defected. Three voted for Colin Powell, making him the first African-American Republican to receive electoral votes, while a Native American activist cast his vote for Faith Spotted Eagle, making her the first Native American to receive an electoral vote for president.
Powell became the first Republican to receive electoral votes from Washington state since Ronald Reagan in 1984.[8] However, overall it was the eighth consecutive election in which Washington voted Democratic, and the twelfth in a row in which it voted the same way as neighboring Oregon.
By county
| County | Clinton% | Clinton# | Trump% | Trump# | Others (excluding write-ins)% | Others (excluding write-ins)# | Total |
|---|---|---|---|---|---|---|---|
| Adams | 28.32% | 1,299 | 67.21% | 3,083 | 5.64% | 262 | 4,644 |
| Asotin | 32.59% | 3,134 | 59.70% | 5,741 | 8.84% | 861 | 9,736 |
| Benton | 33.26% | 26,360 | 59.55% | 47,194 | 8.09% | 6,473 | 80,027 |
| Chelan | 39.34% | 13,032 | 54.68% | 18,114 | 6.69% | 2,234 | 33,380 |
| Clallam | 45.19% | 17,677 | 48.04% | 18,794 | 7.57% | 2,986 | 39,457 |
| Clark | 46.70% | 92,757 | 46.54% | 92,441 | 7.48% | 14,962 | 200,160 |
| Columbia | 24.37% | 526 | 69.37% | 1,497 | 7.29% | 159 | 2,182 |
| Cowlitz | 39.60% | 17,908 | 53.48% | 24,185 | 7.88% | 3,599 | 45,692 |
| Douglas | 31.89% | 4,918 | 62.28% | 9,603 | 6.58% | 1,022 | 15,543 |
| Ferry | 30.94% | 1,098 | 62.05% | 2,202 | 8.36% | 301 | 3,601 |
| Franklin | 37.87% | 8,886 | 56.28% | 13,206 | 6.86% | 1,628 | 23,720 |
| Garfield | 22.65% | 279 | 69.07% | 851 | 9.31% | 116 | 1,246 |
| Grant | 27.89% | 7,810 | 66.12% | 18,518 | 7.12% | 2,018 | 28,346 |
| Grays Harbor | 42.78% | 12,020 | 50.06% | 14,067 | 8.04% | 2,280 | 28,367 |
| Island | 49.26% | 20,960 | 43.39% | 18,465 | 8.05% | 3,451 | 42,876 |
| Jefferson | 62.82% | 12,656 | 29.97% | 6,037 | 7.81% | 1,583 | 20,276 |
| King | 72.32% | 718,322 | 21.78% | 216,339 | 6.39% | 63,838 | 998,499 |
| Kitsap | 51.28% | 63,156 | 39.80% | 49,018 | 9.77% | 12,143 | 124,317 |
| Kittitas | 39.81% | 7,489 | 53.69% | 10,100 | 7.21% | 1,366 | 18,955 |
| Klickitat | 39.33% | 4,194 | 54.29% | 5,789 | 7.30% | 786 | 10,769 |
| Lewis | 28.54% | 9,654 | 65.02% | 21,992 | 7.33% | 2,503 | 34,149 |
| Lincoln | 22.00% | 1,244 | 72.66% | 4,108 | 6.32% | 361 | 5,713 |
| Mason | 43.16% | 11,993 | 49.22% | 13,677 | 8.56% | 2,403 | 28,073 |
| Okanogan | 37.24% | 6,298 | 56.82% | 9,610 | 6.92% | 1,183 | 17,091 |
| Pacific | 43.52% | 4,620 | 50.49% | 5,360 | 6.87% | 736 | 10,716 |
| Pend Oreille | 28.74% | 1,934 | 64.99% | 4,373 | 7.28% | 495 | 6,802 |
| Pierce | 49.95% | 172,538 | 42.51% | 146,824 | 8.36% | 29,123 | 348,485 |
| San Juan | 66.85% | 7,172 | 25.05% | 2,688 | 8.48% | 914 | 10,774 |
| Skagit | 48.07% | 26,690 | 44.55% | 24,736 | 8.12% | 4,542 | 55,968 |
| Skamania | 39.97% | 2,232 | 52.44% | 2,928 | 8.49% | 479 | 5,639 |
| Snohomish | 54.60% | 185,227 | 37.81% | 128,255 | 8.38% | 28,691 | 342,173 |
| Spokane | 41.75% | 93,767 | 50.50% | 113,435 | 8.82% | 20,044 | 227,246 |
| Stevens | 25.78% | 5,767 | 67.78% | 15,161 | 7.71% | 1,749 | 22,677 |
| Thurston | 53.62% | 68,798 | 37.90% | 48,624 | 9.26% | 11,988 | 129,410 |
| Wahkiakum | 35.60% | 832 | 57.51% | 1,344 | 7.72% | 182 | 2,358 |
| Walla Walla | 38.52% | 9,694 | 54.24% | 13,651 | 8.16% | 2,074 | 25,419 |
| Whatcom | 55.47% | 60,340 | 37.32% | 40,599 | 7.96% | 8,734 | 109,673 |
| Whitman | 47.66% | 8,146 | 43.31% | 7,403 | 10.15% | 1,756 | 17,305 |
| Yakima | 40.61% | 31,291 | 54.16% | 41,735 | 6.08% | 4,724 | 77,750 |
By congressional district
Clinton won 7 of 10 congressional districts including one represented by a Republican.[9]
| District | Trump | Clinton | Representative |
|---|---|---|---|
| 1st | 38% | 54% | Suzan DelBene |
| 2nd | 35% | 57% | Rick Larsen |
| 3rd | 49% | 43% | Jaime Herrera Beutler |
| 4th | 58% | 35% | Dan Newhouse |
| 5th | 52% | 39% | Cathy McMorris Rodgers |
| 6th | 40% | 52% | Derek Kilmer |
| 7th | 12% | 82% | Jim McDermott |
| Pramila Jayapal | |||
| 8th | 45% | 48% | Dave Reichert |
| 9th | 23% | 71% | Adam Smith |
| 10th | 40% | 51% | Dennis Heck |
See also
References
- Secretary of State: Kim Wyman. "November 8, 2016 General Election Results". www.sos.wa.gov. Retrieved 2019-06-09.
- https://www.facebook.com/events/965157636872423/
- "Washington Presidential Election 2016 Results LIVE Updates". Archived from the original on 2016-10-13. Retrieved 2016-10-13.
- "November 8, 2016 General Election Results (Washington)". Washington Secretary of State. Retrieved 12 January 2017.
- "Washington Election Results 2016". The New York Times. 2017-08-01. ISSN 0362-4331. Retrieved 2019-06-09.
- http://results.vote.wa.gov/results/20161108/pacific/
- Wheel, Robert. "The 2016 Streak Breakers". Center for Politics. Larry J. Sabato’s Crystal Ball. Retrieved 13 November 2016.
- Sullivan, Robert David; ‘How the Red and Blue Map Evolved Over the Past Century’; America Magazine in The National Catholic Review; June 29, 2016
- Results (PDF). wei.sos.wa.gov (Report). Archived from the original (PDF) on 2018-06-30.